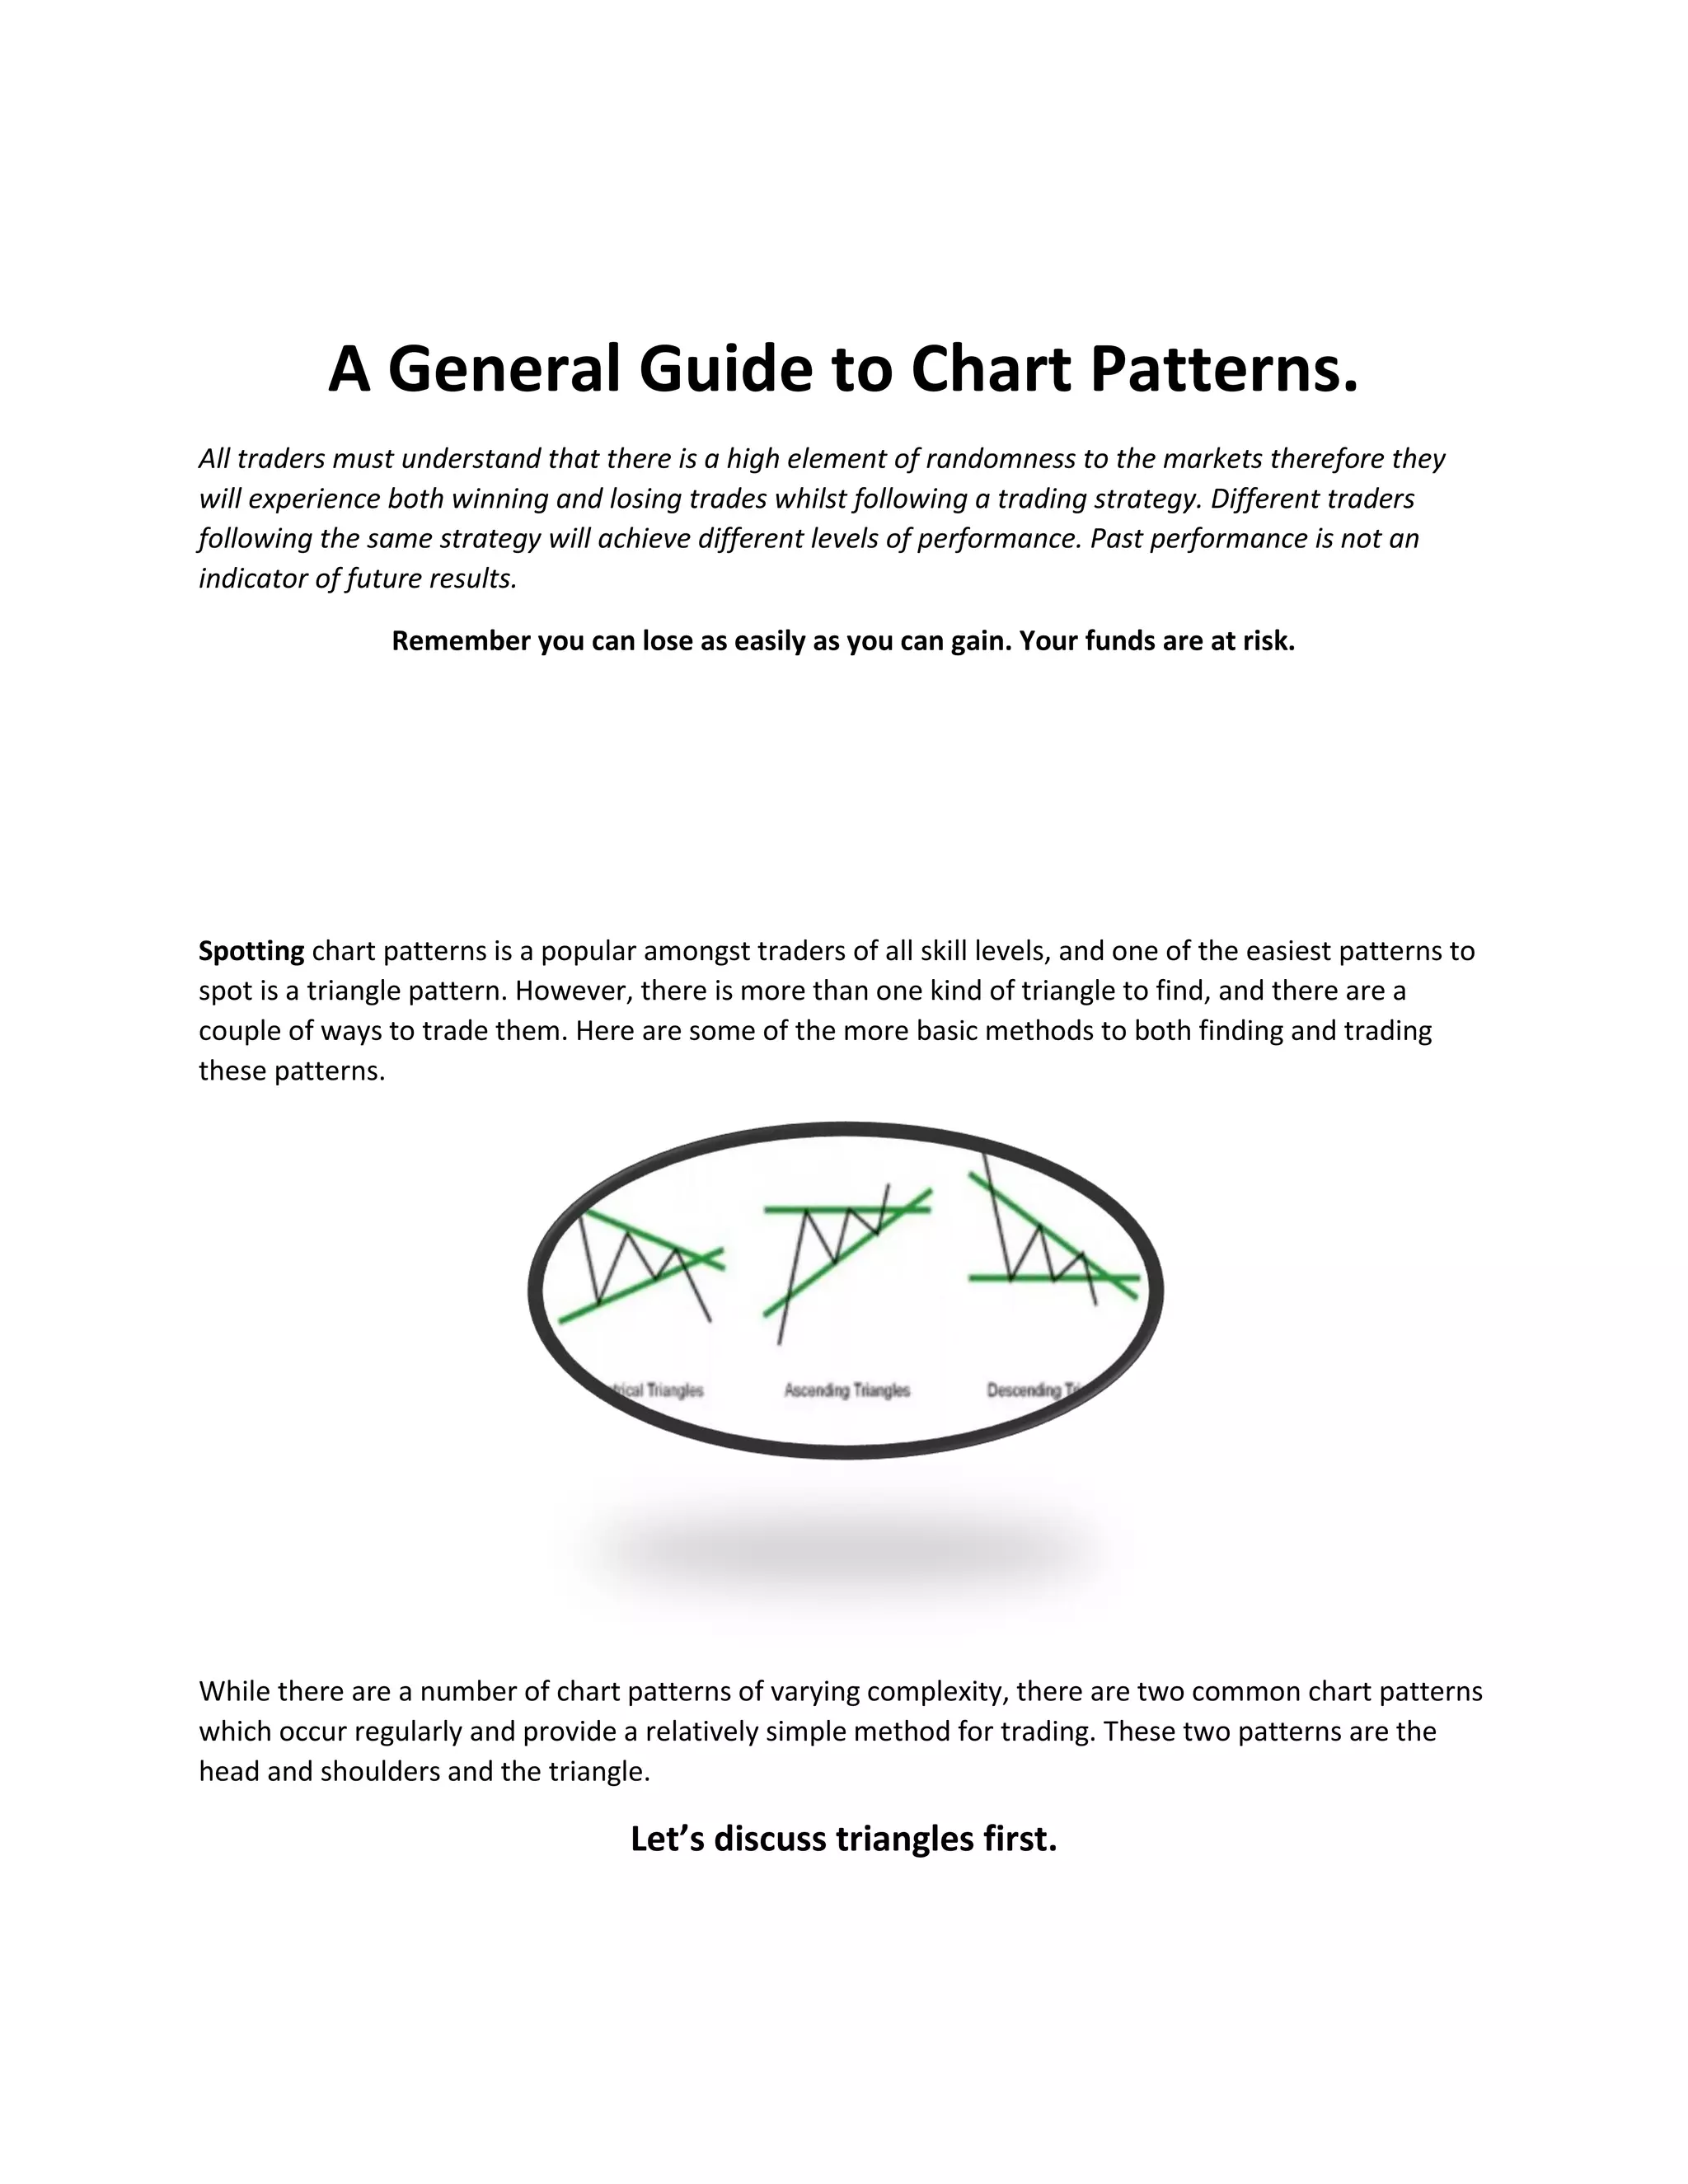
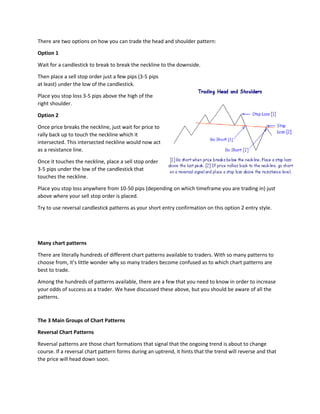
The Most Profitable Forex and Stock Chart PatternsSyrous Pejman
Two or three chart patterns are responsible for 70% of my successful Forex and stock trades. Learn these amazing chart patterns and use them in your daily trading and start making big money.
Top 8 Forex Trading Strategies That Pro Traders UseSyrous Pejman
In this slideshow find the best Forex trading strategies including chart patterns, price rejection, correlation trading, volume-price analysis, long term daily and weekly trading, news and sentiment trading strategies. Besides, you will learn the best money and risk management methods and also the best advice by the experts to control your psychology during your trades.
What are some of the advantages of using a scalping strategy to trade the forex market? - Quick profits Entry and exit is usually done within a couple of minutes. This allows for quick profits but can lead to quick losses as well. - Exit is usually within 20 minutes or less - Lots of trades Strategy uses 3 Indicators The strategy uses 3 indicators: pivot points, Fibonacci retracement and the Stochastic Oscillator. The 3 main pivot points both above and below the pivot are used for this system: S1, S2, S3 and R1, R2, R3. The Fibonacci retracement values used are the 0.618, the 0.382 and the 0.500 levels. The Stochastic Oscillator is set at 5,3,3.
http://www.CandlestickForums.com
Trading Strategies
Trading Strategies for Playing the Stock Market
Trading strategies discussed in this article include swing trading and day trading. Both are very similar but the main difference between theses two strategies is the time frame in which stocks are bought and held. In today’s article we will discuss both of these strategies as well as the advantages and disadvantages of each.
Swing trading typically involves a smaller position size than when day trading stock online. Additionally, swing traders will typically hold onto stocks for a few days to several weeks and then trade the stock on the basis of its intra-week or intra-month movements. Stop loss orders are placed wider than when day trading as well. When determining exits when swing trading there are rules that every trader should follow. It is very important that the trading strategies as well as the trading rules are understood before placing trades in this fashion. For instance, if the prior day’s low is taken out on the breakout day, or the high for shorts, then the trader should exit the trade. Also, once a trade is held overnight, a stop loss order should be placed no further away than below the recent consolidation area. A move beneath it would indicate a failure.
Swing trading stocks has its advantages and disadvantages as all trading strategies do. Some advantages include that swing traders can place fewer trades, therefore requiring fewer commissions and less chance of making a mistake. Additionally this type of stock trading provides the ability for successful traders to catch more significant multi-day profitable traders. A disadvantage to swing trading is the fact that the higher profit targets come with higher risk per trade. There is also overnight exposure that cannot be predicted.
Day trading stocks requires a larger positions size since you are looking for a smaller move within a short time frame. Unlike swing traders, a day trader may trade a few times per day or more! There are also rules with day trading that every investor should follow. For instance, they should always keep their profit objective at least 3 times greater than what they are willing to risk. Also, day traders should allow no more than 1% move against them from the entry point. There are many more trading strategies and rules when day trading that investors should learn in addition to these two rules.
forex trading strategy that you can make money with. Can also be use by using your android and iphone metatrader.
The settings on the indicator are easy to setup. The strategy best time frame is h4 and hourly chart.
http://www.pipsumo.com/2017/04/parabolic-sar-trading-strategy.html
Click here for more information on range trading
http://www.netpicks.com/simple-range-trading-strategy/
Here is some information on range trading:
It’s been said that a market only trends 30% of the time.
I can’t quantify that figure but having a range trading strategy to take advantage of the other 70% is good business.
Range trading is not difficult however it does require discipline and a method of determining when a trading range is in play.
For more information on range trading click here:
http://www.netpicks.com/simple-range-trading-strategy/
Would you like to learn secrets of price action trading which is used in every day trading by a 15 years trader? Continue reading on to learn real examples of how price action trading works on Forex, stock futures and gold charts!
Looking for best intraday trading rules? Platinum Trading Systems presents simple, easy & golden rules for Intraday trading. Get This 7 Rules and Earn More Money in Intraday.
“Forex Trading Strategies” is a complete guide of most popular and widely used strategies in Forex trade. You can read about day trading and its main types, understand the strategies based on market analysis, learn about portfolio and algorithmic trading, and many more. The book represents the ins and outs of each strategy - why and how it is used and how to get profit from trade. It is suitable for all traders who are novice in trade or want to improve their skills. All the strategies classified and explained here are for educational purposes and can be applied by each trader in a different way.
Stop Trading Support And Resistance The Wrong WayNetpicksTrading
Stop Trading Support And Resistance The Wrong Way
- See more at: http://www.netpicks.com/support-resistance/
Support and resistance trading is a popular technical analysis method of trading. The bad part is that many traders enter trades blindly at these levels without a firm understanding of what they mean.
Learn about trading support and resistance and see if your trading results improve.
- See more at: http://www.netpicks.com/support-resistance/
- Visit our website: http://www.netpicks.com/
- Download the free indicator blueprint: http://www.netpicks.com/blueprint/
- Options Hot List PLUS Training: http://www.netpicks.com/oftbrightbreakthroughs
support, resistance, support and resistance trading, reversals, trend
Elliott Waves Trading Strategies
Elliott wave analysis is useful in providing the most likely next direction, but often traders may be unsure exactly when to enter and exit based upon analysis.
If the market is predicted to move lower then obviously you would wait for prices to stop falling before buying, or for more aggressive traders they may sell short. If your wave count expects price to move upwards then obviously you would buy. Trying to trade against the main trend is extremely risky. The wave count should tell you what the main trend is.
Forex Trading - How to Create a Trading StrategyBlueMax Capital
Forex trading how to create a trading strategy. The Forex Fundamental Analysis, Technical Analysis, Risk Management, Rules Successful Forex Traders Follow and Reasons Why Forex Traders Fail.
By www.ProfitableTradingTips.com
Scalping in Day Trading
Traders who engage in rapid momentum trades are often scalping in day trading. These traders make their profit from the difference between bid and ask prices. Even in a flat market traders can profit from scalping in day trading. In order to successfully make a business out of scalping in day trading the trader needs to pay close attention to the market, always be aware of market fundamentals, and keep abreast of technical analysis. Despite the theoretical possibility of trading in an absolutely flat market the price of a stock constantly moves to some degree throughout the trading day. Thus when scalping in day trading one acts as a mini trend trader as well.
In and Out of Positions in a Hurry
There is a rhythm to scalping in day trading and it is fast. Traders seek to profit from the actions of traders to simply take the bid and ask prices of a stock. This strategy guarantees a profit if the trader acts quickly. It can result in losses if the stock price moves too quickly. As an example, Xyz Corporation has a bid price of $10.10 and ask price of $10.15. If the scalper can buy at the bid price and sell at the ask price he gains $0.05 per share, a small amount but a lot if repeated many times throughout the day. However, the market might move lower before he can complete his trade. Let’s say that the stock moves so that the bid price is now $9.90 and the ask price is $9.95. The trader who purchased for $10.10 now needs to sell at $9.95 if he wants to quickly exit his trade. The other choice is to continue the trade in hopes that the market will turn upward and not fall farther. This later course is anathema to scalping in day trading. When scalping a trader is never trying to outguess the market but simply helping to make the market and make repetitive small profits.
The Nature of Bid and Ask Prices
Bid and ask prices are available on markets across the world. By using this price system traders are able to execute trades immediately, so long as there are enough bid prices to match ask prices. The difference between bid and ask prices is called the spread. Gaining the spread on every trade is the goal when scalping in day trading. The ideal scalping trade would be instantaneous. Buy at the low price and sell at the high. Getting in and out in an instant would seem to be the ideal situation if dealing with absolutely static bid and ask prices. However, the market is never static so traders must look to market direction even when scalping in day trading. A successful scalper also engages in trend following in day trading.
Think of the Spread as a Bonus
Scalping in day trading takes advantage of market movement as well as the bid to ask spread. While trend traders use technical analysis to read market sentiment they attempt to ride out a trade to gain the maximum profit.
http://www.premiertraderuniversity.com/ptucourse -- PTU Trading Course!
What is the fundamental pattern of any market that is trending? Depends on the direction, right?
If a market is trending up, we expect to see higher highs and lows and the downswings to be relatively the same.
Flip what I just mentioned over and you have a market that is heading down.
This is certainly basic knowledge that any trader should know….and be able to profit from and I want to show you how.
http://www.netpicks.com/trading-article/trading-pullbacks-profit/
Unlock the secret to making consistent profits in trading! In here, we will learn the
most profitable chart patterns that can skyrocket your earnings. Whether you’re new or experienced, these patterns are your key to success.
Chart patterns are graphical representations of price movements in financial markets, usually depicted on a price chart. Traders and analysts use these patterns in technical
analysis to identify potential future price movements and make informed trading decisions.
Identifying profitable chart patterns is essential for successful trading. These patterns are helpful in finding entry and exit points, reflecting market psychology, aiding in risk
management, and forming the basis for trading setups and strategies.
They have historical reliability and can increase the probability of successful trades.
However, it’s important to use chart patterns in conjunction with other analyses and be
aware of the risks involved in trading.
Reversal patterns are specific formations on a price chart that indicate a potential change in
the direction of a prevailing trend. They serve as signals for traders that a trend reversal
might be occurring. These patterns suggest that the current trend, whether it’s going up or down, may be coming to an end, and a new trend in the opposite direction could be starting.
Reversal patterns are important because they help traders identify potential turning points in the market. By recognizing these patterns, traders can anticipate when a trend is losing
momentum and prepare to take advantage of the new direction that might emerge.
Reversal patterns can provide early indications that the existing trend is weakening and that it might be a good time to consider changing one’s trading strategy.
These patterns can take different forms, such as a double top/bottom, head, and shoulders.
Each pattern has its own unique characteristics, but they all share the common purpose of
suggesting a possible trend reversal. Traders analyze these patterns and use them in
conjunction with other indicators to confirm the reversal and make informed trading decisions.
It’s important to note that while reversal patterns can be reliable indicators, they are
not foolproof guarantees of a trend reversal. Traders should always consider other
factors, such as market conditions, volume, and additional technical indicators, to increase the accuracy of their analysis and avoid making hasty decisions based solely on the presence of a reversal pattern.
Continuation patterns are shapes on a chart that show a short break or rest in an ongoing
trend before it starts again. These patterns play a vital role in identifying these pauses,
allowing traders to recognize when a trend is likely to continue. They confirm the trend’s
direction and help manage trades effectively.
Continuation patterns help traders recognize periods of consolidation, indicating that market
participants are taking a break and causing the price to move within a specific range
temp
i. Forex trading session
ii. Three types of Charts
-actually, there are more like Point and figure & market profile, but we're only focusing on the candlestick for beginners.
iii. Market Trends
iv. Support & Resistance
v. Basic Pattern of Candlesticks
-Doji
-Inverted Hammer & Shooting Star
-Hammer & Hangman
-Bullish and Bearish engulfing bars
-Tweezer Tops & Tweezer Bottoms
-Morning star and Everning star
vi. Forex Glossary
-pip, base currency, bid and ask, spread
Decoding Tweezer Bottoms: A Beginner-Friendly Approach to TradingFx Lotus
Embark on your trading journey with ease! Unravel the Tweezer Bottom pattern and gain valuable insights suitable for traders at all levels. This beginner-friendly guide provides practical tips and strategies for navigating the markets effectively.
FOREX - TECHNICAL ANALYSIS: TRENDS, SUPPORT AND RESISTANCE (1.4)Trading Floor
Charts, charts, charts. When most people think about trading Forex, they think about watching price movements flash by them on the charts and making money as they jump in and out of profitable trades. This is where traders show whether or not they have what it takes to be successful in Forex market.
FREE DOWNLOAD: http://www.highvelocitymarketmaster.com/capitalgrowth/ -- Capital Growth App!
Two words in trading that give many people a shudder are “Stopped Out”. It suggests that you just took a loss on your trade and are nursing the hit to your trading account. Sidetrack: You should never be nursing the loss of money.
see more: http://www.netpicks.com/stopped-out-swing-trade/
Divergences are one of my favorite trading concepts because, when paired with other trading tools and concepts, they provide very reliable, high-quality trading signals.
Although indicators, like price action, are somewhat lagging, when it comes to divergences, this lagging feature will actually help us locate better and more dependable trade entries, as we will see below. Divergences in Trading can be used by reversal traders and trend-following traders to time their exits.
Divergences in Trading are a significant part of one of my setups, and they work well with other indications in my trading system. I don’t advise trading divergences independently, but they are good to start.
ARE YOU REALLY MAKING MONEY? FIND OUT FOR FREE: www.highvelocitymarketmaster.com/capitalgrowth
My ritual for intra-day and swing trading is pretty much the same. I scan charts, look for certain trading setups and conditions, then the appropriate action is taken.
While swing trading involves longer term charts, the plays on the smaller time frames for day trading are influenced, in part, by what is happening on the higher charts. When conditions take place on the smaller charts in line with conditions on the higher chart, good things can happen.
Read more: http://www.netpicks.com/potential-trading-setups-scan/
ARE YOU REALLY MAKING MONEY? FIND OUT FOR FREE: www.highvelocitymarketmaster.com/capitalgrowth
Over the years, much has been written in these trading articles about how simple trading can be yet, is not easy.
It's not just a play on words but hammers home that the work you do to find trades, manage risk, and other variables that make up the act of trading, is simple. Doing it consistently is another matter and that's when "not easy" comes into play.
The best way to learn is with live examples and I want to focus this article on the term "simple" by using the USDCAD Forex pair and a swing trade scenario.
Read more: http://www.netpicks.com/4-simple-trading-tools/
Mastering Multi-Touchpoint Content Strategy: Navigate Fragmented User JourneysSearch Engine Journal
Digital platforms are constantly multiplying, and with that, user engagement is becoming more intricate and fragmented.
So how do you effectively navigate distributing and tailoring your content across these various touchpoints?
Watch this webinar as we dive into the evolving landscape of content strategy tailored for today's fragmented user journeys. Understanding how to deliver your content to your users is more crucial than ever, and we’ll provide actionable tips for navigating these intricate challenges.
You’ll learn:
- How today’s users engage with content across various channels and devices.
- The latest methodologies for identifying and addressing content gaps to keep your content strategy proactive and relevant.
- What digital shelf space is and how your content strategy needs to pivot.
With Wayne Cichanski, we’ll explore innovative strategies to map out and meet the diverse needs of your audience, ensuring every piece of content resonates and connects, regardless of where or how it is consumed.
In this presentation, Danny Leibrandt explains the impact of AI on SEO and what Google has been doing about it. Learn how to take your SEO game to the next level and win over Google with his new strategy anyone can use. Get actionable steps to rank your name, your business, and your clients on Google - the right way.
Key Takeaways:
1. Real content is king
2. Find ways to show EEAT
3. Repurpose across all platforms
When most people in the industry talk about online or digital reputation management, what they're really saying is Google search and PPC. And it's usually reactive, left dealing with the aftermath of negative information published somewhere online. That's outdated. It leaves executives, organizations and other high-profile individuals at a high risk of a digital reputation attack that spans channels and tactics. But the tools needed to safeguard against an attack are more cybersecurity-oriented than most marketing and communications professionals can manage. Business leaders Leaders grasp the importance; 83% of executives place reputation in their top five areas of risk, yet only 23% are confident in their ability to address it. To succeed in 2024 and beyond, you need to turn online reputation on its axis and think like an attacker.\
Key Takeaways:
- New framework for examining and safeguarding an online reputation
- Tools and techniques to keep you a step ahead
- Practical examples that demonstrate when to act, how to act and how to recover
Videos are more engaging, more memorable, and more popular than any other type of content out there. That’s why it’s estimated that 82% of consumer traffic will come from videos by 2025.
And with videos evolving from landscape to portrait and experts promoting shorter clips, one thing remains constant – our brains LOVE videos.
So is there science behind what makes people absolutely irresistible on camera?
The answer: definitely yes.
In this jam-packed session with Stephanie Garcia, you’ll get your hands on a steal-worthy guide that uncovers the art and science to being irresistible on camera. From body language to words that convert, she’ll show you how to captivate on command so that viewers are excited and ready to take action.
Core Web Vitals SEO Workshop - improve your performance [pdf]Peter Mead
Core Web Vitals to improve your website performance for better SEO results with CWV.
CWV Topics include:
- Understanding the latest Core Web Vitals including the significance of LCP, INP and CLS + their impact on SEO
- Optimisation techniques from our experts on how to improve your CWV on platforms like WordPress and WP Engine
- The impact of user experience and SEO
Monthly Social Media News Update May 2024Andy Lambert
TL;DR. These are the three themes that stood out to us over the course of last month.
1️⃣ Social media is becoming increasingly significant for brand discovery. Marketers are now understanding the impact of social and budgets are shifting accordingly.
2️⃣ Instagram’s new algorithm and latest guidance will help us maintain organic growth. Instagram continues to evolve, but Reels remains the most crucial tool for growth.
3️⃣ Collaboration will help us unlock growth. Who we work with will define how fast we grow. Meta continues to evolve their Creator Marketplace and now TikTok are beginning to push ‘collabs’ more too.
Short video marketing has sweeped the nation and is the fastest way to build an online brand on social media in 2024. In this session you will learn:- What is short video marketing- Which platforms work best for your business- Content strategies that are on brand for your business- How to sell organically without paying for ads.
First Things First: Building and Effective Marketing Strategy
Too many companies (and marketers) jump straight into activation planning without formalizing a marketing strategy. It may seem tedious, but analyzing the mindset of your targeted audiences and identifying the messaging points most likely to resonate with them is time well spent. That process is also a great opportunity for marketers to collaborate with sales leaders and account managers on a galvanized go-to-market approach. I’ll walk you through the methods and tools we use with our clients to ensure campaign success.
Key Takeaways:
-Recognize the critical role of strategy in marketing
-Learn our approach for building an actionable, effective marketing strategy
-Receive templates and guides for developing a marketing strategy
The digital marketing industry is changing faster than ever and those who don’t adapt with the times are losing market share. Where should marketers be focusing their efforts? What strategies are the experts seeing get the best results? Get up-to-speed with the latest industry insights, trends and predictions for the future in this panel discussion with some leading digital marketing experts.
In this presentation, Danny Leibrandt explains the impact of AI on SEO and what Google has been doing about it. Learn how to take your SEO game to the next level and win over Google with his new strategy anyone can use. Get actionable steps to rank your name, your business, and your clients on Google - the right way.
Key Takeaways:
1. Real content is king
2. Find ways to show EEAT
3. Repurpose across all platforms
Mastering Local SEO for Service Businesses in the AI Era is tailored specifically for local service providers like plumbers, dentists, and others seeking to dominate their local search landscape. This session delves into leveraging AI advancements to enhance your online visibility and search rankings through the Content Factory model, designed for creating high-impact, SEO-driven content. Discover the Dollar-a-Day advertising strategy, a cost-effective approach to boost your local SEO efforts and attract more customers with minimal investment. Gain practical insights on optimizing your online presence to meet the specific needs of local service seekers, ensuring your business not only appears but stands out in local searches. This concise, action-oriented workshop is your roadmap to navigating the complexities of digital marketing in the AI age, driving more leads, conversions, and ultimately, success for your local service business.
Key Takeaways:
Embrace AI for Local SEO: Learn to harness the power of AI technologies to optimize your website and content for local search. Understand the pivotal role AI plays in analyzing search trends and consumer behavior, enabling you to tailor your SEO strategies to meet the specific demands of your target local audience. Leverage the Content Factory Model: Discover the step-by-step process of creating SEO-optimized content at scale. This approach ensures a steady stream of high-quality content that engages local customers and boosts your search rankings. Get an action guide on implementing this model, complete with templates and scheduling strategies to maintain a consistent online presence. Maximize ROI with Dollar-a-Day Advertising: Dive into the cost-effective Dollar-a-Day advertising strategy that amplifies your visibility in local searches without breaking the bank. Learn how to strategically allocate your budget across platforms to target potential local customers effectively. The session includes an action guide on setting up, monitoring, and optimizing your ad campaigns to ensure maximum impact with minimal investment.
Most small businesses struggle to see marketing results. In this session, we will eliminate any confusion about what to do next, solving your marketing problems so your business can thrive. You’ll learn how to create a foundational marketing OS (operating system) based on neuroscience and backed by real-world results. You’ll be taught how to develop deep customer connections, and how to have your CRM dynamically segment and sell at any stage in the customer’s journey. By the end of the session, you’ll remove confusion and chaos and replace it with clarity and confidence for long-term marketing success.
Key Takeaways:
• Uncover the power of a foundational marketing system that dynamically communicates with prospects and customers on autopilot.
• Harness neuroscience and Tribal Alignment to transform your communication strategies, turning potential clients into fans and those fans into loyal customers.
• Discover the art of automated segmentation, pinpointing your most lucrative customers and identifying the optimal moments for successful conversions.
• Streamline your business with a content production plan that eliminates guesswork, wasted time, and money.
Mastering Local SEO for Service Businesses in the AI Era is tailored specifically for local service providers like plumbers, dentists, and others seeking to dominate their local search landscape. This session delves into leveraging AI advancements to enhance your online visibility and search rankings through the Content Factory model, designed for creating high-impact, SEO-driven content. Discover the Dollar-a-Day advertising strategy, a cost-effective approach to boost your local SEO efforts and attract more customers with minimal investment. Gain practical insights on optimizing your online presence to meet the specific needs of local service seekers, ensuring your business not only appears but stands out in local searches. This concise, action-oriented workshop is your roadmap to navigating the complexities of digital marketing in the AI age, driving more leads, conversions, and ultimately, success for your local service business.
Key Takeaways:
Embrace AI for Local SEO: Learn to harness the power of AI technologies to optimize your website and content for local search. Understand the pivotal role AI plays in analyzing search trends and consumer behavior, enabling you to tailor your SEO strategies to meet the specific demands of your target local audience. Leverage the Content Factory Model: Discover the step-by-step process of creating SEO-optimized content at scale. This approach ensures a steady stream of high-quality content that engages local customers and boosts your search rankings. Get an action guide on implementing this model, complete with templates and scheduling strategies to maintain a consistent online presence. Maximize ROI with Dollar-a-Day Advertising: Dive into the cost-effective Dollar-a-Day advertising strategy that amplifies your visibility in local searches without breaking the bank. Learn how to strategically allocate your budget across platforms to target potential local customers effectively. The session includes an action guide on setting up, monitoring, and optimizing your ad campaigns to ensure maximum impact with minimal investment.
Everyone knows the power of stories, but when asked to come up with them, we struggle. Either we second guess ourselves as to the story's relevance, or we just come up blank and can't think of any. Unlocking Everyday Narratives: The Power of Storytelling in Marketing will teach you how to recognize stories in the moment and to recall forgotten moments that your audience needs to hear.
Key Takeaways:
Understand Why Personal Stories Connect Better
How To Remember Forgotten Stories
How To Use Customer Experiences As Stories For Your Brand
5 big bets to drive growth in 2024 without one additional marketing dollar AND how to adapt to the biggest shifting eCommerce trend- AI.
1) Romance Your Customers - Retention
2) ‘Alternative’ Lead Gen - Advocacy
3) The Beautiful Basics - Conversion Rate Optimization
4) Land that Bottom Line - Profitability
5) Roll the Dice - New Business Models
1. A General Guide to Chart Patterns.
All traders must understand that there is a high element of randomness to the markets therefore they
will experience both winning and losing trades whilst following a trading strategy. Different traders
following the same strategy will achieve different levels of performance. Past performance is not an
indicator of future results.
Remember you can lose as easily as you can gain. Your funds are at risk.
Spotting chart patterns is a popular amongst traders of all skill levels, and one of the easiest patterns to
spot is a triangle pattern. However, there is more than one kind of triangle to find, and there are a
couple of ways to trade them. Here are some of the more basic methods to both finding and trading
these patterns.
While there are a number of chart patterns of varying complexity, there are two common chart patterns
which occur regularly and provide a relatively simple method for trading. These two patterns are the
head and shoulders and the triangle.
Let’s discuss triangles first.
2. What is an ascending triangle?
The ascending triangles form when the price follows a rising trendline. However, the trend consolidates,
failing to make new highs.
Ascending triangles are considered to be continuation patterns. Therefore, a break of the resistance
prompts a rally.
The pattern is negated if the price breaks below the upward sloping trendline.
The example below of the EUR/USD (Euro/U.S. Dollar) illustrates an ascending triangle pattern on a 30-
minute chart. After a prolonged uptrend marked by an ascending trendline between A and B, the
EUR/USD temporarily consolidated, unable to form a new high or fall below the support. The pair
reverted to test resistance on three distinct occurrences between B and C, but it was incapable of
breaking it.
The ascending triangle pattern formed once a horizontal resistance and ascending support lines acted as
buffers for the price action. Finally, EUR/USD breached resistance at E, signaling a potential bullish
breakout.
How can you trade ascending triangles?
Typically, you want to buy after the pattern breaks resistance, as it did at E. It is good practice to set a
stop-loss just below the last significant low, which in this example is at D.
Look at the chart below, a continuation of the EUR/USD. Once the ascending triangle formation is
formed, we wait for a confirmation candle to signal a breakout. Since the following candle (at F)
continued to advance higher, we enter the position at 1.4160, while placing our stop-loss slightly below
the previous significant low at 1.4110 (a 50-pip difference from the buy price).
3. The EUR/USD rallies upward in line with our desired direction. The pair advances roughly 100 pips
before consolidating once more at G, providing us with a 2:1 reward-to-risk ratio.
What is a descending triangle?
Not surprisingly, the descending triangle is the opposite of the ascending triangle. It forms when the
price follows a downward trendline and then consolidates, failing to make new lows or break a
downward trendline.
Descending triangles are considered continuation patterns. Therefore, a break in the support prompts
the price to fall.
The pattern is negated if the price breaks the downward sloping trendline.
4. The example above of the NZD/USD (New Zealand Dollar/U.S. Dollar) illustrates a descending triangle
pattern on a five-minute chart. After a downtrend which followed a descending trendline between A
and B, the pair temporarily consolidated between B and C, unable to make a new low. The pair reverted
to test resistance on two distinct occurrences, but it was incapable of breaking out to the upside at D.
The pattern formed a horizontal support while descending resistance lines acted as buffers for the price
action. Finally, the NZD/USD breached the resistance at E, signaling a potential bearish breakdown.
How can we trade descending triangles?
Typically, you want to buy after the pattern breaks resistance, as it did at E. It is good practice to set a
stop-loss just below the last significant high, which in this example is at D.
Look at the chart below, which is a continuation of the NZD/USD chart above. Once the descending
triangle formation is completed, we wait for a candle to breakout from the pattern, as it did at E. We sell
short NZD/USD at 0.6375, while placing our stop-loss slightly above the previous significant high at
0.6405 (a 30-pip difference from the sell price). NZD/USD tumbles in our desired direction.
The pair descends roughly 90 pips before consolidating once more at F, providing a 3:1 reward-to-risk
ratio. Considering this is a five-minute chart, the profits and risks are generally smaller than if the
pattern appeared on a larger timeframe.
What is a symmetrical triangle?
The pattern is identified by two discrete trendlines. The first trendline connects a series of lower peaks,
while the second trendline connects a series of higher troughs.
5. Symmetrical triangles generally form during consolidation and the volatility tends to decline as the
pattern progresses.
Symmetrical triangles tend to be neutral and can signal either a bullish or a bearish situation. Therefore,
a breakout from the pattern in either direction signals a new trend.
The example above of the NZD/USD illustrates a symmetrical triangle formation on a 15-minute chart.
After a rapid uptrend, the pair consolidated between A and B, unable to find a distinct trend. During the
consolidating state, the pair continued to form a series of lower peaks and higher troughs. Volatility
dropped off considerably, if compared to the beginning of the formation. Ultimately, the pattern ended
when both of the trendlines came together at C.
How can we trade symmetrical triangles?
Since bias upon the conclusion of the pattern pointed higher, we look for an opportunity to buy the pair.
Given the candle following the conclusion of the trend rallied at D, we bought NZD/USD at 0.6240. We
place our stop-loss slightly below the most recent significant low at 0.6215 (a 25-pip difference from the
buy price). The pair continued to consolidate prior to rallying approximately 80 pips at E. Considering
this is a 15-minute chart, the profits and risks are generally smaller than if the pattern appeared on a
larger timeframe.
6. Let’s move onto The Head & Shoulders Pattern (and of course its inverse)
This is not only my favorite reversal pattern, but it is also my
favorite pattern, period. That includes its inverse, which has similar
mannerisms.
For those who have followed me for a while now, you may recall
that my favorite pattern to trade used to be the wedge. However,
the last year of trading has produced a new winner in my book.
The head and shoulders is the least common of the three
formations we will discuss today. While there may be similar price
structures that occur more frequently, a valid and therefore
tradable head and shoulders reversal doesn’t come around very
often.
The head and shoulders chart pattern is a highly reliable reversal configuration which provides trading
signals that are often used by foreign exchange traders. The head and shoulders pattern features three
price spikes: one head exceeds past the two shoulders which have approximately the same height, and
the two lows are connected by a "neckline". Transaction volumes are generally very high on the first
shoulder, then they gradually decrease during the formation of the head and the second shoulder. The
low volumes of the right shoulder indicate a probable reversal of prices. The higher the head is, the
more reliable the pattern will be. The probability of a reversal will be greater when the currency price
crosses the neckline support level.
This chart pattern also exists in a downtrend (an inverted head and shoulders), but it is considered more
reliable in an uptrend.
7. Why Should You Trade It?
Put simply, it works. But more than that, it can be quite easy to spot and extremely profitable when you
know what to look for and how to trade it.
The pattern can offer a precise entry given the fact that the neckline is generally based on several highs
or lows. This fact alone takes a lot of the guesswork out of determining when the pattern has confirmed.
Another huge benefit, like the other two technical formations below, is that we have a measured
objective from which to identify a possible target.
What Do You Need to Know?
This is something that you may not know. In order to be considered valid, the two shoulders of the
pattern must overlap at some point.
Situations where the shoulders don’t overlap are most common when the pattern unfolds at a steep
angle. While a break of the trend line (if one exists) may trigger a change in trend, it does not fit the
criteria to be called, or traded as, a head and shoulders pattern.
8. Notice how no part of the first shoulder in the illustration above overlaps the second shoulder. This
disqualifies the price structure from being traded as a head and shoulders pattern.
Another common mistake among Forex traders is to use a measured objective as a “one-stop shop.” In
other words, they simply measure out the distance in pips and then set a pending order to book profits
at that level.
While that may occasionally work out in your favor, a much better approach is to determine whether or
not that objective lines up with a pre-existing key level. If it does, perfect, however a more common
scenario is one where the market will come in contact with a key level prior to reaching the objective.
If this is the case, you’re far better off taking profit at the key level rather than hoping for an extended
move to the objective. Remember that technical analysis is not a perfect science and there are no
9. guarantees, so there’s no sense to risk losing an unrealized gain of 500 pips in order to make an extra 50
pips in profit.
Last but not least, the head and shoulders is best traded on the 4-hour chart or higher. However, I have
found that the best price structures tend to form on the daily time frame. A formation on the 1-hour
chart or lower should always be ignored, regardless of how well-defined the structure may be.
Let me explain while referring to chart above:
• Sellers come in at the highs (left shoulder) and what happens is that the downside is probed
(which results in a beginning neckline).
• What happens next is that buyers soon return to the market and push prices to new highs (the
head).
• However, the new high (head) is not sustained as price falls back down due to sellers pushing
price down to create a continuing neckline.
• Buyers enter again pushing the price up to a high, but this high does not exceed the previous
high (the head). This high is the right shoulder.
• Sellers get in and push the price down and this time the neckline is intersected
• Buyers may get in here and push price up to test the neckline that was intersected which would
now act as a resistance.
• Sellers get in push the price down.
10. There are two options on how you can trade the head and shoulder pattern:
Option 1
Wait for a candlestick to break to break the neckline to the downside.
Then place a sell stop order just a few pips (3-5 pips
at least) under the low of the candlestick.
Place you stop loss 3-5 pips above the high of the
right shoulder.
Option 2
Once price breaks the neckline, just wait for price to
rally back up to touch the neckline which it
intersected. This intersected neckline would now act
as a resistance line.
Once it touches the neckline, place a sell stop order
3-5 pips under the low of the candlestick that
touches the neckline.
Place you stop loss anywhere from 10-50 pips (depending on which timeframe you are trading in) just
above where your sell stop order is placed.
Try to use reversal candlestick patterns as your short entry confirmation on this option 2 entry style.
Many chart patterns
There are literally hundreds of different chart patterns available to traders. With so many patterns to
choose from, it’s little wonder why so many traders become confused as to which chart patterns are
best to trade.
Among the hundreds of patterns available, there are a few that you need to know in order to increase
your odds of success as a trader. We have discussed these above, but you should be aware of all the
patterns.
The 3 Main Groups of Chart Patterns
Reversal Chart Patterns
Reversal patterns are those chart formations that signal that the ongoing trend is about to change
course. If a reversal chart pattern forms during an uptrend, it hints that the trend will reverse and that
the price will head down soon.
11. Conversely, if a reversal chart pattern is seen during a downtrend, it suggests that the price will move up
later on.
These include:
• Double Top
• Double Bottom
• Head and Shoulders
• Inverse Head and Shoulders
• Rising Wedge
• Falling Wedge
Continuation Chart Patterns
Continuation chart patterns are those chart formations that signal that the ongoing trend will
resume.
Usually, these are also known as consolidation patterns because they show how buyers or sellers
take a quick break before moving further in the same direction as the prior trend.
We’ve covered several continuation chart patterns, namely the wedges, rectangles, and pennants.
Note that wedges can be considered either reversal or continuation patterns depending on the
trend on which they form.
12. Bilateral Chart Patterns
Bilateral chart patterns are a bit trickier because these signal that the price can move either way.
This is where triangle formations fall in. Remember when we discussed that the price could break
either to the topside or downside with triangles?
To play these chart patterns, you should consider both scenarios (upside or downside breakout) and
place one order on top of the formation and another at the bottom of the formation.
If one order gets triggered, you can cancel the other one. Either way, you’d be part of the action.
Double the possibilities, double the fun!
The only problem is that you could catch a false break if you set your entry orders too close to the
top or bottom of the formation.
13. Entry Exit & Target Levels
When a breakout eventually occurs, it is likely to provoke a price move equal to the size of the
pattern. Therefore, you should carefully identify a potential breakout in the upper and the lower
level of the symmetrical triangle in order to take the right position in the market. The sketch below
illustrates the symmetrical triangle formation and possible breakout scenarios:
As you see from the example above, the potential target is based on the size of the formation. With
this type of measured move analysis, you will know what to expect from the breakout, whether it
breaks upwards, or downwards.
When calculating the second target, you would analyze the price leg immediately following the
pennant. You could set the target to 1:1 of the previous leg or .618 of that leg. When the trend
seems strong and has a steep slope a 1:1 measured move would be an appropriate second target,
and in all other cases the .618 of the leg could be used.
14. PLEASE BE AWARE, THESE ABOVE INFORMATION IS A GUIDE AND GENERAL KNOWLEDGE AND NOT
TRADING ADVICE. YOU NEED TO CONDUCT GREATER RESEARCH AND PRACTICE. REMEMBER YOU
CAN LOSE AS MUCH AS YOU CAN PROFIT. ALWAYS USE GOOD MONEY MANAGEMENT AND RISK
15. MANAGEMENT ANALYSIS. IF YOU ARE NOT SURE, SIT ON THE SIDELINES AND SEEK PROFESSIONAL
HELP AND PRACTICE WITH A DEMO ACCOUNT.
ALL TRADERS MUST UNDERSTAND THAT THERE IS A HIGH ELEMENT OF RANDOMNESS TO THE
MARKETS THEREFORE THEY WILL EXPERIENCE BOTH WINNING AND LOSING TRADES WHILST
FOLLOWING A TRADING STRATEGY. DIFFERENT TRADERS FOLLOWING THE SAME STRATEGY WILL
ACHIEVE DIFFERENT LEVELS OF PERFORMANCE. PAST PERFORMANCE IS NOT AN INDICATOR OF
FUTURE RESULTS.