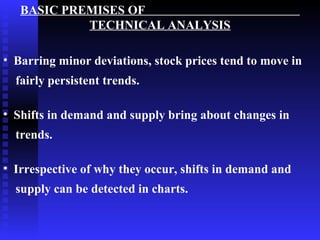
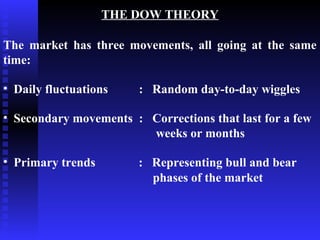
Downloaded 135 times

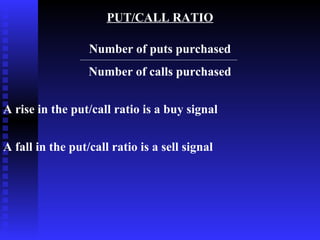
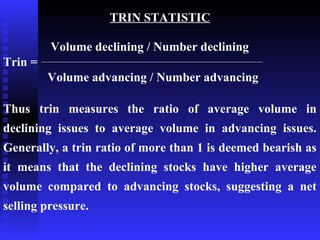
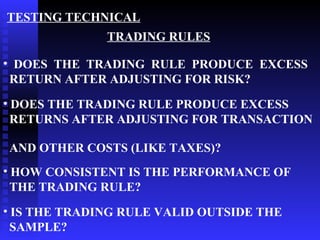
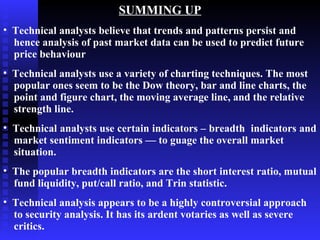

This document discusses technical analysis, which uses patterns in stock prices and volumes to predict future market movements. It outlines various charting techniques used in technical analysis like bar charts, moving averages, and point and figure charts. It also describes technical indicators that analyze market breadth and sentiment, such as the advance-decline line, short interest ratio, and put/call ratio. Technical analysis aims to identify trends but its effectiveness is controversial.


