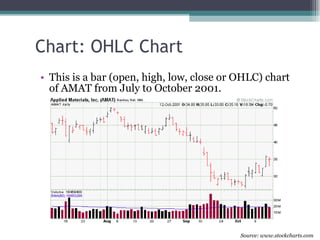
This document provides an overview of technical analysis and the tools used for short-term forecasting of stock prices and trends. It discusses chart patterns like head and shoulders and double tops/bottoms that indicate reversals, as well as trend lines, triangles, and indicators like MACD that can provide buy and sell signals. Examples are given of each tool using charts of actual stock data to illustrate technical analysis in action.