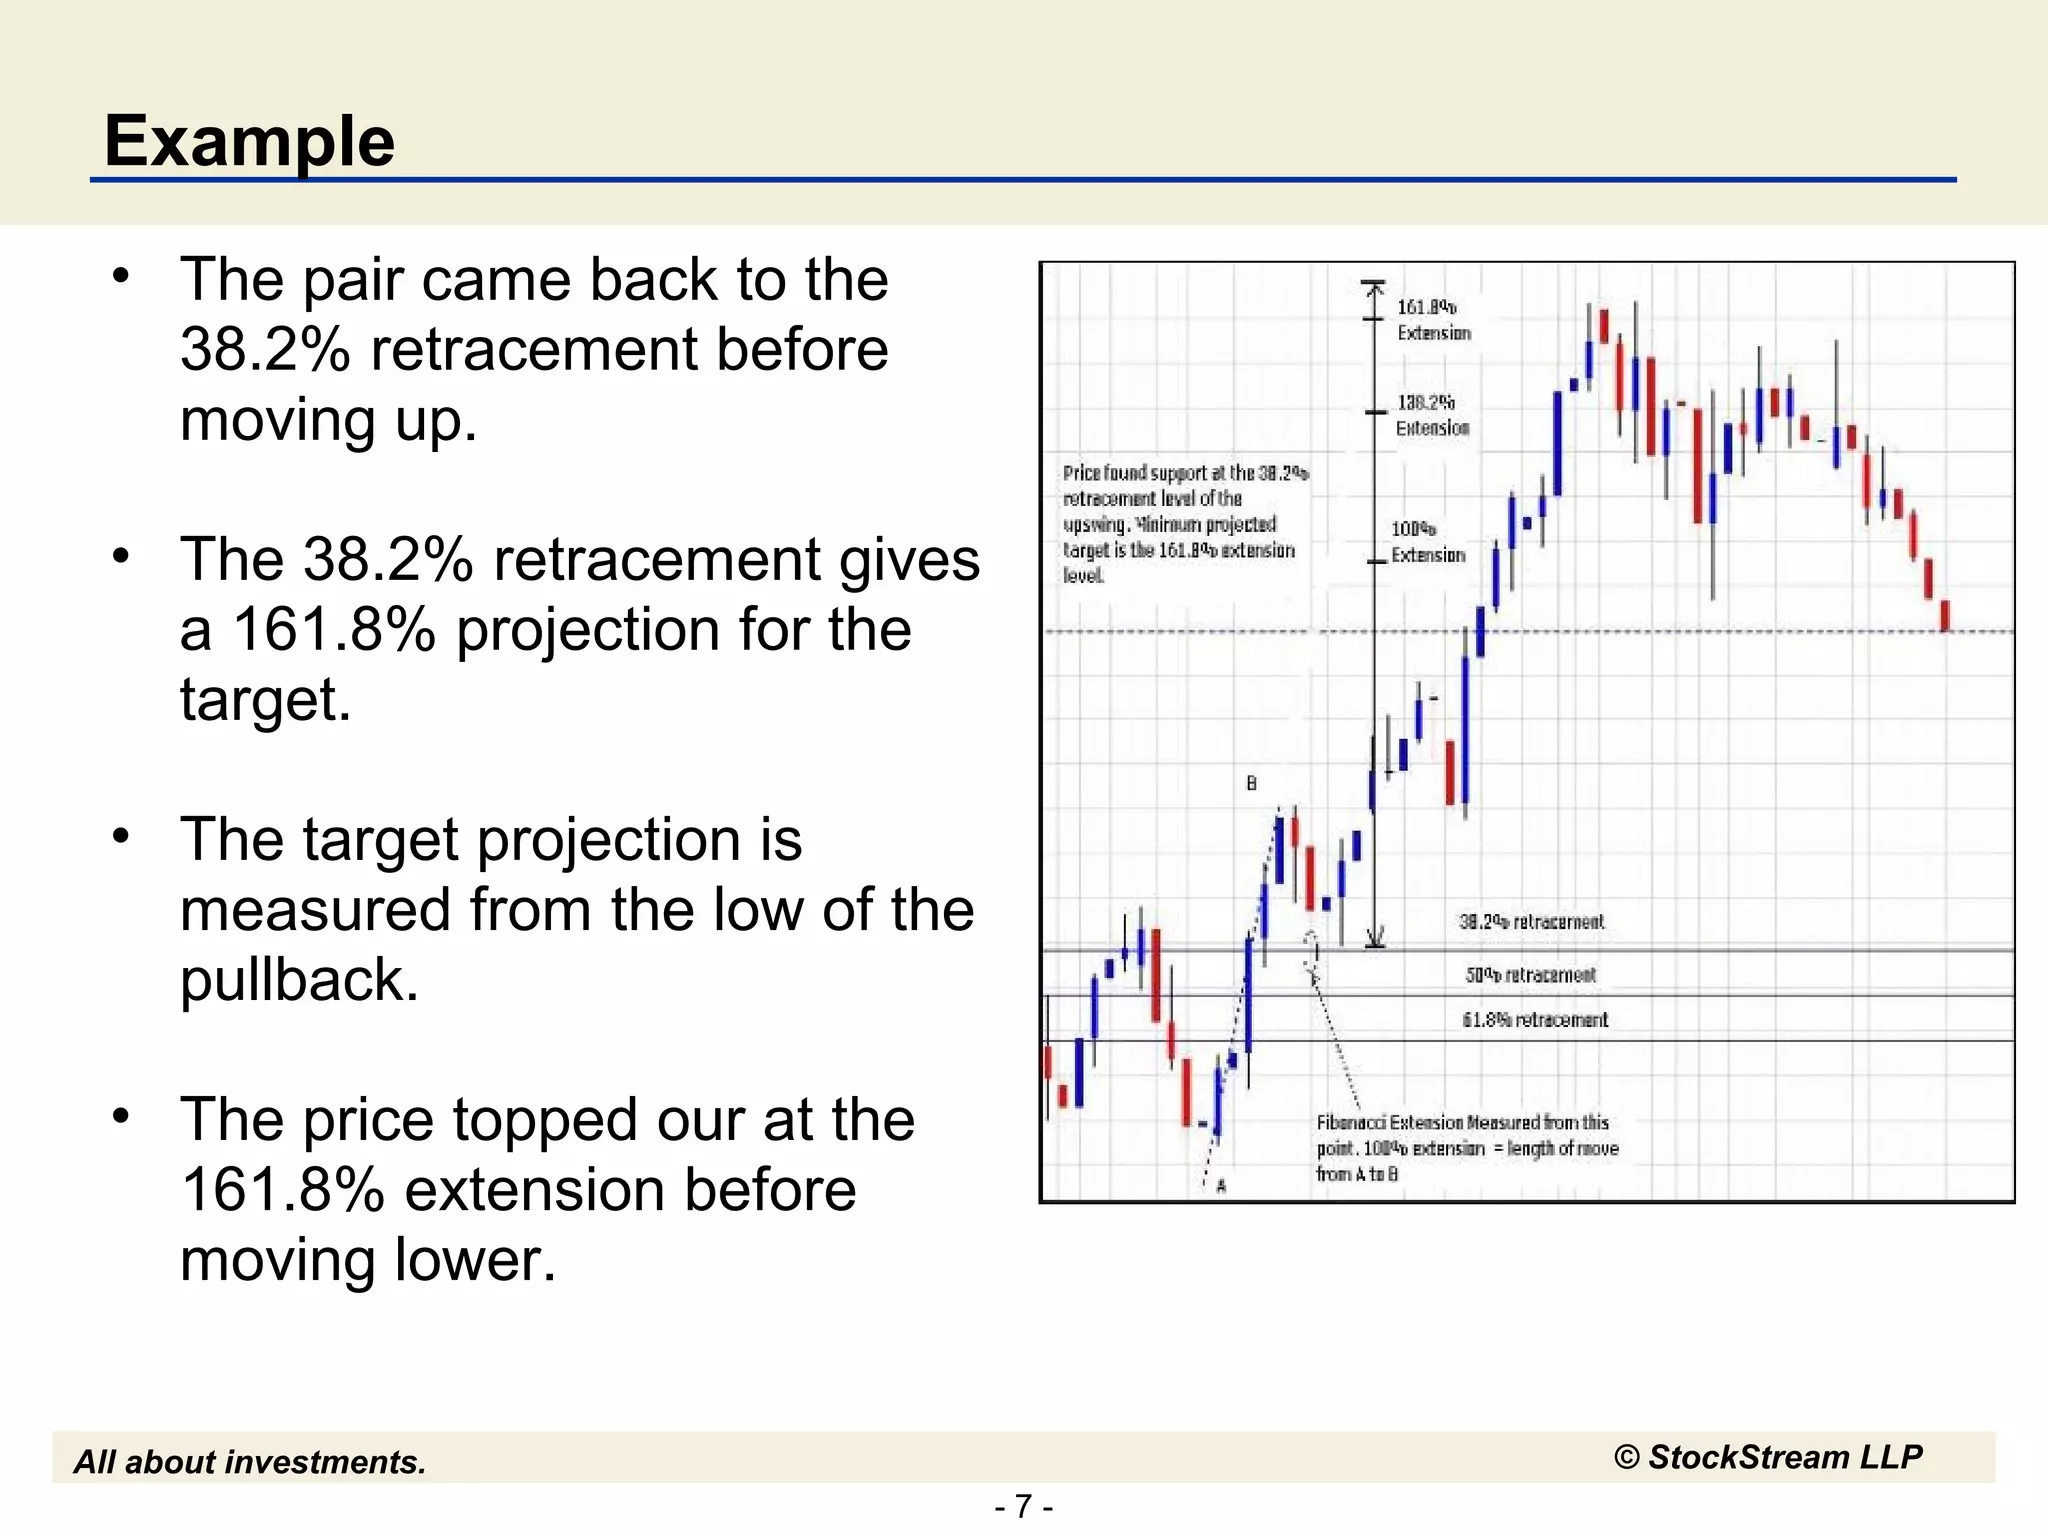
Investment InsightsInvestment Insights
Fibonacci Analysis
StockStream LLP
All about investments. © StockStream LLP
Disclaimer
• Trading carries significant risk of losses and may not be suitable for all
investors. Traders should assess these risks either themselves or in
consultation with a financial advisor before investing.
• There is no guarantee that the trading techniques, methods and other
information in this presentation will result in profits. The content in this
presentation in only intended for educational and informational
purposes and not intended as trading recommendation.
• The content of this presentation is subject to change without notice.
• Stockstream Financial Advisory Services LLP or mystockstream.com
will not take any liability or accountability of losses arising from the use
of information in this presentation in any manner.
- 3 -
All about investments. © StockStream LLP
StockStream Education Model
- 4 -
All about investments. © StockStream LLP
Introduction
• Fibonacci analysis is a very powerful technical analysis tool. It can be
used independently or in combination with other technical indicators.
• Fibonacci Series consists of the following numbers: 1,1,2,3,5,8,13,21,
…
• Fibonacci numbers exhibit important relations with each other
o Dividing one number by the next = 0.618
o Dividing a number by the previous = 1.618
o Square root of 0.618 = 0.786
o Square root of 1.618 = 1.27
o Dividing a number by second number after it = 0.382
• The important Fibonacci levels are: 0.382, 0.5, 0.618, 0.786, 1.27,
1.618, 2.618
• These ratios provide important support and resistance level
- 5 -
All about investments. © StockStream LLP
Fibonacci Retracements
• Markets retracements in uptrends or downtrends generally find
support or resistance at Fibonacci levels.
• Levels to watch are 38.2%, 50%, 61.8% and 78.6%
retracements of the move.
• A move above the 78.6% retracement indicates trend reversal.
• Trading Strategy
o Use candlestick reversal patterns to initiate buy or sell at
Fibonacci Levels.
o Place stops according to the guidelines of the pattern
o Use the following as guides for targets
 A 38.2% retracement gives a 1.618% projection
 A 61.8% retracement goes to a 1.382% projection, etc
- 6 -
All about investments. © StockStream LLP
Fibonacci Extensions
• Fibonacci Extensions provide price targets in an uptrend or
downtrend after a reversal at a swing high and test of a
Fibonacci retracement level.
• The Fibonacci extension levels are obtained by adding the
length of the move in the direction of the move (100% level).
• The standard Fibonacci extension levels are 138.2%, 150%,
161.8%, 231.8%, 261.8%, 361.8% and 423.6%.
- 7 -
All about investments. © StockStream LLP
Example
• The pair came back to the
38.2% retracement before
moving up.
• The 38.2% retracement gives
a 161.8% projection for the
target.
• The target projection is
measured from the low of the
pullback.
• The price topped our at the
161.8% extension before
moving lower.
- 8 -
All about investments. © StockStream LLP
Questions
• Visit and register at mystockstream.com
• Follow and interact with StockStream Experts for answers
• StockStream Education
• StockStream Forex
• StockStream Commodity
• StockStream India

Fibonacci analysis

  • 1.
  • 2.
    All about investments.© StockStream LLP Disclaimer • Trading carries significant risk of losses and may not be suitable for all investors. Traders should assess these risks either themselves or in consultation with a financial advisor before investing. • There is no guarantee that the trading techniques, methods and other information in this presentation will result in profits. The content in this presentation in only intended for educational and informational purposes and not intended as trading recommendation. • The content of this presentation is subject to change without notice. • Stockstream Financial Advisory Services LLP or mystockstream.com will not take any liability or accountability of losses arising from the use of information in this presentation in any manner.
  • 3.
    - 3 - Allabout investments. © StockStream LLP StockStream Education Model
  • 4.
    - 4 - Allabout investments. © StockStream LLP Introduction • Fibonacci analysis is a very powerful technical analysis tool. It can be used independently or in combination with other technical indicators. • Fibonacci Series consists of the following numbers: 1,1,2,3,5,8,13,21, … • Fibonacci numbers exhibit important relations with each other o Dividing one number by the next = 0.618 o Dividing a number by the previous = 1.618 o Square root of 0.618 = 0.786 o Square root of 1.618 = 1.27 o Dividing a number by second number after it = 0.382 • The important Fibonacci levels are: 0.382, 0.5, 0.618, 0.786, 1.27, 1.618, 2.618 • These ratios provide important support and resistance level
  • 5.
    - 5 - Allabout investments. © StockStream LLP Fibonacci Retracements • Markets retracements in uptrends or downtrends generally find support or resistance at Fibonacci levels. • Levels to watch are 38.2%, 50%, 61.8% and 78.6% retracements of the move. • A move above the 78.6% retracement indicates trend reversal. • Trading Strategy o Use candlestick reversal patterns to initiate buy or sell at Fibonacci Levels. o Place stops according to the guidelines of the pattern o Use the following as guides for targets  A 38.2% retracement gives a 1.618% projection  A 61.8% retracement goes to a 1.382% projection, etc
  • 6.
    - 6 - Allabout investments. © StockStream LLP Fibonacci Extensions • Fibonacci Extensions provide price targets in an uptrend or downtrend after a reversal at a swing high and test of a Fibonacci retracement level. • The Fibonacci extension levels are obtained by adding the length of the move in the direction of the move (100% level). • The standard Fibonacci extension levels are 138.2%, 150%, 161.8%, 231.8%, 261.8%, 361.8% and 423.6%.
  • 7.
    - 7 - Allabout investments. © StockStream LLP Example • The pair came back to the 38.2% retracement before moving up. • The 38.2% retracement gives a 161.8% projection for the target. • The target projection is measured from the low of the pullback. • The price topped our at the 161.8% extension before moving lower.
  • 8.
    - 8 - Allabout investments. © StockStream LLP Questions • Visit and register at mystockstream.com • Follow and interact with StockStream Experts for answers • StockStream Education • StockStream Forex • StockStream Commodity • StockStream India