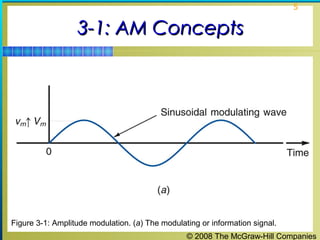
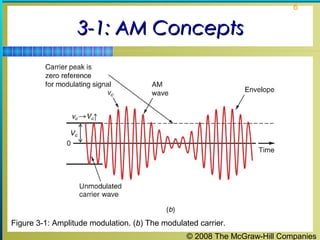
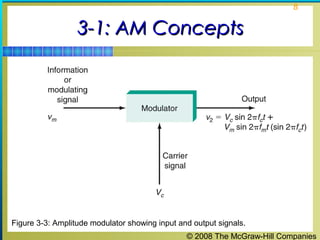
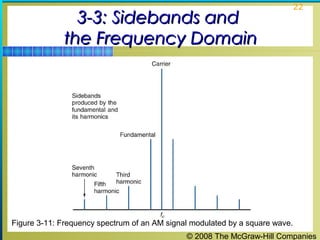
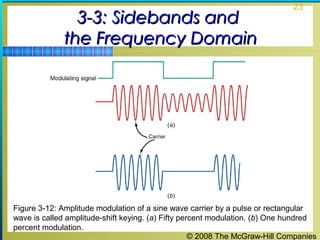
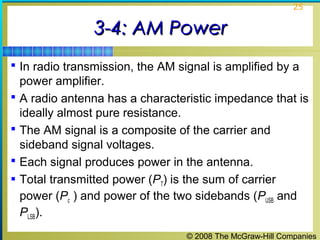
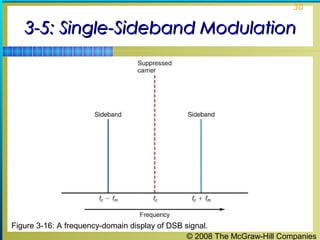
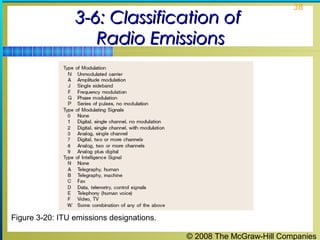
1
Principles of ElectronicPrinciples of Electronic
Communication SystemsCommunication Systems
Third Edition
Louis E. Frenzel, Jr.
© 2008 The McGraw-Hill Companies
2
Chapter 3Chapter 3
Amplitude Modulation Fundamentals
© 2008 The McGraw-Hill Companies
3
Topics Covered in Chapter 3Topics Covered in Chapter 3
 3-1: AM Concepts
 3-2: Modulation Index and Percentage of Modulation
 3-3: Sidebands and the Frequency Domain
 3-4: AM Power
 3-5: Single-Sideband Modulation
 3-6: Classification of Radio Emissions
© 2008 The McGraw-Hill Companies
4
3-1: AM Concepts3-1: AM Concepts
 In the modulation process, the voice, video, or digital
signal modifies another signal called the carrier.
 In amplitude modulation (AM) the information signal
varies the amplitude of the carrier sine wave.
 The instantaneous value of the carrier amplitude
changes in accordance with the amplitude and
frequency variations of the modulating signal.
 An imaginary line called the envelope connects the
positive and negative peaks of the carrier waveform.
© 2008 The McGraw-Hill Companies
5
3-1: AM Concepts3-1: AM Concepts
Figure 3-1: Amplitude modulation. (a) The modulating or information signal.
© 2008 The McGraw-Hill Companies
6
3-1: AM Concepts3-1: AM Concepts
Figure 3-1: Amplitude modulation. (b) The modulated carrier.
© 2008 The McGraw-Hill Companies
7
3-1: AM Concepts3-1: AM Concepts
 In AM, it is particularly important that the peak value of
the modulating signal be less than the peak value of
the carrier.
Vm < Vc
 Distortion occurs when the amplitude of the
modulating signal is greater than the amplitude of the
carrier.
 A modulator is a circuit used to produce AM.
Amplitude modulators compute the product of the
carrier and modulating signals.
© 2008 The McGraw-Hill Companies
8
3-1: AM Concepts3-1: AM Concepts
Figure 3-3: Amplitude modulator showing input and output signals.
© 2008 The McGraw-Hill Companies
9
3-2: Modulation Index and3-2: Modulation Index and
Percentage of ModulationPercentage of Modulation
 The modulation index (m) is a value that describes
the relationship between the amplitude of the
modulating signal and the amplitude of the carrier
signal.
m = Vm / Vc
 This index is also known as the modulating factor or
coefficient, or the degree of modulation.
 Multiplying the modulation index by 100 gives the
percentage of modulation.
© 2008 The McGraw-Hill Companies
10
3-2: Modulation Index and3-2: Modulation Index and
Percentage of ModulationPercentage of Modulation
Overmodulation and Distortion
 The modulation index should be a number between 0
and 1.
 If the amplitude of the modulating voltage is higher than
the carrier voltage, m will be greater than 1, causing
distortion.
 If the distortion is great enough, the intelligence signal
becomes unintelligible.
© 2008 The McGraw-Hill Companies
11
3-2: Modulation Index and3-2: Modulation Index and
Percentage of ModulationPercentage of Modulation
Overmodulation and Distortion
 Distortion of voice transmissions produces garbled,
harsh, or unnatural sounds in the speaker.
 Distortion of video signals produces a scrambled and
inaccurate picture on a TV screen.
© 2008 The McGraw-Hill Companies
12
3-2: Modulation Index and3-2: Modulation Index and
Percentage of ModulationPercentage of Modulation
Figure 3-4: Distortion of the envelope caused by overmodulation where the modulating
signal amplitude Vm is greater than the carrier signal Vc.
© 2008 The McGraw-Hill Companies
13
3-2: Modulation Index and3-2: Modulation Index and
Percentage of ModulationPercentage of Modulation
Percentage of Modulation
 The modulation index is commonly computed from
measurements taken on the composite modulated
waveform.
 Using oscilloscope voltage values:
Vm =
Vmax − Vmin
2
 The amount, or depth, of AM is then expressed as the
percentage of modulation (100 × m) rather than as a
fraction.
© 2008 The McGraw-Hill Companies
14
3-2: Modulation Index and3-2: Modulation Index and
Percentage of ModulationPercentage of Modulation
Figure 3-5: AM wave showing peaks (Vmax) and troughs (Vmin).
© 2008 The McGraw-Hill Companies
15
3-3: Sidebands and3-3: Sidebands and
the Frequency Domainthe Frequency Domain
 Side frequencies, or sidebands are generated as
part of the modulation process and occur in the
frequency spectrum directly above and below the
carrier frequency.
© 2008 The McGraw-Hill Companies
16
3-3: Sidebands and3-3: Sidebands and
the Frequency Domainthe Frequency Domain
Sideband Calculations
 Single-frequency sine-wave modulation generates
two sidebands.
 Complex wave (e.g. voice or video) modulation
generates a range of sidebands.
 The upper sideband (fUSB) and the lower sideband (fLSB)
are calculated:
fUSB = fc + fm and fLSB = fc − fm
© 2008 The McGraw-Hill Companies
17
3-3: Sidebands and3-3: Sidebands and
the Frequency Domainthe Frequency Domain
Figure 3-6: The AM wave is the
algebraic sum of the carrier and
upper and lower sideband sine
waves. (a) Intelligence or
modulating signal. (b) Lower
sideband. (c ) Carrier. (d ) Upper
sideband. (e ) Composite AM wave.
© 2008 The McGraw-Hill Companies
18
3-3: Sidebands and3-3: Sidebands and
the Frequency Domainthe Frequency Domain
Frequency-Domain Representation of AM
 Observing an AM signal on an oscilloscope, you see
only amplitude variations of the carrier with respect to
time.
 A plot of signal amplitude versus frequency is referred
to as frequency-domain display.
 A spectrum analyzer is used to display the frequency
domain as a signal.
 Bandwidth is the difference between the upper and
lower sideband frequencies.
BW = fUSB−fLSB
© 2008 The McGraw-Hill Companies
19
3-3: Sidebands and3-3: Sidebands and
the Frequency Domainthe Frequency Domain
Figure 3-8: The relationship between the time and frequency domains.
© 2008 The McGraw-Hill Companies
20
3-3: Sidebands and3-3: Sidebands and
the Frequency Domainthe Frequency Domain
Frequency-Domain Representation of AM
 Example:
A standard AM broadcast station is allowed to transmit
modulating frequencies up to 5 kHz. If the AM station is
transmitting on a frequency of 980 kHz, what are
sideband frequencies and total bandwidth?
fUSB = 980 + 5 = 985 kHz
fLSB = 980 – 5 = 975 kHz
BW = fUSB – fLSB = 985 – 975 = 10 kHz
BW = 2 (5 kHz) = 10 kHz
© 2008 The McGraw-Hill Companies
21
3-3: Sidebands and3-3: Sidebands and
the Frequency Domainthe Frequency Domain
Pulse Modulation
 When complex signals such as pulses or rectangular
waves modulate a carrier, a broad spectrum of
sidebands is produced.
 A modulating square wave will produce sidebands
based on the fundamental sine wave as well as the
third, fifth, seventh, etc. harmonics.
 Amplitude modulation by square waves or rectangular
pulses is referred to as amplitude shift keying (ASK).
 ASK is used in some types of data communications.
© 2008 The McGraw-Hill Companies
22
3-3: Sidebands and3-3: Sidebands and
the Frequency Domainthe Frequency Domain
Figure 3-11: Frequency spectrum of an AM signal modulated by a square wave.
© 2008 The McGraw-Hill Companies
23
3-3: Sidebands and3-3: Sidebands and
the Frequency Domainthe Frequency Domain
Figure 3-12: Amplitude modulation of a sine wave carrier by a pulse or rectangular
wave is called amplitude-shift keying. (a) Fifty percent modulation. (b) One hundred
percent modulation.
© 2008 The McGraw-Hill Companies
24
3-3: Sidebands and3-3: Sidebands and
the Frequency Domainthe Frequency Domain
Pulse Modulation
 Continuous-wave (CW) transmission can be achieved
by turning the carrier off and on, as in Morse code
transmission.
 Continuous wave (CW) transmission is sometimes
referred to as On-Off keying (OOK).
 Splatter is a term used to describe harmonic sideband
interference.
© 2008 The McGraw-Hill Companies
25
3-4: AM Power3-4: AM Power
 In radio transmission, the AM signal is amplified by a
power amplifier.
 A radio antenna has a characteristic impedance that is
ideally almost pure resistance.
 The AM signal is a composite of the carrier and
sideband signal voltages.
 Each signal produces power in the antenna.
 Total transmitted power (PT) is the sum of carrier
power (Pc ) and power of the two sidebands (PUSB and
PLSB).
© 2008 The McGraw-Hill Companies
26
3-4: AM Power3-4: AM Power
 When the percentage of modulation is less than the
optimum 100, there is much less power in the
sidebands.
 Output power can be calculated by using the formula
PT = (IT)2
R
where IT is measured RF current and R is antenna
impedance
© 2008 The McGraw-Hill Companies
27
3-4: AM Power3-4: AM Power
 The greater the percentage of modulation, the higher
the sideband power and the higher the total power
transmitted.
 Power in each sideband is calculated
PSB = PLSB = PUSB = Pcm2
/ 4
 Maximum power appears in the sidebands when the
carrier is 100 percent modulated.
© 2008 The McGraw-Hill Companies
28
3-5: Single-Sideband Modulation3-5: Single-Sideband Modulation
 In amplitude modulation, two-thirds of the transmitted
power is in the carrier, which conveys no information.
 Signal information is contained within the sidebands.
 Single-sideband (SSB) is a form of AM where the
carrier is suppressed and one sideband is eliminated.
© 2008 The McGraw-Hill Companies
29
3-5: Single-Sideband Modulation3-5: Single-Sideband Modulation
DSB Signals
 The first step in generating an SSB signal is to suppress
the carrier, leaving the upper and lower sidebands.
 This type of signal is called a double-sideband
suppressed carrier (DSSC) signal. No power is wasted
on the carrier.
 A balanced modulator is a circuit used to produce the
sum and difference frequencies of a DSSC signal but to
cancel or balance out the carrier.
 DSB is not widely used because the signal is difficult to
demodulate (recover) at the receiver.
© 2008 The McGraw-Hill Companies
30
3-5: Single-Sideband Modulation3-5: Single-Sideband Modulation
Figure 3-16: A frequency-domain display of DSB signal.
© 2008 The McGraw-Hill Companies
31
3-5: Single-Sideband Modulation3-5: Single-Sideband Modulation
SSB Signals
 One sideband is all that is necessary to convey
information in a signal.
 A single-sideband suppressed carrier (SSSC) signal
is generated by suppressing the carrier and one
sideband.
© 2008 The McGraw-Hill Companies
32
3-5: Single-Sideband Modulation3-5: Single-Sideband Modulation
SSB Signals
 SSB signals offer four major benefits:
1. Spectrum space is conserved and allows more
signals to be transmitted in the same frequency
range.
2. All power is channeled into a single sideband. This
produces a stronger signal that will carry farther
and will be more reliably received at greater
distances.
3. Occupied bandwidth space is narrower and noise in
the signal is reduced.
4. There is less selective fading over long distances.
© 2008 The McGraw-Hill Companies
33
3-5: Single-Sideband Modulation3-5: Single-Sideband Modulation
Disadvantages of DSB and SSB
 Single and double-sideband are not widely used
because the signals are difficult to recover (i.e.
demodulate) at the receiver.
 A low power, pilot carrier is sometimes transmitted
along with sidebands in order to more easily recover the
signal at the receiver.
© 2008 The McGraw-Hill Companies
34
3-5: Single-Sideband Modulation3-5: Single-Sideband Modulation
Signal Power Considerations
 In SSB, the transmitter output is expressed in terms of
peak envelope power (PEP), the maximum power
produced on voice amplitude peaks.
Applications of DSB and SSB
 A vestigial sideband signal (VSB) is produced by
partially suppressing the lower sideband. This kind of
signal is used in TV transmission.
© 2008 The McGraw-Hill Companies
35
3-6: Classification of3-6: Classification of
Radio EmissionsRadio Emissions
 A code is used to designate the types of signals that
can be transmitted by radio and wire.
 The code is made up of a capital letter and a number.
 Lowercase subscript letters are used for more specific
definition.
 Examples of codes:
 DSB two sidebands, full carrier = A3
 DSB two sidebands, suppressed carrier = A3b
 OOK and ASK = A1
© 2008 The McGraw-Hill Companies
36
3-6: Classification of3-6: Classification of
Radio EmissionsRadio Emissions
 The International Telecommunications Union (ITU),
a standards organization, uses a code to describe
signals.
 Examples are:
 A3F amplitude-modulated analog TV
 J3E SSB voice
 F2D FSK data
 G7E phase-modulated voice, multiple signals
© 2008 The McGraw-Hill Companies
37
3-6: Classification of3-6: Classification of
Radio EmissionsRadio Emissions
Figure 3-19: Radio emission code designations.
© 2008 The McGraw-Hill Companies
38
3-6: Classification of3-6: Classification of
Radio EmissionsRadio Emissions
Figure 3-20: ITU emissions designations.

Chapter03

  • 1.
    1 Principles of ElectronicPrinciplesof Electronic Communication SystemsCommunication Systems Third Edition Louis E. Frenzel, Jr. © 2008 The McGraw-Hill Companies
  • 2.
    2 Chapter 3Chapter 3 AmplitudeModulation Fundamentals
  • 3.
    © 2008 TheMcGraw-Hill Companies 3 Topics Covered in Chapter 3Topics Covered in Chapter 3  3-1: AM Concepts  3-2: Modulation Index and Percentage of Modulation  3-3: Sidebands and the Frequency Domain  3-4: AM Power  3-5: Single-Sideband Modulation  3-6: Classification of Radio Emissions
  • 4.
    © 2008 TheMcGraw-Hill Companies 4 3-1: AM Concepts3-1: AM Concepts  In the modulation process, the voice, video, or digital signal modifies another signal called the carrier.  In amplitude modulation (AM) the information signal varies the amplitude of the carrier sine wave.  The instantaneous value of the carrier amplitude changes in accordance with the amplitude and frequency variations of the modulating signal.  An imaginary line called the envelope connects the positive and negative peaks of the carrier waveform.
  • 5.
    © 2008 TheMcGraw-Hill Companies 5 3-1: AM Concepts3-1: AM Concepts Figure 3-1: Amplitude modulation. (a) The modulating or information signal.
  • 6.
    © 2008 TheMcGraw-Hill Companies 6 3-1: AM Concepts3-1: AM Concepts Figure 3-1: Amplitude modulation. (b) The modulated carrier.
  • 7.
    © 2008 TheMcGraw-Hill Companies 7 3-1: AM Concepts3-1: AM Concepts  In AM, it is particularly important that the peak value of the modulating signal be less than the peak value of the carrier. Vm < Vc  Distortion occurs when the amplitude of the modulating signal is greater than the amplitude of the carrier.  A modulator is a circuit used to produce AM. Amplitude modulators compute the product of the carrier and modulating signals.
  • 8.
    © 2008 TheMcGraw-Hill Companies 8 3-1: AM Concepts3-1: AM Concepts Figure 3-3: Amplitude modulator showing input and output signals.
  • 9.
    © 2008 TheMcGraw-Hill Companies 9 3-2: Modulation Index and3-2: Modulation Index and Percentage of ModulationPercentage of Modulation  The modulation index (m) is a value that describes the relationship between the amplitude of the modulating signal and the amplitude of the carrier signal. m = Vm / Vc  This index is also known as the modulating factor or coefficient, or the degree of modulation.  Multiplying the modulation index by 100 gives the percentage of modulation.
  • 10.
    © 2008 TheMcGraw-Hill Companies 10 3-2: Modulation Index and3-2: Modulation Index and Percentage of ModulationPercentage of Modulation Overmodulation and Distortion  The modulation index should be a number between 0 and 1.  If the amplitude of the modulating voltage is higher than the carrier voltage, m will be greater than 1, causing distortion.  If the distortion is great enough, the intelligence signal becomes unintelligible.
  • 11.
    © 2008 TheMcGraw-Hill Companies 11 3-2: Modulation Index and3-2: Modulation Index and Percentage of ModulationPercentage of Modulation Overmodulation and Distortion  Distortion of voice transmissions produces garbled, harsh, or unnatural sounds in the speaker.  Distortion of video signals produces a scrambled and inaccurate picture on a TV screen.
  • 12.
    © 2008 TheMcGraw-Hill Companies 12 3-2: Modulation Index and3-2: Modulation Index and Percentage of ModulationPercentage of Modulation Figure 3-4: Distortion of the envelope caused by overmodulation where the modulating signal amplitude Vm is greater than the carrier signal Vc.
  • 13.
    © 2008 TheMcGraw-Hill Companies 13 3-2: Modulation Index and3-2: Modulation Index and Percentage of ModulationPercentage of Modulation Percentage of Modulation  The modulation index is commonly computed from measurements taken on the composite modulated waveform.  Using oscilloscope voltage values: Vm = Vmax − Vmin 2  The amount, or depth, of AM is then expressed as the percentage of modulation (100 × m) rather than as a fraction.
  • 14.
    © 2008 TheMcGraw-Hill Companies 14 3-2: Modulation Index and3-2: Modulation Index and Percentage of ModulationPercentage of Modulation Figure 3-5: AM wave showing peaks (Vmax) and troughs (Vmin).
  • 15.
    © 2008 TheMcGraw-Hill Companies 15 3-3: Sidebands and3-3: Sidebands and the Frequency Domainthe Frequency Domain  Side frequencies, or sidebands are generated as part of the modulation process and occur in the frequency spectrum directly above and below the carrier frequency.
  • 16.
    © 2008 TheMcGraw-Hill Companies 16 3-3: Sidebands and3-3: Sidebands and the Frequency Domainthe Frequency Domain Sideband Calculations  Single-frequency sine-wave modulation generates two sidebands.  Complex wave (e.g. voice or video) modulation generates a range of sidebands.  The upper sideband (fUSB) and the lower sideband (fLSB) are calculated: fUSB = fc + fm and fLSB = fc − fm
  • 17.
    © 2008 TheMcGraw-Hill Companies 17 3-3: Sidebands and3-3: Sidebands and the Frequency Domainthe Frequency Domain Figure 3-6: The AM wave is the algebraic sum of the carrier and upper and lower sideband sine waves. (a) Intelligence or modulating signal. (b) Lower sideband. (c ) Carrier. (d ) Upper sideband. (e ) Composite AM wave.
  • 18.
    © 2008 TheMcGraw-Hill Companies 18 3-3: Sidebands and3-3: Sidebands and the Frequency Domainthe Frequency Domain Frequency-Domain Representation of AM  Observing an AM signal on an oscilloscope, you see only amplitude variations of the carrier with respect to time.  A plot of signal amplitude versus frequency is referred to as frequency-domain display.  A spectrum analyzer is used to display the frequency domain as a signal.  Bandwidth is the difference between the upper and lower sideband frequencies. BW = fUSB−fLSB
  • 19.
    © 2008 TheMcGraw-Hill Companies 19 3-3: Sidebands and3-3: Sidebands and the Frequency Domainthe Frequency Domain Figure 3-8: The relationship between the time and frequency domains.
  • 20.
    © 2008 TheMcGraw-Hill Companies 20 3-3: Sidebands and3-3: Sidebands and the Frequency Domainthe Frequency Domain Frequency-Domain Representation of AM  Example: A standard AM broadcast station is allowed to transmit modulating frequencies up to 5 kHz. If the AM station is transmitting on a frequency of 980 kHz, what are sideband frequencies and total bandwidth? fUSB = 980 + 5 = 985 kHz fLSB = 980 – 5 = 975 kHz BW = fUSB – fLSB = 985 – 975 = 10 kHz BW = 2 (5 kHz) = 10 kHz
  • 21.
    © 2008 TheMcGraw-Hill Companies 21 3-3: Sidebands and3-3: Sidebands and the Frequency Domainthe Frequency Domain Pulse Modulation  When complex signals such as pulses or rectangular waves modulate a carrier, a broad spectrum of sidebands is produced.  A modulating square wave will produce sidebands based on the fundamental sine wave as well as the third, fifth, seventh, etc. harmonics.  Amplitude modulation by square waves or rectangular pulses is referred to as amplitude shift keying (ASK).  ASK is used in some types of data communications.
  • 22.
    © 2008 TheMcGraw-Hill Companies 22 3-3: Sidebands and3-3: Sidebands and the Frequency Domainthe Frequency Domain Figure 3-11: Frequency spectrum of an AM signal modulated by a square wave.
  • 23.
    © 2008 TheMcGraw-Hill Companies 23 3-3: Sidebands and3-3: Sidebands and the Frequency Domainthe Frequency Domain Figure 3-12: Amplitude modulation of a sine wave carrier by a pulse or rectangular wave is called amplitude-shift keying. (a) Fifty percent modulation. (b) One hundred percent modulation.
  • 24.
    © 2008 TheMcGraw-Hill Companies 24 3-3: Sidebands and3-3: Sidebands and the Frequency Domainthe Frequency Domain Pulse Modulation  Continuous-wave (CW) transmission can be achieved by turning the carrier off and on, as in Morse code transmission.  Continuous wave (CW) transmission is sometimes referred to as On-Off keying (OOK).  Splatter is a term used to describe harmonic sideband interference.
  • 25.
    © 2008 TheMcGraw-Hill Companies 25 3-4: AM Power3-4: AM Power  In radio transmission, the AM signal is amplified by a power amplifier.  A radio antenna has a characteristic impedance that is ideally almost pure resistance.  The AM signal is a composite of the carrier and sideband signal voltages.  Each signal produces power in the antenna.  Total transmitted power (PT) is the sum of carrier power (Pc ) and power of the two sidebands (PUSB and PLSB).
  • 26.
    © 2008 TheMcGraw-Hill Companies 26 3-4: AM Power3-4: AM Power  When the percentage of modulation is less than the optimum 100, there is much less power in the sidebands.  Output power can be calculated by using the formula PT = (IT)2 R where IT is measured RF current and R is antenna impedance
  • 27.
    © 2008 TheMcGraw-Hill Companies 27 3-4: AM Power3-4: AM Power  The greater the percentage of modulation, the higher the sideband power and the higher the total power transmitted.  Power in each sideband is calculated PSB = PLSB = PUSB = Pcm2 / 4  Maximum power appears in the sidebands when the carrier is 100 percent modulated.
  • 28.
    © 2008 TheMcGraw-Hill Companies 28 3-5: Single-Sideband Modulation3-5: Single-Sideband Modulation  In amplitude modulation, two-thirds of the transmitted power is in the carrier, which conveys no information.  Signal information is contained within the sidebands.  Single-sideband (SSB) is a form of AM where the carrier is suppressed and one sideband is eliminated.
  • 29.
    © 2008 TheMcGraw-Hill Companies 29 3-5: Single-Sideband Modulation3-5: Single-Sideband Modulation DSB Signals  The first step in generating an SSB signal is to suppress the carrier, leaving the upper and lower sidebands.  This type of signal is called a double-sideband suppressed carrier (DSSC) signal. No power is wasted on the carrier.  A balanced modulator is a circuit used to produce the sum and difference frequencies of a DSSC signal but to cancel or balance out the carrier.  DSB is not widely used because the signal is difficult to demodulate (recover) at the receiver.
  • 30.
    © 2008 TheMcGraw-Hill Companies 30 3-5: Single-Sideband Modulation3-5: Single-Sideband Modulation Figure 3-16: A frequency-domain display of DSB signal.
  • 31.
    © 2008 TheMcGraw-Hill Companies 31 3-5: Single-Sideband Modulation3-5: Single-Sideband Modulation SSB Signals  One sideband is all that is necessary to convey information in a signal.  A single-sideband suppressed carrier (SSSC) signal is generated by suppressing the carrier and one sideband.
  • 32.
    © 2008 TheMcGraw-Hill Companies 32 3-5: Single-Sideband Modulation3-5: Single-Sideband Modulation SSB Signals  SSB signals offer four major benefits: 1. Spectrum space is conserved and allows more signals to be transmitted in the same frequency range. 2. All power is channeled into a single sideband. This produces a stronger signal that will carry farther and will be more reliably received at greater distances. 3. Occupied bandwidth space is narrower and noise in the signal is reduced. 4. There is less selective fading over long distances.
  • 33.
    © 2008 TheMcGraw-Hill Companies 33 3-5: Single-Sideband Modulation3-5: Single-Sideband Modulation Disadvantages of DSB and SSB  Single and double-sideband are not widely used because the signals are difficult to recover (i.e. demodulate) at the receiver.  A low power, pilot carrier is sometimes transmitted along with sidebands in order to more easily recover the signal at the receiver.
  • 34.
    © 2008 TheMcGraw-Hill Companies 34 3-5: Single-Sideband Modulation3-5: Single-Sideband Modulation Signal Power Considerations  In SSB, the transmitter output is expressed in terms of peak envelope power (PEP), the maximum power produced on voice amplitude peaks. Applications of DSB and SSB  A vestigial sideband signal (VSB) is produced by partially suppressing the lower sideband. This kind of signal is used in TV transmission.
  • 35.
    © 2008 TheMcGraw-Hill Companies 35 3-6: Classification of3-6: Classification of Radio EmissionsRadio Emissions  A code is used to designate the types of signals that can be transmitted by radio and wire.  The code is made up of a capital letter and a number.  Lowercase subscript letters are used for more specific definition.  Examples of codes:  DSB two sidebands, full carrier = A3  DSB two sidebands, suppressed carrier = A3b  OOK and ASK = A1
  • 36.
    © 2008 TheMcGraw-Hill Companies 36 3-6: Classification of3-6: Classification of Radio EmissionsRadio Emissions  The International Telecommunications Union (ITU), a standards organization, uses a code to describe signals.  Examples are:  A3F amplitude-modulated analog TV  J3E SSB voice  F2D FSK data  G7E phase-modulated voice, multiple signals
  • 37.
    © 2008 TheMcGraw-Hill Companies 37 3-6: Classification of3-6: Classification of Radio EmissionsRadio Emissions Figure 3-19: Radio emission code designations.
  • 38.
    © 2008 TheMcGraw-Hill Companies 38 3-6: Classification of3-6: Classification of Radio EmissionsRadio Emissions Figure 3-20: ITU emissions designations.