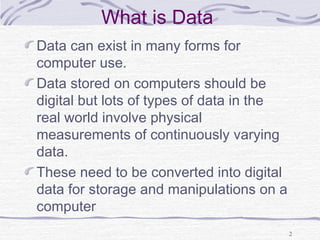
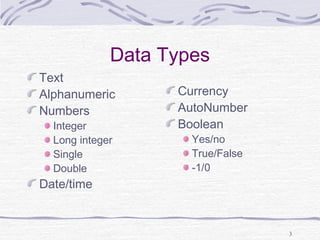
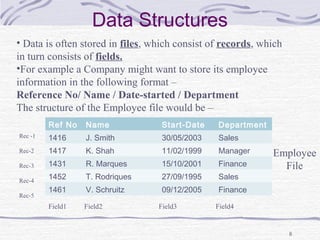
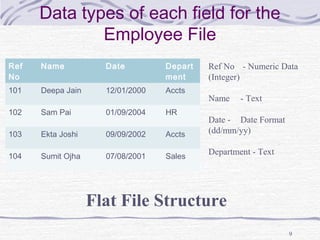
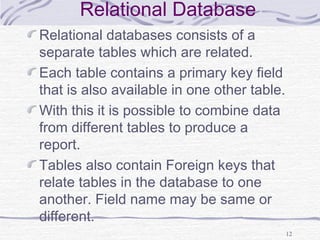
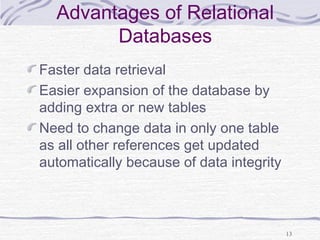
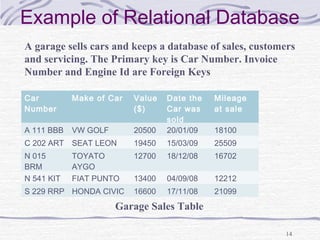
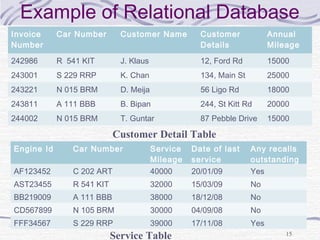
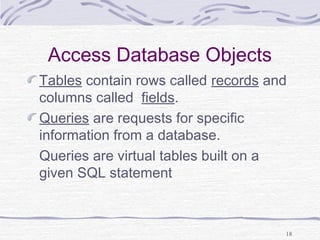
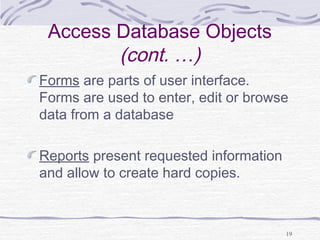
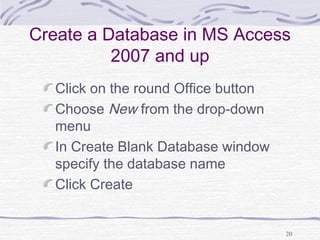
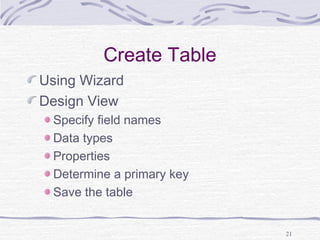
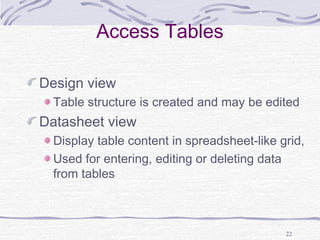
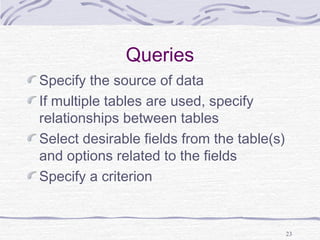
MS Access allows users to create and manage databases. A database contains tables which store records with fields of different data types. Queries can extract specific information from tables. Forms and reports present data to users. Relational databases store related tables and allow combining data through common fields. Users can create tables, queries, forms and reports in Access to enter, organize and present data.
Part 2Provider Database (MS Access)For a review of the complete r.docxherbertwilson5999
Part 2:Provider Database (MS Access)For a review of the complete rubric used in grading this exercise, click on the Assignments tab, then on the title Case Study Part 2 - Provider Database (Access)– click on Show Rubrics if the rubric is not already displayed.
As you recall, data is a collection of facts (numbers, text, even audio and video files) that is processed into usable information. Much like a spreadsheet, a database is a collection of such facts that you can then slice and dice in various ways to extract information or make decisions. However, the advantage and primary use of a database over a spreadsheet is its ability to handle a large volume of data and yet allow for quick access to the information that is desired.
Databases are everywhere now and impact our lives in a multitude of ways. It can accurately be said that “your life is in a database” or, more accurately, in multiple databases, and information about you (a retrieval of facts about you) is easily accessible. Your shopping history, credit history, medical history, even your driving history, is stored in one or more databases.
This exercise will introduce you to the basic building blocks of any database – fields, records, and files (also called tables). Although you will create a database with a single table containing a small amount of data about computer component Providers, the more applicable use of databases involves the creation of many tables linked together with a common field or “key.” Regardless of the size of the database, the data is stored in the same way – in fields which are combined to create a record. And those records are stored in a file or table. The data is entered into the field via a data entry form, and the information is extracted (to answer a particular question or need) via reports and/or queries. Specific instructions for the project can be found in the table below.
Create a provider database and related reports and queries to capture contact information for potential PC component providers that might be used to purchase the equipment your specified in your MS Word project – the PC specifications..
This MS Access database assignment has the following parts:
1. a simple database table to hold provider contact information; some of the required fields in the table require that a Caption be added to the field characteristics. The Caption will be displayed in the report that is to be generated.
1. a simple database form that can be used to enter data into the database table;
1. two simple database reports that can used to present the data as information; and
1. a separate MS Word document answering questions about the database.
All aspects of the assignment will be evaluated according to the following criteria and overall professional, business-like appearance. This would include clear readability and formatting for both screen and print-based output.
Element #
Requirement
Points Allocated
Comments
01
· Launch MS Access and open .
Part 2Supplier Database (MS Access)As you recall, data is a.docxodiliagilby
Part 2:
Supplier Database (MS Access)
As you recall, data is a collection of facts (numbers, text, even audio and video files) that is processed into usable information. Much like a spreadsheet, a database is a collection of such facts that you can then slice and dice in various ways to extract information or make decisions. However, the advantage and primary use of a database over a spreadsheet is its ability to handle a large volume of data and yet allow for quick access to the information that is desired.
Databases are everywhere now and impact our lives in a multitude of ways. It can accurately be said that “your life is in a database” or, more accurately, in multiple databases, and information about you (a retrieval of facts about you) is easily accessible. Your shopping history, credit history, medical history, even your driving history, is stored in one or more databases.
This exercise will introduce you to the basic building blocks of any database – fields, records, and files (also called tables). Although you will create a database with a single table containing a small amount of data about computer component suppliers, the more applicable use of databases involves the creation of many tables linked together with a common field or “key.” Regardless of the size of the database, the data is stored in the same way – in fields which are combined to create a record. And those records are stored in a file or table. The data is entered into the field via a data entry form, and the information is extracted (to answer a particular question or need) via reports and/or queries.
Specific instructions for the project can be found in the table below.
Create a supplier database and related reports and queries to capture contact information for potential PC component suppliers that might be used to purchase the equipment your specified in your MS Word project – the PC specifications..
This MS Access database assignment has the following parts:
a simple database
table
to hold supplier contact information; some of the required fields in the table require that a Caption be added to the field characteristics. The Caption will be displayed in the report that is to be generated.
a simple database
form
that can be used to enter data into the database table;
two
simple database
reports
that can used to present the data as information; and
a separate MS Word
document
answering questions about the database.
All aspects of the assignment will be evaluated according to the following criteria and overall professional, business-like appearance. This would include clear readability and formatting for both screen and print-based output.
Element #
Requirement
Points Allocated
Comments
01
·
Launch MS Access and open a Blank Access database.
·
Save the new database
with the following name:
“
Student’s First Initial Last Name Supplier Information
”
Example:
JSmith Supplier Information
0.1
Create a table with all the following fiel.
As a leading data visualization tool Tableau has many desirable and unique features. Its powerful data discovery and exploration application allows you to answer important questions in seconds. You can use Tableau's drag and drop interface to visualize any data, explore different views, and even combine multiple databases together easily. It does not need any complex scripting. Anyone who understands the business problem can address it with a visualization of the relevant data. When the analysis is finished, sharing with others is as easy as publishing to Tableau Server.
Part 2Provider Database (Open Office Database)Use the project.docxdewhirstichabod
Part 2:
Provider Database (Open Office Database)
Use the project description HERE to complete this activity. For a review of the complete rubric used in grading this exercise, click on the Assignments tab, then on the title
Case Study Part 2 - Provider Database (Access)
– click on Show Rubrics if the rubric is not already displayed. The grading rubric has been built for use with MS Access. However, the elements graded and the point value for each element is identical for anyone using OO for this assignment.
NOTE: there are some great tutorials on working with OpenOffice which can be found in the Content menu. Look for the
Tutorials
menu item in the section under
OpenOffice - Database Alternative for Mac OS X
.
As you recall, data is a collection of facts (numbers, text, even audio and video files) that is processed into usable information. Much like a spreadsheet, a database is a collection of such facts that you can then slice and dice in various ways to extract information or make decisions. However, the advantage and primary use of a database over a spreadsheet is its ability to handle a large volume of data and yet allow for quick access to the information that is desired.
Databases are everywhere now and impact our lives in a multitude of ways. It can accurately be said that “your life is in a database” or, more accurately, in multiple databases, and information about you (a retrieval of facts about you) is easily accessible. Your shopping history, credit history, medical history, even your driving history, is stored in one or more databases.
This exercise will introduce you to the basic building blocks of any database – fields, records, and files (also called tables). Although you will create a database with a single table containing a small amount of data about computer component Providers, the more applicable use of databases involves the creation of many tables linked together with a common field or “key.” Regardless of the size of the database, the data is stored in the same way – in fields which are combined to create a record. And those records are stored in a file or table. The data is entered into the field via a data entry form, and the information is extracted (to answer a particular question or need) via reports and/or queries.
Specific instructions for the project can be found in the table below.
Create a provider database and related reports and queries to capture contact information for potential PC component providers that might be used to purchase the equipment your specified in your MS Word project – the PC specifications..
This Open Office database assignment has the following parts:
a simple database
table
to hold provider contact information; some of the required fields in the table require that a Caption be added to the field characteristics. The Caption will be displayed in the report that is to be generated.
a simple database
form
that can be used to enter data into the database table;
a simp.
UiPath Test Automation using UiPath Test Suite series, part 4DianaGray10
Welcome to UiPath Test Automation using UiPath Test Suite series part 4. In this session, we will cover Test Manager overview along with SAP heatmap.
The UiPath Test Manager overview with SAP heatmap webinar offers a concise yet comprehensive exploration of the role of a Test Manager within SAP environments, coupled with the utilization of heatmaps for effective testing strategies.
Participants will gain insights into the responsibilities, challenges, and best practices associated with test management in SAP projects. Additionally, the webinar delves into the significance of heatmaps as a visual aid for identifying testing priorities, areas of risk, and resource allocation within SAP landscapes. Through this session, attendees can expect to enhance their understanding of test management principles while learning practical approaches to optimize testing processes in SAP environments using heatmap visualization techniques
What will you get from this session?
1. Insights into SAP testing best practices
2. Heatmap utilization for testing
3. Optimization of testing processes
4. Demo
Topics covered:
Execution from the test manager
Orchestrator execution result
Defect reporting
SAP heatmap example with demo
Speaker:
Deepak Rai, Automation Practice Lead, Boundaryless Group and UiPath MVP
Kubernetes & AI - Beauty and the Beast !?! @KCD Istanbul 2024Tobias Schneck
As AI technology is pushing into IT I was wondering myself, as an “infrastructure container kubernetes guy”, how get this fancy AI technology get managed from an infrastructure operational view? Is it possible to apply our lovely cloud native principals as well? What benefit’s both technologies could bring to each other?
Let me take this questions and provide you a short journey through existing deployment models and use cases for AI software. On practical examples, we discuss what cloud/on-premise strategy we may need for applying it to our own infrastructure to get it to work from an enterprise perspective. I want to give an overview about infrastructure requirements and technologies, what could be beneficial or limiting your AI use cases in an enterprise environment. An interactive Demo will give you some insides, what approaches I got already working for real.
Essentials of Automations: Optimizing FME Workflows with ParametersSafe Software
Are you looking to streamline your workflows and boost your projects’ efficiency? Do you find yourself searching for ways to add flexibility and control over your FME workflows? If so, you’re in the right place.
Join us for an insightful dive into the world of FME parameters, a critical element in optimizing workflow efficiency. This webinar marks the beginning of our three-part “Essentials of Automation” series. This first webinar is designed to equip you with the knowledge and skills to utilize parameters effectively: enhancing the flexibility, maintainability, and user control of your FME projects.
Here’s what you’ll gain:
- Essentials of FME Parameters: Understand the pivotal role of parameters, including Reader/Writer, Transformer, User, and FME Flow categories. Discover how they are the key to unlocking automation and optimization within your workflows.
- Practical Applications in FME Form: Delve into key user parameter types including choice, connections, and file URLs. Allow users to control how a workflow runs, making your workflows more reusable. Learn to import values and deliver the best user experience for your workflows while enhancing accuracy.
- Optimization Strategies in FME Flow: Explore the creation and strategic deployment of parameters in FME Flow, including the use of deployment and geometry parameters, to maximize workflow efficiency.
- Pro Tips for Success: Gain insights on parameterizing connections and leveraging new features like Conditional Visibility for clarity and simplicity.
We’ll wrap up with a glimpse into future webinars, followed by a Q&A session to address your specific questions surrounding this topic.
Don’t miss this opportunity to elevate your FME expertise and drive your projects to new heights of efficiency.
The Art of the Pitch: WordPress Relationships and SalesLaura Byrne
Clients don’t know what they don’t know. What web solutions are right for them? How does WordPress come into the picture? How do you make sure you understand scope and timeline? What do you do if sometime changes?
All these questions and more will be explored as we talk about matching clients’ needs with what your agency offers without pulling teeth or pulling your hair out. Practical tips, and strategies for successful relationship building that leads to closing the deal.
Neuro-symbolic is not enough, we need neuro-*semantic*Frank van Harmelen
Neuro-symbolic (NeSy) AI is on the rise. However, simply machine learning on just any symbolic structure is not sufficient to really harvest the gains of NeSy. These will only be gained when the symbolic structures have an actual semantics. I give an operational definition of semantics as “predictable inference”.
All of this illustrated with link prediction over knowledge graphs, but the argument is general.
LF Energy Webinar: Electrical Grid Modelling and Simulation Through PowSyBl -...DanBrown980551
Do you want to learn how to model and simulate an electrical network from scratch in under an hour?
Then welcome to this PowSyBl workshop, hosted by Rte, the French Transmission System Operator (TSO)!
During the webinar, you will discover the PowSyBl ecosystem as well as handle and study an electrical network through an interactive Python notebook.
PowSyBl is an open source project hosted by LF Energy, which offers a comprehensive set of features for electrical grid modelling and simulation. Among other advanced features, PowSyBl provides:
- A fully editable and extendable library for grid component modelling;
- Visualization tools to display your network;
- Grid simulation tools, such as power flows, security analyses (with or without remedial actions) and sensitivity analyses;
The framework is mostly written in Java, with a Python binding so that Python developers can access PowSyBl functionalities as well.
What you will learn during the webinar:
- For beginners: discover PowSyBl's functionalities through a quick general presentation and the notebook, without needing any expert coding skills;
- For advanced developers: master the skills to efficiently apply PowSyBl functionalities to your real-world scenarios.
Securing your Kubernetes cluster_ a step-by-step guide to success !KatiaHIMEUR1
Today, after several years of existence, an extremely active community and an ultra-dynamic ecosystem, Kubernetes has established itself as the de facto standard in container orchestration. Thanks to a wide range of managed services, it has never been so easy to set up a ready-to-use Kubernetes cluster.
However, this ease of use means that the subject of security in Kubernetes is often left for later, or even neglected. This exposes companies to significant risks.
In this talk, I'll show you step-by-step how to secure your Kubernetes cluster for greater peace of mind and reliability.
Builder.ai Founder Sachin Dev Duggal's Strategic Approach to Create an Innova...Ramesh Iyer
In today's fast-changing business world, Companies that adapt and embrace new ideas often need help to keep up with the competition. However, fostering a culture of innovation takes much work. It takes vision, leadership and willingness to take risks in the right proportion. Sachin Dev Duggal, co-founder of Builder.ai, has perfected the art of this balance, creating a company culture where creativity and growth are nurtured at each stage.
Connector Corner: Automate dynamic content and events by pushing a buttonDianaGray10
Here is something new! In our next Connector Corner webinar, we will demonstrate how you can use a single workflow to:
Create a campaign using Mailchimp with merge tags/fields
Send an interactive Slack channel message (using buttons)
Have the message received by managers and peers along with a test email for review
But there’s more:
In a second workflow supporting the same use case, you’ll see:
Your campaign sent to target colleagues for approval
If the “Approve” button is clicked, a Jira/Zendesk ticket is created for the marketing design team
But—if the “Reject” button is pushed, colleagues will be alerted via Slack message
Join us to learn more about this new, human-in-the-loop capability, brought to you by Integration Service connectors.
And...
Speakers:
Akshay Agnihotri, Product Manager
Charlie Greenberg, Host
Encryption in Microsoft 365 - ExpertsLive Netherlands 2024Albert Hoitingh
In this session I delve into the encryption technology used in Microsoft 365 and Microsoft Purview. Including the concepts of Customer Key and Double Key Encryption.
Accelerate your Kubernetes clusters with Varnish CachingThijs Feryn
A presentation about the usage and availability of Varnish on Kubernetes. This talk explores the capabilities of Varnish caching and shows how to use the Varnish Helm chart to deploy it to Kubernetes.
This presentation was delivered at K8SUG Singapore. See https://feryn.eu/presentations/accelerate-your-kubernetes-clusters-with-varnish-caching-k8sug-singapore-28-2024 for more details.
2. What is Data
Data can exist in many forms for
computer use.
Data stored on computers should be
digital but lots of types of data in the
real world involve physical
measurements of continuously varying
data.
These need to be converted into digital
data for storage and manipulations on a
computer
2
6. 6
Boolean Operator
And Logical And Both operands are true
Or Logical Or Either one of the
operands or both of
them are true
Xor Excusive Or Only one of the
operands (not both of
them) are true
Not Negation Operand is not true
7. 7
String and Miscellaneous
Operators
& Concatenation
Like Similar to
Between
…and…
Between 2 values inclusive
In (list) One from the list
Is Null True if the field is empty
8. Data Structures
8
• Data is often stored in files, which consist of records, which
in turn consists of fields.
•For example a Company might want to store its employee
information in the following format –
Reference No/ Name / Date-started / Department
The structure of the Employee file would be –
Ref No Name Start-Date Department
1416 J. Smith 30/05/2003 Sales
1417 K. Shah 11/02/1999 Manager
1431 R. Marques 15/10/2001 Finance
1452 T. Rodriques 27/09/1995 Sales
1461 V. Schruitz 09/12/2005 Finance
Rec -1
Rec-2
Rec-3
Rec-4
Rec-5
Field1 Field2 Field3 Field4
Employee
File
9. Data types of each field for the
Employee File
9
Ref No - Numeric Data
(Integer)
Name - Text
Date - Date Format
(dd/mm/yy)
Department - Text
Flat File Structure
Ref
No
Name Date Depart
ment
101 Deepa Jain 12/01/2000 Accts
102 Sam Pai 01/09/2004 HR
103 Ekta Joshi 09/09/2002 Accts
104 Sumit Ojha 07/08/2001 Sales
10. Database
A database is a collection of information
that is organized so that it can easily be
accessed, managed, and updated. In
one view, databases can be classified
according to types of content:
bibliographic, full-text, numeric, and
images.
In computing, databases are sometimes
classified according to their
organizational approach.
10
11. Why are databases used?
They promote data consistency. When
data is updated on a database it is up-
to-date for any application which uses
the database.
Data duplication is reduced.
It is relatively easy to expand the
database as per new requirement.
Security of data is easier to monitor and
maintain
11
12. 12
Relational Database
Relational databases consists of a
separate tables which are related.
Each table contains a primary key field
that is also available in one other table.
With this it is possible to combine data
from different tables to produce a
report.
Tables also contain Foreign keys that
relate tables in the database to one
another. Field name may be same or
different.
13. Advantages of Relational
Databases
Faster data retrieval
Easier expansion of the database by
adding extra or new tables
Need to change data in only one table
as all other references get updated
automatically because of data integrity
13
14. Example of Relational Database
14
A garage sells cars and keeps a database of sales, customers
and servicing. The Primary key is Car Number. Invoice
Number and Engine Id are Foreign Keys
Car
Number
Make of Car Value
($)
Date the
Car was
sold
Mileage
at sale
A 111 BBB VW GOLF 20500 20/01/09 18100
C 202 ART SEAT LEON 19450 15/03/09 25509
N 015
BRM
TOYATO
AYGO
12700 18/12/08 16702
N 541 KIT FIAT PUNTO 13400 04/09/08 12212
S 229 RRP HONDA CIVIC 16600 17/11/08 21099
Garage Sales Table
15. Example of Relational Database
15
Invoice
Number
Car Number Customer Name Customer
Details
Annual
Mileage
242986 R 541 KIT J. Klaus 12, Ford Rd 15000
243001 S 229 RRP K. Chan 134, Main St 25000
243221 N 015 BRM D. Meija 56 Ligo Rd 18000
243811 A 111 BBB B. Bipan 244, St Kitt Rd 20000
244002 N 015 BRM T. Guntar 87 Pebble Drive 15000
Engine Id Car Number Service
Mileage
Date of last
service
Any recalls
outstanding
AF123452 C 202 ART 40000 20/01/09 Yes
AST23455 R 541 KIT 32000 15/03/09 No
BB219009 A 111 BBB 38000 18/12/08 No
CD567899 N 105 BRM 30000 04/09/08 No
FFF34567 S 229 RRP 39000 17/11/08 Yes
Customer Detail Table
Service Table
16. Questions – Example - 1
How many records can you see in the
Garage Sales Table?
How many fields are there in each
record?
Which field contains:
Numeric Data Only
Text Data Only
Date type of Data only
Marina G. Erechtchoukova 16
17. Questions – Example 2
How many records are there in the
Customer Detail Table?
How many fields are there in the
Service Table?
What type of database is being used
between the three tables?
Which field is a Foreign Key?
Marina G. Erechtchoukova 17
18. 18
Access Database Objects
Tables contain rows called records and
columns called fields.
Queries are requests for specific
information from a database.
Queries are virtual tables built on a
given SQL statement
19. 19
Access Database Objects
(cont. …)
Forms are parts of user interface.
Forms are used to enter, edit or browse
data from a database
Reports present requested information
and allow to create hard copies.
20. 20
Create a Database in MS Access
2007 and up
Click on the round Office button
Choose New from the drop-down
menu
In Create Blank Database window
specify the database name
Click Create
22. 22
Access Tables
Design view
Table structure is created and may be edited
Datasheet view
Display table content in spreadsheet-like grid,
Used for entering, editing or deleting data
from tables
23. 23
Queries
Specify the source of data
If multiple tables are used, specify
relationships between tables
Select desirable fields from the table(s)
and options related to the fields
Specify a criterion
24. 24
Query Criteria
To be selected a record must satisfy a
criterion
Expressions may contain the following
operators:
Math Operators
Relational operators
Boolean Operators
String Operators
Miscellaneous Operators
25. 25
Access Forms
Create using Form Wizard
Create using Form Design view
Specify source of data will be presented by
the form
Table
Query
Specify fields related to the form
Add labels, titles, graphics and so on
26. 26
Form Design view
Form Header –a place for titles,
graphics, additional information
Form Details section – the fields used to
create a form and control elements
related to the fields
Form footer –a place for any items
which will appear at the bottom of the
form
27. 27
Form Controls
Must be bound with fields from the
source table or query
Contain data from correspondent fields,
labels or other controls (like command
button) or another form called subform
28. 28
Viewing Forms
Open database
Click Forms tab to display all available
forms in the database
Select the form
Select Open
To view data use Form Navigation
Tools. To prevent data Editing, use
Locked Property for the Text Boxes
29. 29
Creating Subforms
Represent 1:N relationships
To add a subform to a form
Create a form that will be a subform
Click on Subform/Subreport button and
then click on a form where the subform
should appear
Specify the source for the subform
Specify the fields to link the form and
subform
30. 30
Reports
Reports present table contents or query
results in an easily assimilated format
Reports have Design view and Print
Preview
Report Design View is similar to the
Form Design view
31. 31
Report Design View
Page Header contains data and graphics
appearing at the top of each page
Report Header contains the data and
graphics appearing at the top of the first
report page
Detailed section contains data from tables or
queries
Page Footer contains the data and graphics
appearing at the bottom of every page
Report Footer contains the data and graphics
appearing at the bottom of the last report
page
32. 32
Report Types
Columnar reports – a single record on a
page
Tabular reports – datasheets: fields
from the tables are presented as
columns
Justified reports combine two previous
types of the reports
33. 33
Creating Reports
With a Wizard
Design view:
Specify source for the report
Select Fields from the Fields List
Add labels
Add format
Switch the view to see the result.