Downloaded 100 times


![Calculated control - A control whose source of data is an expression,
rather than a field, is called a calculated control. You specify the value
that you want to use as the source of data in the control by defining
an expression. An expression can be a combination of operators (such
as = and + ), control names, field names, functions that return a single
value, and constant values. For example, the following expression
calculates the price of an item with a 25 percent discount by
multiplying the value in the Unit Price field by a constant value (0.75).
=[Unit Price] * 0.75
An expression can use data from a field in the form or report's
underlying table or query, or data from another control on the form or
report.](https://image.slidesharecdn.com/ms-access2007-180123170804/85/PPT-On-MS-Access-2007-Full-Concepts-32-320.jpg)
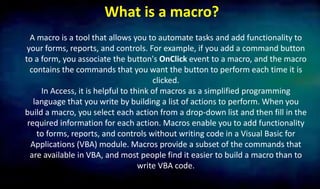
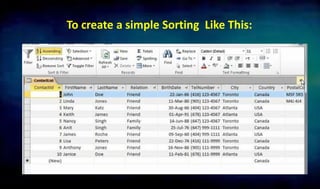


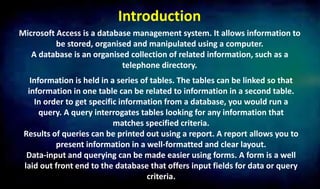
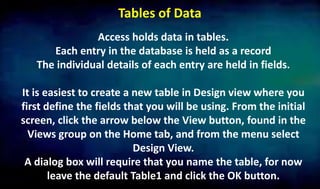
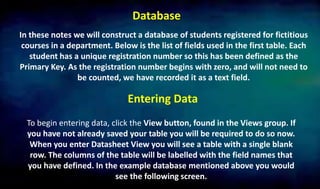
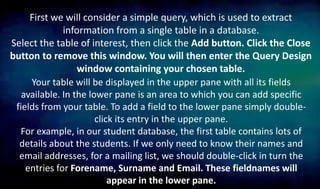
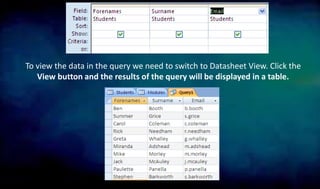
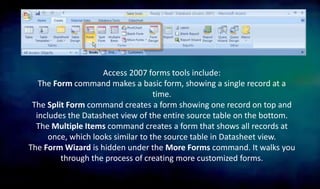
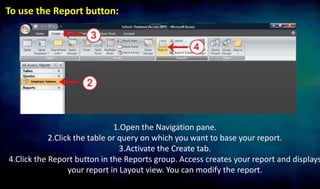
Microsoft Access is a database management system that allows information to be stored, organized, and manipulated in tables. Information is held in tables that can be linked, and specific information can be retrieved by running queries. Results of queries and organized data can be presented using reports and forms provide easy input of data and criteria for queries.