SlideShare a Scribd company logo
Solved Problem 1
Nelson’s Hardware Store stocks a 19.2 volt cordless drill that is a popular
seller. Annual demand is 5,000 units, the ordering cost is $15, and the
inventory holding cost is $4/unit/year.
a. What is the economic order quantity?
b. What is the total annual cost for this inventory item?
SOLUTION
a. The order quantity is
EOQ = =
2DS
H
2(5,000)($15)
$4
= 37,500 = 193.65 or 194 drills
b. The total annual cost is
C = (H) + (S) =
Q
2
D
Q
($4) + ($15) = $774.60
194
2
5,000
194
Solved Problem 2
Jan Feb Mar Apr May June July Aug Sept Oct Nov Dec
Year 1 80 70 110 100 110 90 80 120 100 130 110 100
Year 2 120 130 50 70 120 100 90 70 100 80 140 140
For a product managed according to the Economic Order Quantity method,
the table shows monthly demand rates for the last two years
The product is bought at 20 Euros per unit. Set up cost is 105 Euros and
holding cost is 35% of the purchasing price.
Service level decided by management is 95%.
Delivery lead time is 1 month.
•Calculate EOQ, Number of orders and time between orders
•Calculate the reorder point ROP
•Trace the inventory profile
Solved Problem 2
Solution:
• Total demand of the 1st year: 1200 (sum of the 1st row)
• Total demand of the 2nd year: 1210 (sum of the 2st row)
• Mean year demand: D = (1200 + 1210)/2 = 1205 per year
• Mean monthly demand: d = (1200+1210)/24 = 100,4167 ≈ 100
prod/month
Economic Order Quantity:
• EOQ = = = 190,1315 ≈ 190
• Number of orders = D/EOQ = 1205/190 ≈ 6,3 orders per year
• Time between orders = EOQ / D = 0,15 year or similarly EOQ/D*(12
months/year) = 1,89 months ≈ 2 months
H
DS
2
35
,
0
20
105
1205
2



Solved Problem 2
Calculation of Reorder Point
• ROP = Average demand during lead time +
Safety Stock
• The lead time L is 1 month, and we also know
the mean monthly demand d. Therefore, the
average demand during lead time is d*L = 100.
Solved Problem 2
• We also need to determine the safety stock S. The formula for
the safety stock is S = z * standard deviation of the demand
during lead time (sd).
• The term z can be obtained from normal distribution tables. For
a given service level of 95% z = 1,645. On the other hand, the
monthly standard deviation of the demand can be calculated
from the table of the monthly demand rates using the formula
below.
86177
,
23
83
,
13095
23
1
)
(
1
1
1
2




 

n
i
i d
d
n
sd
Thereafter, S = 1,645*23,86177 = 39,2526 ≈ 40 products
As such, ROP = 100 + 40 = 140
To trace the inventory, we start at the replenishment level (which is
EOQ + safety stock) and we draw a graph similar to that of the slides.
Solved Problem 3
Our company manages an inventory of light bulbs. A particular lamp is
bought at 10 cents. Ordering cost is 150 cents and holding cost is 20% of
unit price per unit and year.
The factory works 12 months per year, steady production and
management requires an 80% service level for this particular item.
Delivery lead time from the supplier is 1,5 months.
The monthly demand over the last 24 months is as follows:
500, 500, 425, 425, 450, 425, 425, 475, 475, 425, 425, 425, 475, 525, 425,
425, 450, 475, 425, 425, 475, 450, 425, 425.
Compute the following:
• Economic order quantity
• Reorder point
Solved Problem 3
SOLUTION
• Total demand: 10800 (sum of 24months)
• Mean year demand: D = (10800)/2 = 5400 lamps per year
• Mean monthly demand: d = 5400/12 = 450 lamps/month
Economic Order Quantity:
• EOQ = = = 900 lamps
• Number of orders = D/EOQ = 5400/900 ≈ 6 orders per year
• Time between orders = EOQ / D = 0,167 year or approximately ≈ 2
months
H
DS
2
2
,
0
10
150
5400
2



Solved Problem 3
Calculation of Reorder Point
• ROP = Average demand during lead time + Safety Stock
• The lead time L is 1,5 month. The mean monthly demand d is 450.
Therefore, the average demand during lead time is d*L = 675.
Solved Problem 3
We also need to determine the safety stock S. The formula for the safety
stock is S = z * standard deviation of the demand during lead time (sd). The
term z can be obtained from normal distribution tables. For a given service
level of 80% z = 0,84. On the other hand, the monthly standard deviation of
the demand can be calculated from the table of the monthly demand rates
using the formula below.
• Thereafter, S = 0,84*sd* = 31,70 ≈ 32 lamps
• As such, ROP = 900 + 32 = 932
82134
,
30
)
(
1
1
1
2



 

n
i
i d
d
n
sd
Solved Problem 4
Grey Wolf Lodge is a popular 500-room hotel in the North Woods.
Managers need to keep close tabs on all room service items, including a
special pine-scented bar soap. The daily demand for the soap is 275 bars,
with a standard deviation of 30 bars. Ordering cost is $10 and the
inventory holding cost is $0.30/bar/year. The lead time from the supplier is
5 days, with a standard deviation of 1 day. The lodge is open 365 days a
year.
a. What is the economic order quantity for the bar of soap?
b. What should the reorder point be for the bar of soap if
management wants to have a 99 percent cycle-service level?
c. What is the total annual cost for the bar of soap, assuming a
Q system will be used?
Solved Problem 4
SOLUTION
a. We have D = (275)(365) = 100,375 bars of soap; S = $10; and H = $0.30.
The EOQ for the bar of soap is
EOQ = =
2DS
H
2(100,375)($10)
$0.30
= 6,691,666.7 = 2,586.83 or 2,587 bars
Solved Problem 4
b. We have d = 275 bars/day, σd = 30 bars, L = 5 days,
and σLT = 1 day.
σdLT = Lσd
2 + d2σLT
2 = (5)(30)2 + (275)2(1)2 = 283.06 bars
Consult the body of the Normal Distribution appendix for
0.9900. The closest value is 0.9901, which corresponds to
a z value of 2.33. We calculate the safety stock and reorder
point as follows:
Safety stock = zσdLT = (2.33)(283.06) = 659.53 or 660 bars
Reorder point = dL + Safety stock = (275)(5) + 660 = 2,035 bars
Solved Problem 4
c. The total annual cost for the Q system is
C = (H) + (S) + (H)(Safety stock)
Q
2
D
Q
C = ($0.30) + ($10) + ($0.30)(660) = $974.05
2,587
2
100,375
2,587
Solved Problem 5
ABC Classification: Example
1 $ 60 90
2 350 40
3 30 130
4 80 60
5 30 100
6 20 180
7 10 170
8 320 50
9 510 60
10 20 120
PART UNIT COST ANNUAL USAGE
Solved Problem 5
ABC Classification: Example (cont.)
Example 10.1
1 $ 60 90
2 350 40
3 30 130
4 80 60
5 30 100
6 20 180
7 10 170
8 320 50
9 510 60
10 20 120
PART UNIT COST ANNUAL USAGE
TOTAL % OF TOTAL % OF TOTAL
PART VALUE VALUE QUANTITY % CUMMULATIVE
9 $30,600 35.9 6.0 6.0
8 16,000 18.7 5.0 11.0
2 14,000 16.4 4.0 15.0
1 5,400 6.3 9.0 24.0
4 4,800 5.6 6.0 30.0
3 3,900 4.6 10.0 40.0
6 3,600 4.2 18.0 58.0
5 3,000 3.5 13.0 71.0
10 2,400 2.8 12.0 83.0
7 1,700 2.0 17.0 100.0
$85,400
A
B
C
% OF TOTAL % OF TOTAL
CLASS ITEMS VALUE QUANTITY
A 9, 8, 2 71.0 15.0
B 1, 4, 3 16.5 25.0
C 6, 5, 10, 7 12.5 60.0

More Related Content

What's hot

inventory management ppt
inventory management pptinventory management ppt
inventory management pptMayank Baheti
 
MRP exercises
MRP exercisesMRP exercises
MRP exercises
Lucia Garrido
 
Inventory management
Inventory managementInventory management
Inventory management
Shilpi Panchal
 
Operations Management Material Requirements Planning (MRP)
Operations ManagementMaterial Requirements Planning (MRP)Operations ManagementMaterial Requirements Planning (MRP)
Operations Management Material Requirements Planning (MRP)Mostafa Ewees
 
Inventory management
Inventory managementInventory management
Inventory management
kahogan62
 
Lot Sizing Techniques
Lot Sizing TechniquesLot Sizing Techniques
Lot Sizing Techniques
Anand Subramaniam
 
Inventory management
Inventory managementInventory management
Inventory management
saurabhsabiba
 
INVENTORY MANAGEMENT
INVENTORY MANAGEMENT INVENTORY MANAGEMENT
INVENTORY MANAGEMENT
Zamri Yahya
 
INVENTORY DECISION MAKING
INVENTORY DECISION MAKINGINVENTORY DECISION MAKING
INVENTORY DECISION MAKING
Ashish Hande
 
Becdoms ppt on inventory management
Becdoms ppt on inventory management  Becdoms ppt on inventory management
Becdoms ppt on inventory management
Babasab Patil
 
Reorder point
Reorder pointReorder point
Reorder point
Don Paul
 
Inventory
InventoryInventory
Inventory
JhOnie JhOan
 
Cycle inventory
Cycle inventoryCycle inventory
Cycle inventory
Shagun Agarwal
 
INVENTORY MANAGEMENT
INVENTORY MANAGEMENTINVENTORY MANAGEMENT
INVENTORY MANAGEMENT
MUHAMMED SADIK K K
 
Line balancing
Line balancingLine balancing
Line balancing
Hiwa Gaffari
 
Basic EOQ Model, Quantity Discount, Economic Lot Size
Basic EOQ Model, Quantity Discount, Economic Lot SizeBasic EOQ Model, Quantity Discount, Economic Lot Size
Basic EOQ Model, Quantity Discount, Economic Lot Size
Phillip Leonard Petate
 
Ch-7_Order Quantities.ppt
Ch-7_Order Quantities.pptCh-7_Order Quantities.ppt
Ch-7_Order Quantities.ppt
JahidulIslam758305
 

What's hot (20)

inventory management ppt
inventory management pptinventory management ppt
inventory management ppt
 
MRP exercises
MRP exercisesMRP exercises
MRP exercises
 
Inventory management
Inventory managementInventory management
Inventory management
 
Operations Management Material Requirements Planning (MRP)
Operations ManagementMaterial Requirements Planning (MRP)Operations ManagementMaterial Requirements Planning (MRP)
Operations Management Material Requirements Planning (MRP)
 
Inventory management
Inventory managementInventory management
Inventory management
 
Lot Sizing Techniques
Lot Sizing TechniquesLot Sizing Techniques
Lot Sizing Techniques
 
Inventory management
Inventory managementInventory management
Inventory management
 
INVENTORY MANAGEMENT
INVENTORY MANAGEMENT INVENTORY MANAGEMENT
INVENTORY MANAGEMENT
 
Inventory control
Inventory controlInventory control
Inventory control
 
Aggregate Planning
Aggregate PlanningAggregate Planning
Aggregate Planning
 
INVENTORY DECISION MAKING
INVENTORY DECISION MAKINGINVENTORY DECISION MAKING
INVENTORY DECISION MAKING
 
Becdoms ppt on inventory management
Becdoms ppt on inventory management  Becdoms ppt on inventory management
Becdoms ppt on inventory management
 
Reorder point
Reorder pointReorder point
Reorder point
 
Inventory
InventoryInventory
Inventory
 
Cycle inventory
Cycle inventoryCycle inventory
Cycle inventory
 
INVENTORY MANAGEMENT
INVENTORY MANAGEMENTINVENTORY MANAGEMENT
INVENTORY MANAGEMENT
 
Line balancing
Line balancingLine balancing
Line balancing
 
Line balancing
Line balancingLine balancing
Line balancing
 
Basic EOQ Model, Quantity Discount, Economic Lot Size
Basic EOQ Model, Quantity Discount, Economic Lot SizeBasic EOQ Model, Quantity Discount, Economic Lot Size
Basic EOQ Model, Quantity Discount, Economic Lot Size
 
Ch-7_Order Quantities.ppt
Ch-7_Order Quantities.pptCh-7_Order Quantities.ppt
Ch-7_Order Quantities.ppt
 

Similar to Inventory Management Self Study Exercises.pptx

Topic 4 Inventory Management Model.pptx
Topic 4 Inventory Management Model.pptxTopic 4 Inventory Management Model.pptx
Topic 4 Inventory Management Model.pptx
HassanHani5
 
Inventory probs-solns-s07
Inventory probs-solns-s07Inventory probs-solns-s07
Inventory probs-solns-s07
Saurabh Prasad
 
383046106 gestion-de-inventarios-1
383046106 gestion-de-inventarios-1383046106 gestion-de-inventarios-1
383046106 gestion-de-inventarios-1
CarlosLeverman
 
Ch 5 Inventory management slides iijfsjfksjkf
Ch 5 Inventory management slides iijfsjfksjkfCh 5 Inventory management slides iijfsjfksjkf
Ch 5 Inventory management slides iijfsjfksjkf
delphijean1
 
Chapter 14
Chapter 14Chapter 14
Chapter 14
Rashedur Rahman
 
ECONOMIC ORDER QTY
ECONOMIC ORDER QTYECONOMIC ORDER QTY
ECONOMIC ORDER QTY
Prashant Sharma
 
chap014.ppt
chap014.pptchap014.ppt
chap014.ppt
AgungTriPamungkas1
 
Inventory management
Inventory managementInventory management
Inventory management
Hriday Bora
 
67 ddmt mvcap36extra problems with solutions
67 ddmt mvcap36extra problems with solutions67 ddmt mvcap36extra problems with solutions
67 ddmt mvcap36extra problems with solutionsIvy de Guzman
 
12 Managerial Accounting 12 Depreciation.ppt
12 Managerial Accounting 12 Depreciation.ppt12 Managerial Accounting 12 Depreciation.ppt
12 Managerial Accounting 12 Depreciation.ppt
OuardaMicrobiologist
 
working capital ch solution financial management ....mohsin mumtaz
working capital ch solution financial management ....mohsin mumtazworking capital ch solution financial management ....mohsin mumtaz
working capital ch solution financial management ....mohsin mumtaz
mianmohsinmumtazshb
 
Inventory management
Inventory managementInventory management
Inventory management
AngelaMaurya
 
3. good inventory-management-edited-ppt
3. good  inventory-management-edited-ppt3. good  inventory-management-edited-ppt
3. good inventory-management-edited-ppt
shahidch44
 
Home Work; Chapter 9; Inventory Policy Decisions
Home Work; Chapter 9; Inventory Policy DecisionsHome Work; Chapter 9; Inventory Policy Decisions
Home Work; Chapter 9; Inventory Policy Decisions
Shaheen Sardar
 
Presentation6 -principles of economics
 Presentation6 -principles of economics  Presentation6 -principles of economics
Presentation6 -principles of economics
Kareem Hossam
 
Quantity discount
Quantity discountQuantity discount
Quantity discount
Hriday Bora
 
MANAGEMENT ACCOUNTING Model Solution CM231.-MAC-IL-II-Solution-CMA-May-2022-...
 MANAGEMENT ACCOUNTING Model Solution CM231.-MAC-IL-II-Solution-CMA-May-2022-... MANAGEMENT ACCOUNTING Model Solution CM231.-MAC-IL-II-Solution-CMA-May-2022-...
MANAGEMENT ACCOUNTING Model Solution CM231.-MAC-IL-II-Solution-CMA-May-2022-...
Sazzad Hossain, ITP, MBA, CSCA™
 
Problem 6-2A manager wants to assign tasks to workstations as .docx
Problem 6-2A manager wants to assign tasks to workstations as .docxProblem 6-2A manager wants to assign tasks to workstations as .docx
Problem 6-2A manager wants to assign tasks to workstations as .docx
sleeperharwell
 

Similar to Inventory Management Self Study Exercises.pptx (20)

Topic 4 Inventory Management Model.pptx
Topic 4 Inventory Management Model.pptxTopic 4 Inventory Management Model.pptx
Topic 4 Inventory Management Model.pptx
 
Inventory probs-solns-s07
Inventory probs-solns-s07Inventory probs-solns-s07
Inventory probs-solns-s07
 
383046106 gestion-de-inventarios-1
383046106 gestion-de-inventarios-1383046106 gestion-de-inventarios-1
383046106 gestion-de-inventarios-1
 
Ch12pp
Ch12ppCh12pp
Ch12pp
 
Ch 5 Inventory management slides iijfsjfksjkf
Ch 5 Inventory management slides iijfsjfksjkfCh 5 Inventory management slides iijfsjfksjkf
Ch 5 Inventory management slides iijfsjfksjkf
 
Chapter 14
Chapter 14Chapter 14
Chapter 14
 
ECONOMIC ORDER QTY
ECONOMIC ORDER QTYECONOMIC ORDER QTY
ECONOMIC ORDER QTY
 
Eoq model
Eoq modelEoq model
Eoq model
 
chap014.ppt
chap014.pptchap014.ppt
chap014.ppt
 
Inventory management
Inventory managementInventory management
Inventory management
 
67 ddmt mvcap36extra problems with solutions
67 ddmt mvcap36extra problems with solutions67 ddmt mvcap36extra problems with solutions
67 ddmt mvcap36extra problems with solutions
 
12 Managerial Accounting 12 Depreciation.ppt
12 Managerial Accounting 12 Depreciation.ppt12 Managerial Accounting 12 Depreciation.ppt
12 Managerial Accounting 12 Depreciation.ppt
 
working capital ch solution financial management ....mohsin mumtaz
working capital ch solution financial management ....mohsin mumtazworking capital ch solution financial management ....mohsin mumtaz
working capital ch solution financial management ....mohsin mumtaz
 
Inventory management
Inventory managementInventory management
Inventory management
 
3. good inventory-management-edited-ppt
3. good  inventory-management-edited-ppt3. good  inventory-management-edited-ppt
3. good inventory-management-edited-ppt
 
Home Work; Chapter 9; Inventory Policy Decisions
Home Work; Chapter 9; Inventory Policy DecisionsHome Work; Chapter 9; Inventory Policy Decisions
Home Work; Chapter 9; Inventory Policy Decisions
 
Presentation6 -principles of economics
 Presentation6 -principles of economics  Presentation6 -principles of economics
Presentation6 -principles of economics
 
Quantity discount
Quantity discountQuantity discount
Quantity discount
 
MANAGEMENT ACCOUNTING Model Solution CM231.-MAC-IL-II-Solution-CMA-May-2022-...
 MANAGEMENT ACCOUNTING Model Solution CM231.-MAC-IL-II-Solution-CMA-May-2022-... MANAGEMENT ACCOUNTING Model Solution CM231.-MAC-IL-II-Solution-CMA-May-2022-...
MANAGEMENT ACCOUNTING Model Solution CM231.-MAC-IL-II-Solution-CMA-May-2022-...
 
Problem 6-2A manager wants to assign tasks to workstations as .docx
Problem 6-2A manager wants to assign tasks to workstations as .docxProblem 6-2A manager wants to assign tasks to workstations as .docx
Problem 6-2A manager wants to assign tasks to workstations as .docx
 

Recently uploaded

Chapter 7 Final business management sciences .ppt
Chapter 7 Final business management sciences .pptChapter 7 Final business management sciences .ppt
Chapter 7 Final business management sciences .ppt
ssuser567e2d
 
An introduction to the cryptocurrency investment platform Binance Savings.
An introduction to the cryptocurrency investment platform Binance Savings.An introduction to the cryptocurrency investment platform Binance Savings.
An introduction to the cryptocurrency investment platform Binance Savings.
Any kyc Account
 
Recruiting in the Digital Age: A Social Media Masterclass
Recruiting in the Digital Age: A Social Media MasterclassRecruiting in the Digital Age: A Social Media Masterclass
Recruiting in the Digital Age: A Social Media Masterclass
LuanWise
 
Exploring Patterns of Connection with Social Dreaming
Exploring Patterns of Connection with Social DreamingExploring Patterns of Connection with Social Dreaming
Exploring Patterns of Connection with Social Dreaming
Nicola Wreford-Howard
 
The Influence of Marketing Strategy and Market Competition on Business Perfor...
The Influence of Marketing Strategy and Market Competition on Business Perfor...The Influence of Marketing Strategy and Market Competition on Business Perfor...
The Influence of Marketing Strategy and Market Competition on Business Perfor...
Adam Smith
 
FIA officials brutally tortured innocent and snatched 200 Bitcoins of worth 4...
FIA officials brutally tortured innocent and snatched 200 Bitcoins of worth 4...FIA officials brutally tortured innocent and snatched 200 Bitcoins of worth 4...
FIA officials brutally tortured innocent and snatched 200 Bitcoins of worth 4...
jamalseoexpert1978
 
Anny Serafina Love - Letter of Recommendation by Kellen Harkins, MS.
Anny Serafina Love - Letter of Recommendation by Kellen Harkins, MS.Anny Serafina Love - Letter of Recommendation by Kellen Harkins, MS.
Anny Serafina Love - Letter of Recommendation by Kellen Harkins, MS.
AnnySerafinaLove
 
Authentically Social Presented by Corey Perlman
Authentically Social Presented by Corey PerlmanAuthentically Social Presented by Corey Perlman
Authentically Social Presented by Corey Perlman
Corey Perlman, Social Media Speaker and Consultant
 
Digital Transformation and IT Strategy Toolkit and Templates
Digital Transformation and IT Strategy Toolkit and TemplatesDigital Transformation and IT Strategy Toolkit and Templates
Digital Transformation and IT Strategy Toolkit and Templates
Aurelien Domont, MBA
 
BeMetals Investor Presentation_June 1, 2024.pdf
BeMetals Investor Presentation_June 1, 2024.pdfBeMetals Investor Presentation_June 1, 2024.pdf
BeMetals Investor Presentation_June 1, 2024.pdf
DerekIwanaka1
 
ikea_woodgreen_petscharity_dog-alogue_digital.pdf
ikea_woodgreen_petscharity_dog-alogue_digital.pdfikea_woodgreen_petscharity_dog-alogue_digital.pdf
ikea_woodgreen_petscharity_dog-alogue_digital.pdf
agatadrynko
 
-- June 2024 is National Volunteer Month --
-- June 2024 is National Volunteer Month ---- June 2024 is National Volunteer Month --
-- June 2024 is National Volunteer Month --
NZSG
 
The Influence of Marketing Strategy and Market Competition on Business Perfor...
The Influence of Marketing Strategy and Market Competition on Business Perfor...The Influence of Marketing Strategy and Market Competition on Business Perfor...
The Influence of Marketing Strategy and Market Competition on Business Perfor...
Adam Smith
 
Project File Report BBA 6th semester.pdf
Project File Report BBA 6th semester.pdfProject File Report BBA 6th semester.pdf
Project File Report BBA 6th semester.pdf
RajPriye
 
Company Valuation webinar series - Tuesday, 4 June 2024
Company Valuation webinar series - Tuesday, 4 June 2024Company Valuation webinar series - Tuesday, 4 June 2024
Company Valuation webinar series - Tuesday, 4 June 2024
FelixPerez547899
 
Top mailing list providers in the USA.pptx
Top mailing list providers in the USA.pptxTop mailing list providers in the USA.pptx
Top mailing list providers in the USA.pptx
JeremyPeirce1
 
ModelingMarketingStrategiesMKS.CollumbiaUniversitypdf
ModelingMarketingStrategiesMKS.CollumbiaUniversitypdfModelingMarketingStrategiesMKS.CollumbiaUniversitypdf
ModelingMarketingStrategiesMKS.CollumbiaUniversitypdf
fisherameliaisabella
 
Authentically Social by Corey Perlman - EO Puerto Rico
Authentically Social by Corey Perlman - EO Puerto RicoAuthentically Social by Corey Perlman - EO Puerto Rico
Authentically Social by Corey Perlman - EO Puerto Rico
Corey Perlman, Social Media Speaker and Consultant
 
Premium MEAN Stack Development Solutions for Modern Businesses
Premium MEAN Stack Development Solutions for Modern BusinessesPremium MEAN Stack Development Solutions for Modern Businesses
Premium MEAN Stack Development Solutions for Modern Businesses
SynapseIndia
 
3.0 Project 2_ Developing My Brand Identity Kit.pptx
3.0 Project 2_ Developing My Brand Identity Kit.pptx3.0 Project 2_ Developing My Brand Identity Kit.pptx
3.0 Project 2_ Developing My Brand Identity Kit.pptx
tanyjahb
 

Recently uploaded (20)

Chapter 7 Final business management sciences .ppt
Chapter 7 Final business management sciences .pptChapter 7 Final business management sciences .ppt
Chapter 7 Final business management sciences .ppt
 
An introduction to the cryptocurrency investment platform Binance Savings.
An introduction to the cryptocurrency investment platform Binance Savings.An introduction to the cryptocurrency investment platform Binance Savings.
An introduction to the cryptocurrency investment platform Binance Savings.
 
Recruiting in the Digital Age: A Social Media Masterclass
Recruiting in the Digital Age: A Social Media MasterclassRecruiting in the Digital Age: A Social Media Masterclass
Recruiting in the Digital Age: A Social Media Masterclass
 
Exploring Patterns of Connection with Social Dreaming
Exploring Patterns of Connection with Social DreamingExploring Patterns of Connection with Social Dreaming
Exploring Patterns of Connection with Social Dreaming
 
The Influence of Marketing Strategy and Market Competition on Business Perfor...
The Influence of Marketing Strategy and Market Competition on Business Perfor...The Influence of Marketing Strategy and Market Competition on Business Perfor...
The Influence of Marketing Strategy and Market Competition on Business Perfor...
 
FIA officials brutally tortured innocent and snatched 200 Bitcoins of worth 4...
FIA officials brutally tortured innocent and snatched 200 Bitcoins of worth 4...FIA officials brutally tortured innocent and snatched 200 Bitcoins of worth 4...
FIA officials brutally tortured innocent and snatched 200 Bitcoins of worth 4...
 
Anny Serafina Love - Letter of Recommendation by Kellen Harkins, MS.
Anny Serafina Love - Letter of Recommendation by Kellen Harkins, MS.Anny Serafina Love - Letter of Recommendation by Kellen Harkins, MS.
Anny Serafina Love - Letter of Recommendation by Kellen Harkins, MS.
 
Authentically Social Presented by Corey Perlman
Authentically Social Presented by Corey PerlmanAuthentically Social Presented by Corey Perlman
Authentically Social Presented by Corey Perlman
 
Digital Transformation and IT Strategy Toolkit and Templates
Digital Transformation and IT Strategy Toolkit and TemplatesDigital Transformation and IT Strategy Toolkit and Templates
Digital Transformation and IT Strategy Toolkit and Templates
 
BeMetals Investor Presentation_June 1, 2024.pdf
BeMetals Investor Presentation_June 1, 2024.pdfBeMetals Investor Presentation_June 1, 2024.pdf
BeMetals Investor Presentation_June 1, 2024.pdf
 
ikea_woodgreen_petscharity_dog-alogue_digital.pdf
ikea_woodgreen_petscharity_dog-alogue_digital.pdfikea_woodgreen_petscharity_dog-alogue_digital.pdf
ikea_woodgreen_petscharity_dog-alogue_digital.pdf
 
-- June 2024 is National Volunteer Month --
-- June 2024 is National Volunteer Month ---- June 2024 is National Volunteer Month --
-- June 2024 is National Volunteer Month --
 
The Influence of Marketing Strategy and Market Competition on Business Perfor...
The Influence of Marketing Strategy and Market Competition on Business Perfor...The Influence of Marketing Strategy and Market Competition on Business Perfor...
The Influence of Marketing Strategy and Market Competition on Business Perfor...
 
Project File Report BBA 6th semester.pdf
Project File Report BBA 6th semester.pdfProject File Report BBA 6th semester.pdf
Project File Report BBA 6th semester.pdf
 
Company Valuation webinar series - Tuesday, 4 June 2024
Company Valuation webinar series - Tuesday, 4 June 2024Company Valuation webinar series - Tuesday, 4 June 2024
Company Valuation webinar series - Tuesday, 4 June 2024
 
Top mailing list providers in the USA.pptx
Top mailing list providers in the USA.pptxTop mailing list providers in the USA.pptx
Top mailing list providers in the USA.pptx
 
ModelingMarketingStrategiesMKS.CollumbiaUniversitypdf
ModelingMarketingStrategiesMKS.CollumbiaUniversitypdfModelingMarketingStrategiesMKS.CollumbiaUniversitypdf
ModelingMarketingStrategiesMKS.CollumbiaUniversitypdf
 
Authentically Social by Corey Perlman - EO Puerto Rico
Authentically Social by Corey Perlman - EO Puerto RicoAuthentically Social by Corey Perlman - EO Puerto Rico
Authentically Social by Corey Perlman - EO Puerto Rico
 
Premium MEAN Stack Development Solutions for Modern Businesses
Premium MEAN Stack Development Solutions for Modern BusinessesPremium MEAN Stack Development Solutions for Modern Businesses
Premium MEAN Stack Development Solutions for Modern Businesses
 
3.0 Project 2_ Developing My Brand Identity Kit.pptx
3.0 Project 2_ Developing My Brand Identity Kit.pptx3.0 Project 2_ Developing My Brand Identity Kit.pptx
3.0 Project 2_ Developing My Brand Identity Kit.pptx
 

Inventory Management Self Study Exercises.pptx

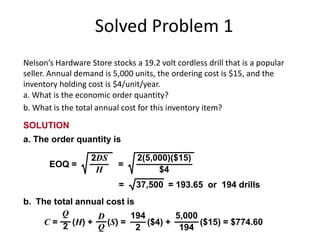
  • 1. Solved Problem 1 Nelson’s Hardware Store stocks a 19.2 volt cordless drill that is a popular seller. Annual demand is 5,000 units, the ordering cost is $15, and the inventory holding cost is $4/unit/year. a. What is the economic order quantity? b. What is the total annual cost for this inventory item? SOLUTION a. The order quantity is EOQ = = 2DS H 2(5,000)($15) $4 = 37,500 = 193.65 or 194 drills b. The total annual cost is C = (H) + (S) = Q 2 D Q ($4) + ($15) = $774.60 194 2 5,000 194
  • 2. Solved Problem 2 Jan Feb Mar Apr May June July Aug Sept Oct Nov Dec Year 1 80 70 110 100 110 90 80 120 100 130 110 100 Year 2 120 130 50 70 120 100 90 70 100 80 140 140 For a product managed according to the Economic Order Quantity method, the table shows monthly demand rates for the last two years The product is bought at 20 Euros per unit. Set up cost is 105 Euros and holding cost is 35% of the purchasing price. Service level decided by management is 95%. Delivery lead time is 1 month. •Calculate EOQ, Number of orders and time between orders •Calculate the reorder point ROP •Trace the inventory profile
  • 3. Solved Problem 2 Solution: • Total demand of the 1st year: 1200 (sum of the 1st row) • Total demand of the 2nd year: 1210 (sum of the 2st row) • Mean year demand: D = (1200 + 1210)/2 = 1205 per year • Mean monthly demand: d = (1200+1210)/24 = 100,4167 ≈ 100 prod/month Economic Order Quantity: • EOQ = = = 190,1315 ≈ 190 • Number of orders = D/EOQ = 1205/190 ≈ 6,3 orders per year • Time between orders = EOQ / D = 0,15 year or similarly EOQ/D*(12 months/year) = 1,89 months ≈ 2 months H DS 2 35 , 0 20 105 1205 2   
  • 4. Solved Problem 2 Calculation of Reorder Point • ROP = Average demand during lead time + Safety Stock • The lead time L is 1 month, and we also know the mean monthly demand d. Therefore, the average demand during lead time is d*L = 100.
  • 5. Solved Problem 2 • We also need to determine the safety stock S. The formula for the safety stock is S = z * standard deviation of the demand during lead time (sd). • The term z can be obtained from normal distribution tables. For a given service level of 95% z = 1,645. On the other hand, the monthly standard deviation of the demand can be calculated from the table of the monthly demand rates using the formula below. 86177 , 23 83 , 13095 23 1 ) ( 1 1 1 2        n i i d d n sd Thereafter, S = 1,645*23,86177 = 39,2526 ≈ 40 products As such, ROP = 100 + 40 = 140 To trace the inventory, we start at the replenishment level (which is EOQ + safety stock) and we draw a graph similar to that of the slides.
  • 6. Solved Problem 3 Our company manages an inventory of light bulbs. A particular lamp is bought at 10 cents. Ordering cost is 150 cents and holding cost is 20% of unit price per unit and year. The factory works 12 months per year, steady production and management requires an 80% service level for this particular item. Delivery lead time from the supplier is 1,5 months. The monthly demand over the last 24 months is as follows: 500, 500, 425, 425, 450, 425, 425, 475, 475, 425, 425, 425, 475, 525, 425, 425, 450, 475, 425, 425, 475, 450, 425, 425. Compute the following: • Economic order quantity • Reorder point
  • 7. Solved Problem 3 SOLUTION • Total demand: 10800 (sum of 24months) • Mean year demand: D = (10800)/2 = 5400 lamps per year • Mean monthly demand: d = 5400/12 = 450 lamps/month Economic Order Quantity: • EOQ = = = 900 lamps • Number of orders = D/EOQ = 5400/900 ≈ 6 orders per year • Time between orders = EOQ / D = 0,167 year or approximately ≈ 2 months H DS 2 2 , 0 10 150 5400 2   
  • 8. Solved Problem 3 Calculation of Reorder Point • ROP = Average demand during lead time + Safety Stock • The lead time L is 1,5 month. The mean monthly demand d is 450. Therefore, the average demand during lead time is d*L = 675.
  • 9. Solved Problem 3 We also need to determine the safety stock S. The formula for the safety stock is S = z * standard deviation of the demand during lead time (sd). The term z can be obtained from normal distribution tables. For a given service level of 80% z = 0,84. On the other hand, the monthly standard deviation of the demand can be calculated from the table of the monthly demand rates using the formula below. • Thereafter, S = 0,84*sd* = 31,70 ≈ 32 lamps • As such, ROP = 900 + 32 = 932 82134 , 30 ) ( 1 1 1 2       n i i d d n sd
  • 10. Solved Problem 4 Grey Wolf Lodge is a popular 500-room hotel in the North Woods. Managers need to keep close tabs on all room service items, including a special pine-scented bar soap. The daily demand for the soap is 275 bars, with a standard deviation of 30 bars. Ordering cost is $10 and the inventory holding cost is $0.30/bar/year. The lead time from the supplier is 5 days, with a standard deviation of 1 day. The lodge is open 365 days a year. a. What is the economic order quantity for the bar of soap? b. What should the reorder point be for the bar of soap if management wants to have a 99 percent cycle-service level? c. What is the total annual cost for the bar of soap, assuming a Q system will be used?
  • 11. Solved Problem 4 SOLUTION a. We have D = (275)(365) = 100,375 bars of soap; S = $10; and H = $0.30. The EOQ for the bar of soap is EOQ = = 2DS H 2(100,375)($10) $0.30 = 6,691,666.7 = 2,586.83 or 2,587 bars
  • 12. Solved Problem 4 b. We have d = 275 bars/day, σd = 30 bars, L = 5 days, and σLT = 1 day. σdLT = Lσd 2 + d2σLT 2 = (5)(30)2 + (275)2(1)2 = 283.06 bars Consult the body of the Normal Distribution appendix for 0.9900. The closest value is 0.9901, which corresponds to a z value of 2.33. We calculate the safety stock and reorder point as follows: Safety stock = zσdLT = (2.33)(283.06) = 659.53 or 660 bars Reorder point = dL + Safety stock = (275)(5) + 660 = 2,035 bars
  • 13. Solved Problem 4 c. The total annual cost for the Q system is C = (H) + (S) + (H)(Safety stock) Q 2 D Q C = ($0.30) + ($10) + ($0.30)(660) = $974.05 2,587 2 100,375 2,587
  • 14. Solved Problem 5 ABC Classification: Example 1 $ 60 90 2 350 40 3 30 130 4 80 60 5 30 100 6 20 180 7 10 170 8 320 50 9 510 60 10 20 120 PART UNIT COST ANNUAL USAGE
  • 15. Solved Problem 5 ABC Classification: Example (cont.) Example 10.1 1 $ 60 90 2 350 40 3 30 130 4 80 60 5 30 100 6 20 180 7 10 170 8 320 50 9 510 60 10 20 120 PART UNIT COST ANNUAL USAGE TOTAL % OF TOTAL % OF TOTAL PART VALUE VALUE QUANTITY % CUMMULATIVE 9 $30,600 35.9 6.0 6.0 8 16,000 18.7 5.0 11.0 2 14,000 16.4 4.0 15.0 1 5,400 6.3 9.0 24.0 4 4,800 5.6 6.0 30.0 3 3,900 4.6 10.0 40.0 6 3,600 4.2 18.0 58.0 5 3,000 3.5 13.0 71.0 10 2,400 2.8 12.0 83.0 7 1,700 2.0 17.0 100.0 $85,400 A B C % OF TOTAL % OF TOTAL CLASS ITEMS VALUE QUANTITY A 9, 8, 2 71.0 15.0 B 1, 4, 3 16.5 25.0 C 6, 5, 10, 7 12.5 60.0