Download as PDF, PPTX

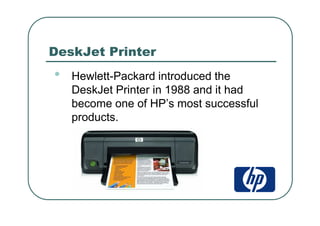
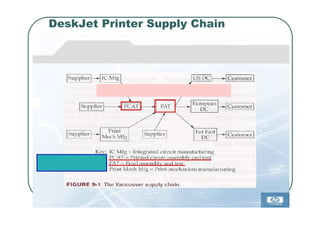
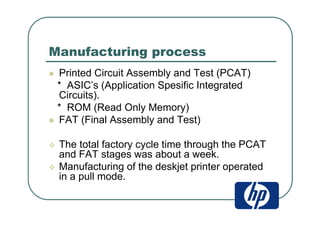
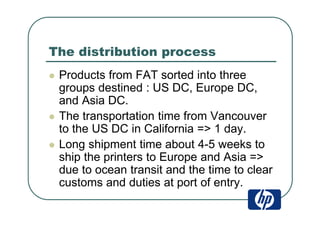
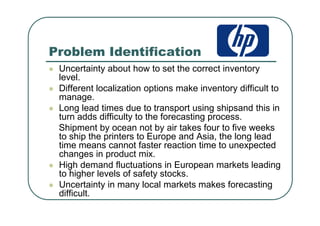
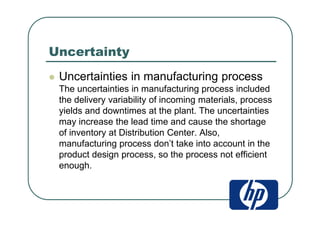


Hewlett Packard introduced the successful DeskJet printer in 1988. The supply chain for the DeskJet printer involved manufacturing the printers through printed circuit assembly and testing, then distributing them to distribution centers in the US, Europe, and Asia. Long transportation times of 4-5 weeks by ocean to Europe and Asia caused difficulties in forecasting demand and reacting quickly to changes. Recommendations included improving forecasting, reducing lead times through air freight or new plants, implementing ERP systems, and using multiple facility locations.


