


![“EMPHERICAL TESTING OF CAPM”
3.01 INDUSTRY SCENARIO:
A. INTRODUCTION:
Basically, Securities markets provide a channel for allocation of savings by an individual
or an organization to those who have a productive need for them. So, a security market
can be said a location where the savers meet the real investors who need the fund. The
savers and investors are constrained by the economy’s abilities to invest and save
respectively which thus helps market in enhancing savings and investment in the
economy. Stock Market is therefore affected by the dynamics of the economic, political,
cultural and environmental activities within the country and rest of the world.
A stock market is a public market for the trading of company stock and derivatives at
an agreed price; these are securities listed on a stock exchange as well as those only
traded privately. The size of the world stock market was estimated at about $36.6 trillion
[1]
US at the beginning of October 2008. The total world derivatives market has been
[2]
estimated at about $791 trillion face or nominal value, 11 times the size of the entire
[3]
world economy. The value of the derivatives market, because it is stated in terms of
notional values, cannot be directly compared to a stock or a fixed income security, which
traditionally refers to an actual value. Moreover, the vast majority of derivatives 'cancel'
each other out (i.e., a derivative 'bet' on an event occurring is offset by a comparable
derivative 'bet' on the event not occurring.). Many such relatively illiquid securities are
valued as marked to model, rather than an actual market price.
B. BRIEF HISTORY:
HRIHE, HASSAN Page 30](https://image.slidesharecdn.com/astudyonemphericaltestingofcapitalassetpricingmodel-100924143213-phpapp02/75/A-study-on-empherical-testing-of-capital-asset-pricing-model-30-2048.jpg)


![“EMPHERICAL TESTING OF CAPM”
OVERVIEW OF WIPRO TECHNOLOGIES LTD:
An INDUSTRY (from Latin industries, "diligent, industrious") is the
manufacturing of a good or service within a category.[1] Although industry is a broad term
for any kind of economic production, in economics and urban planning industry is a
synonym for the secondary sector, which is a type of economic activity involved in the
manufacturing of raw materials into goods and products.[1]
There are four key industrial economic sectors: the primary sector, largely raw
material extraction industries such as mining and farming; the secondary sector,
involving refining, construction, and manufacturing; the tertiary sector, which deals with
services (such as law and medicine) and distribution of manufactured goods; and the
quaternary sector, a relatively new type of knowledge industry focusing on technological
research, design and development such as computer programming, and biochemistry. A
fifth quandary sector has been proposed encompassing nonprofit activities. The economy
is also broadly separated into public sector and private sector, with industry generally
categorized as private. Industries are also any business or manufacturing.
Industry in the sense of manufacturing became a key sector of production and
labor in European and North American countries during the Industrial Revolution, which
upset previous mercantile and feudal economies through many successive rapid advances
in technology, such as the steel and coal production. It is aided by technological
advances, and has continued to develop into new types and sectors to this day. Industrial
countries then assumed a capitalist economic policy. Railroads and steam-powered ships
began speedily establishing links with previously unreachable world markets, enabling
private companies to develop to then-unheard of size and wealth. Following the Industrial
Revolution, perhaps a third of the world's economic output is derived from manufacturing
industries—more than agriculture's share.
Many developed countries (for example the UK, the U.S., and Canada) and many
developing/semi-developed countries (People's Republic of China, India etc.) depend
significantly on industry. Industries, the countries they reside in, and the economies of
those countries are interlinked in a complex web of interdependence.
HRIHE, HASSAN Page 59](https://image.slidesharecdn.com/astudyonemphericaltestingofcapitalassetpricingmodel-100924143213-phpapp02/75/A-study-on-empherical-testing-of-capital-asset-pricing-model-59-2048.jpg)
![“EMPHERICAL TESTING OF CAPM”
CALCULATIONS OF EXPECTED RETURN:
Rj = Rf + β ∗ [E(Rm) - Rf]
Rf = 6%
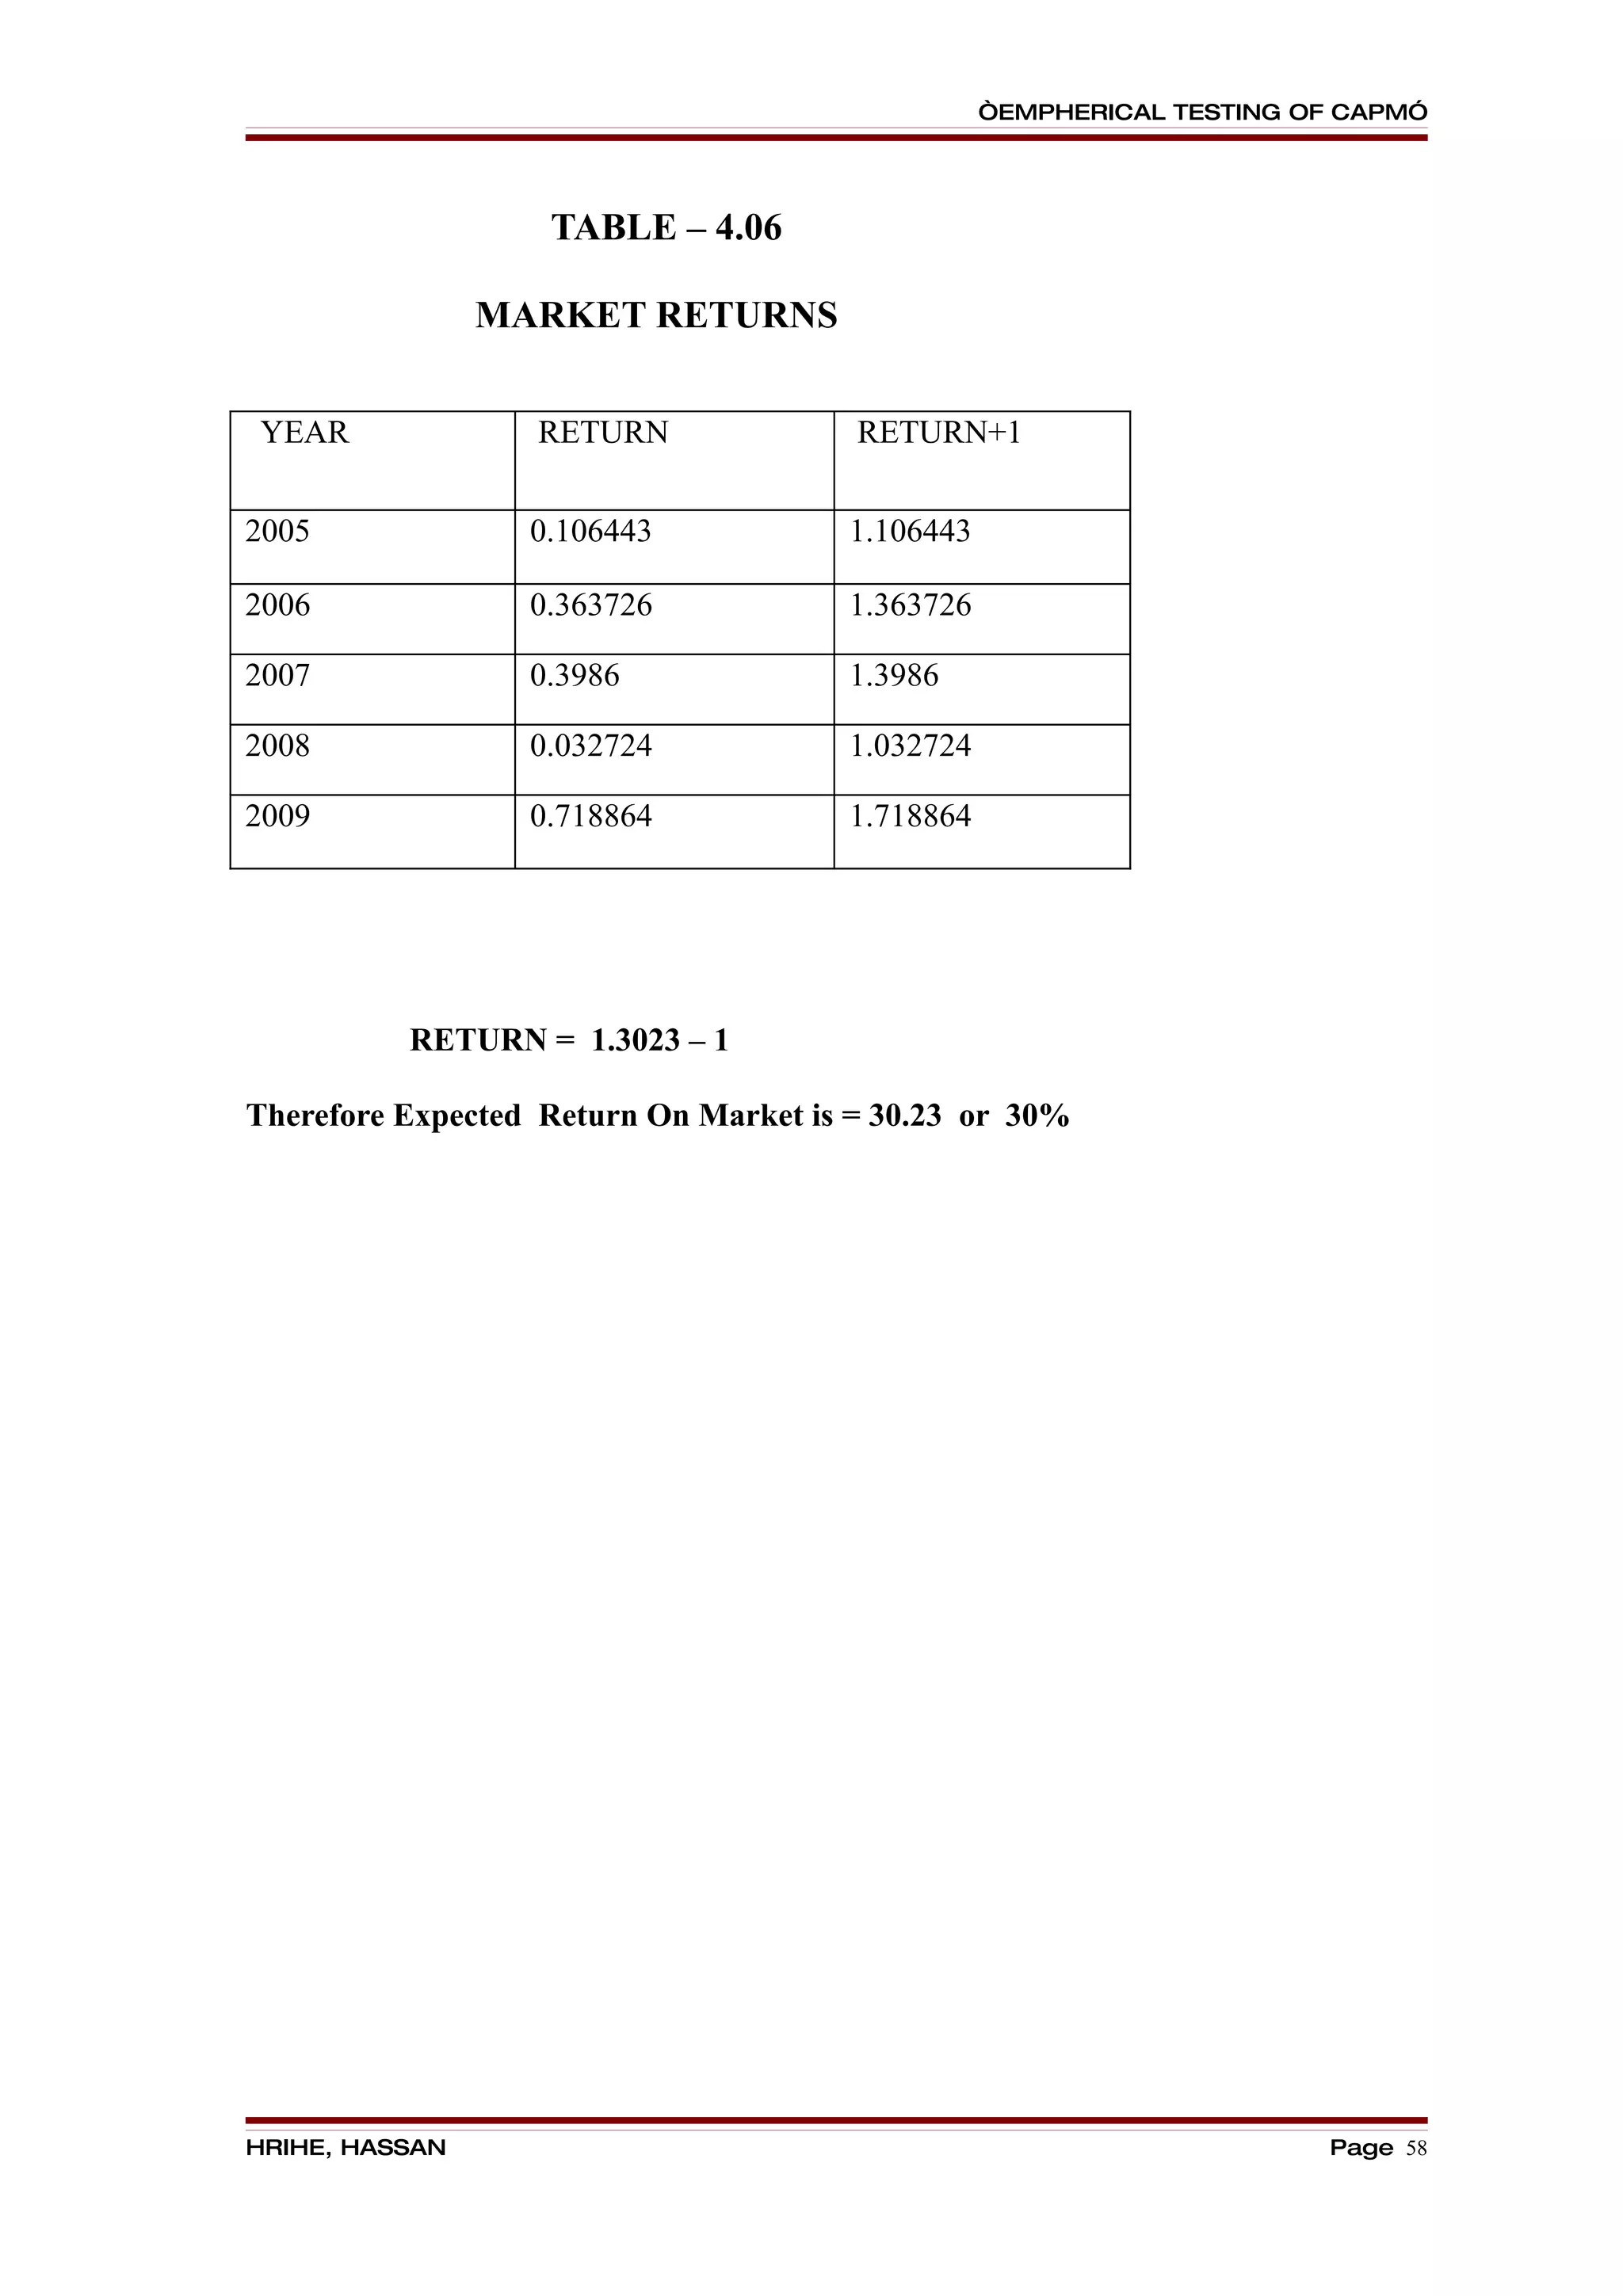
E(Rm) = 30%
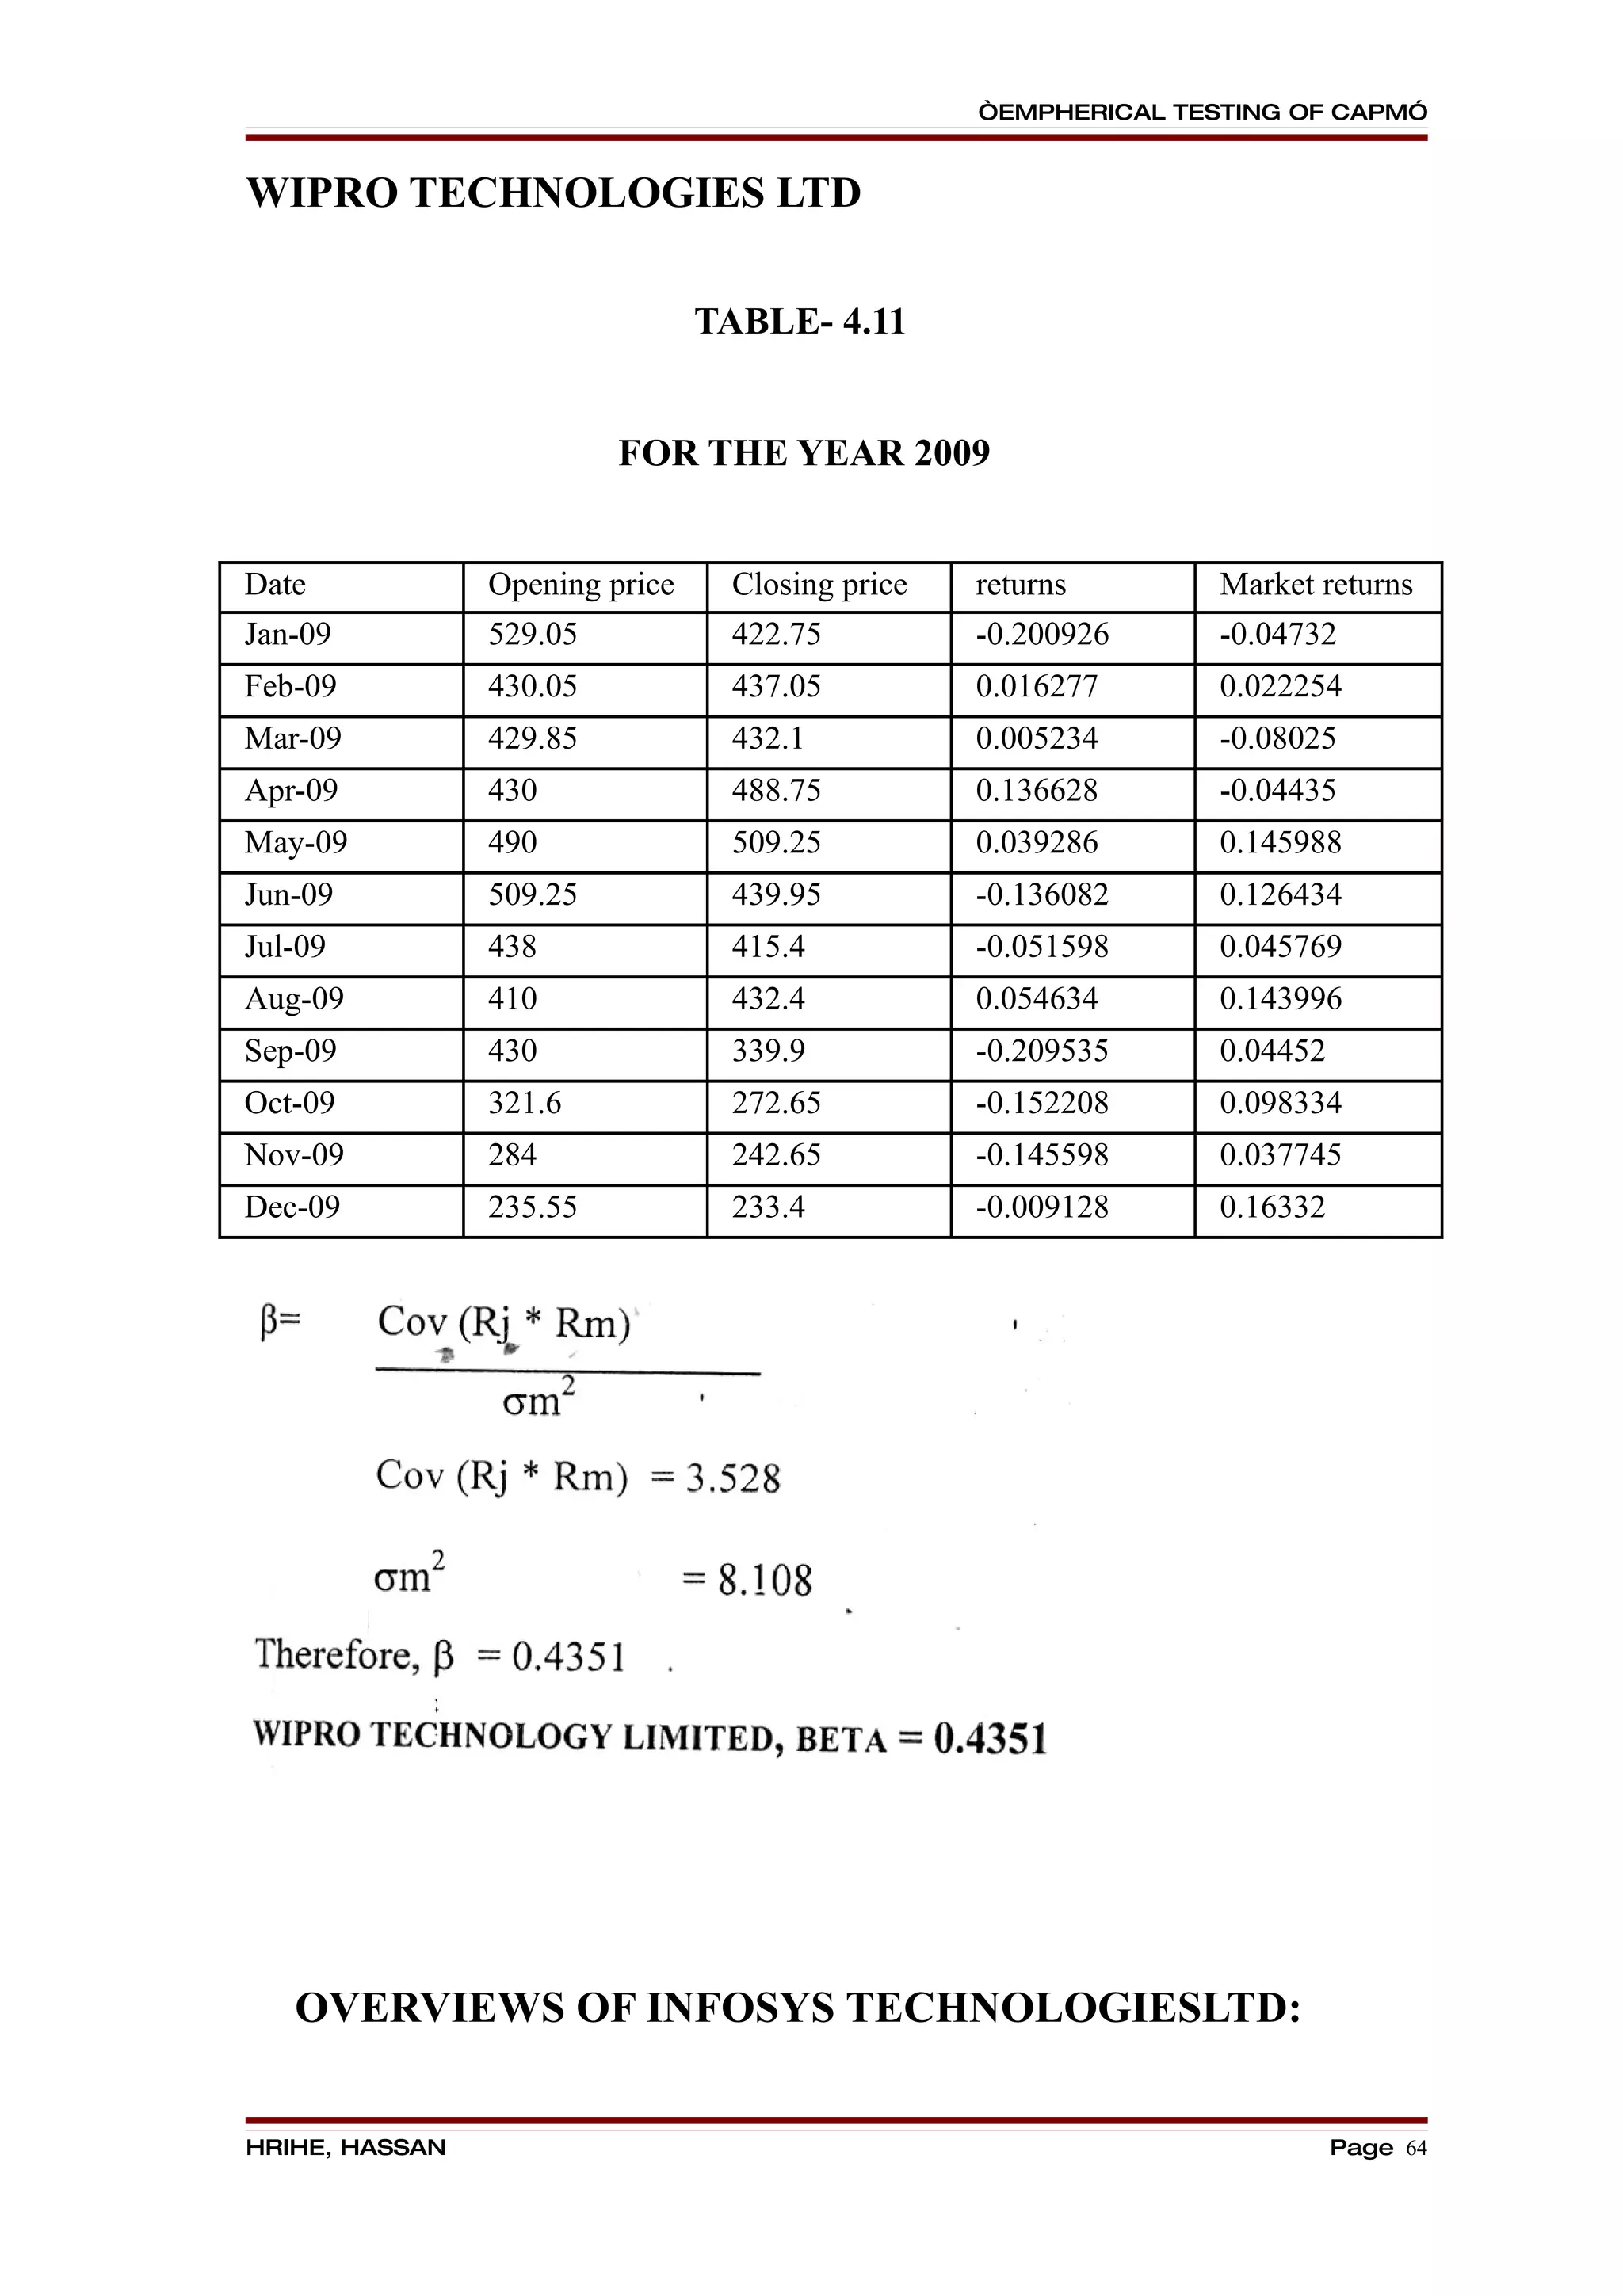
A) WIPRO TECHNOLOGIES LIMITED:
Rj = Rf + β ∗ [E(Rm) - Rf]
= 6 + 0.4351 ∗ [30-6]
= 6 + 0.4351 ∗ [ 24]
= 6 + 10.4424
= 16.4424
Therefore, Wipro Expected Return = 16.4424
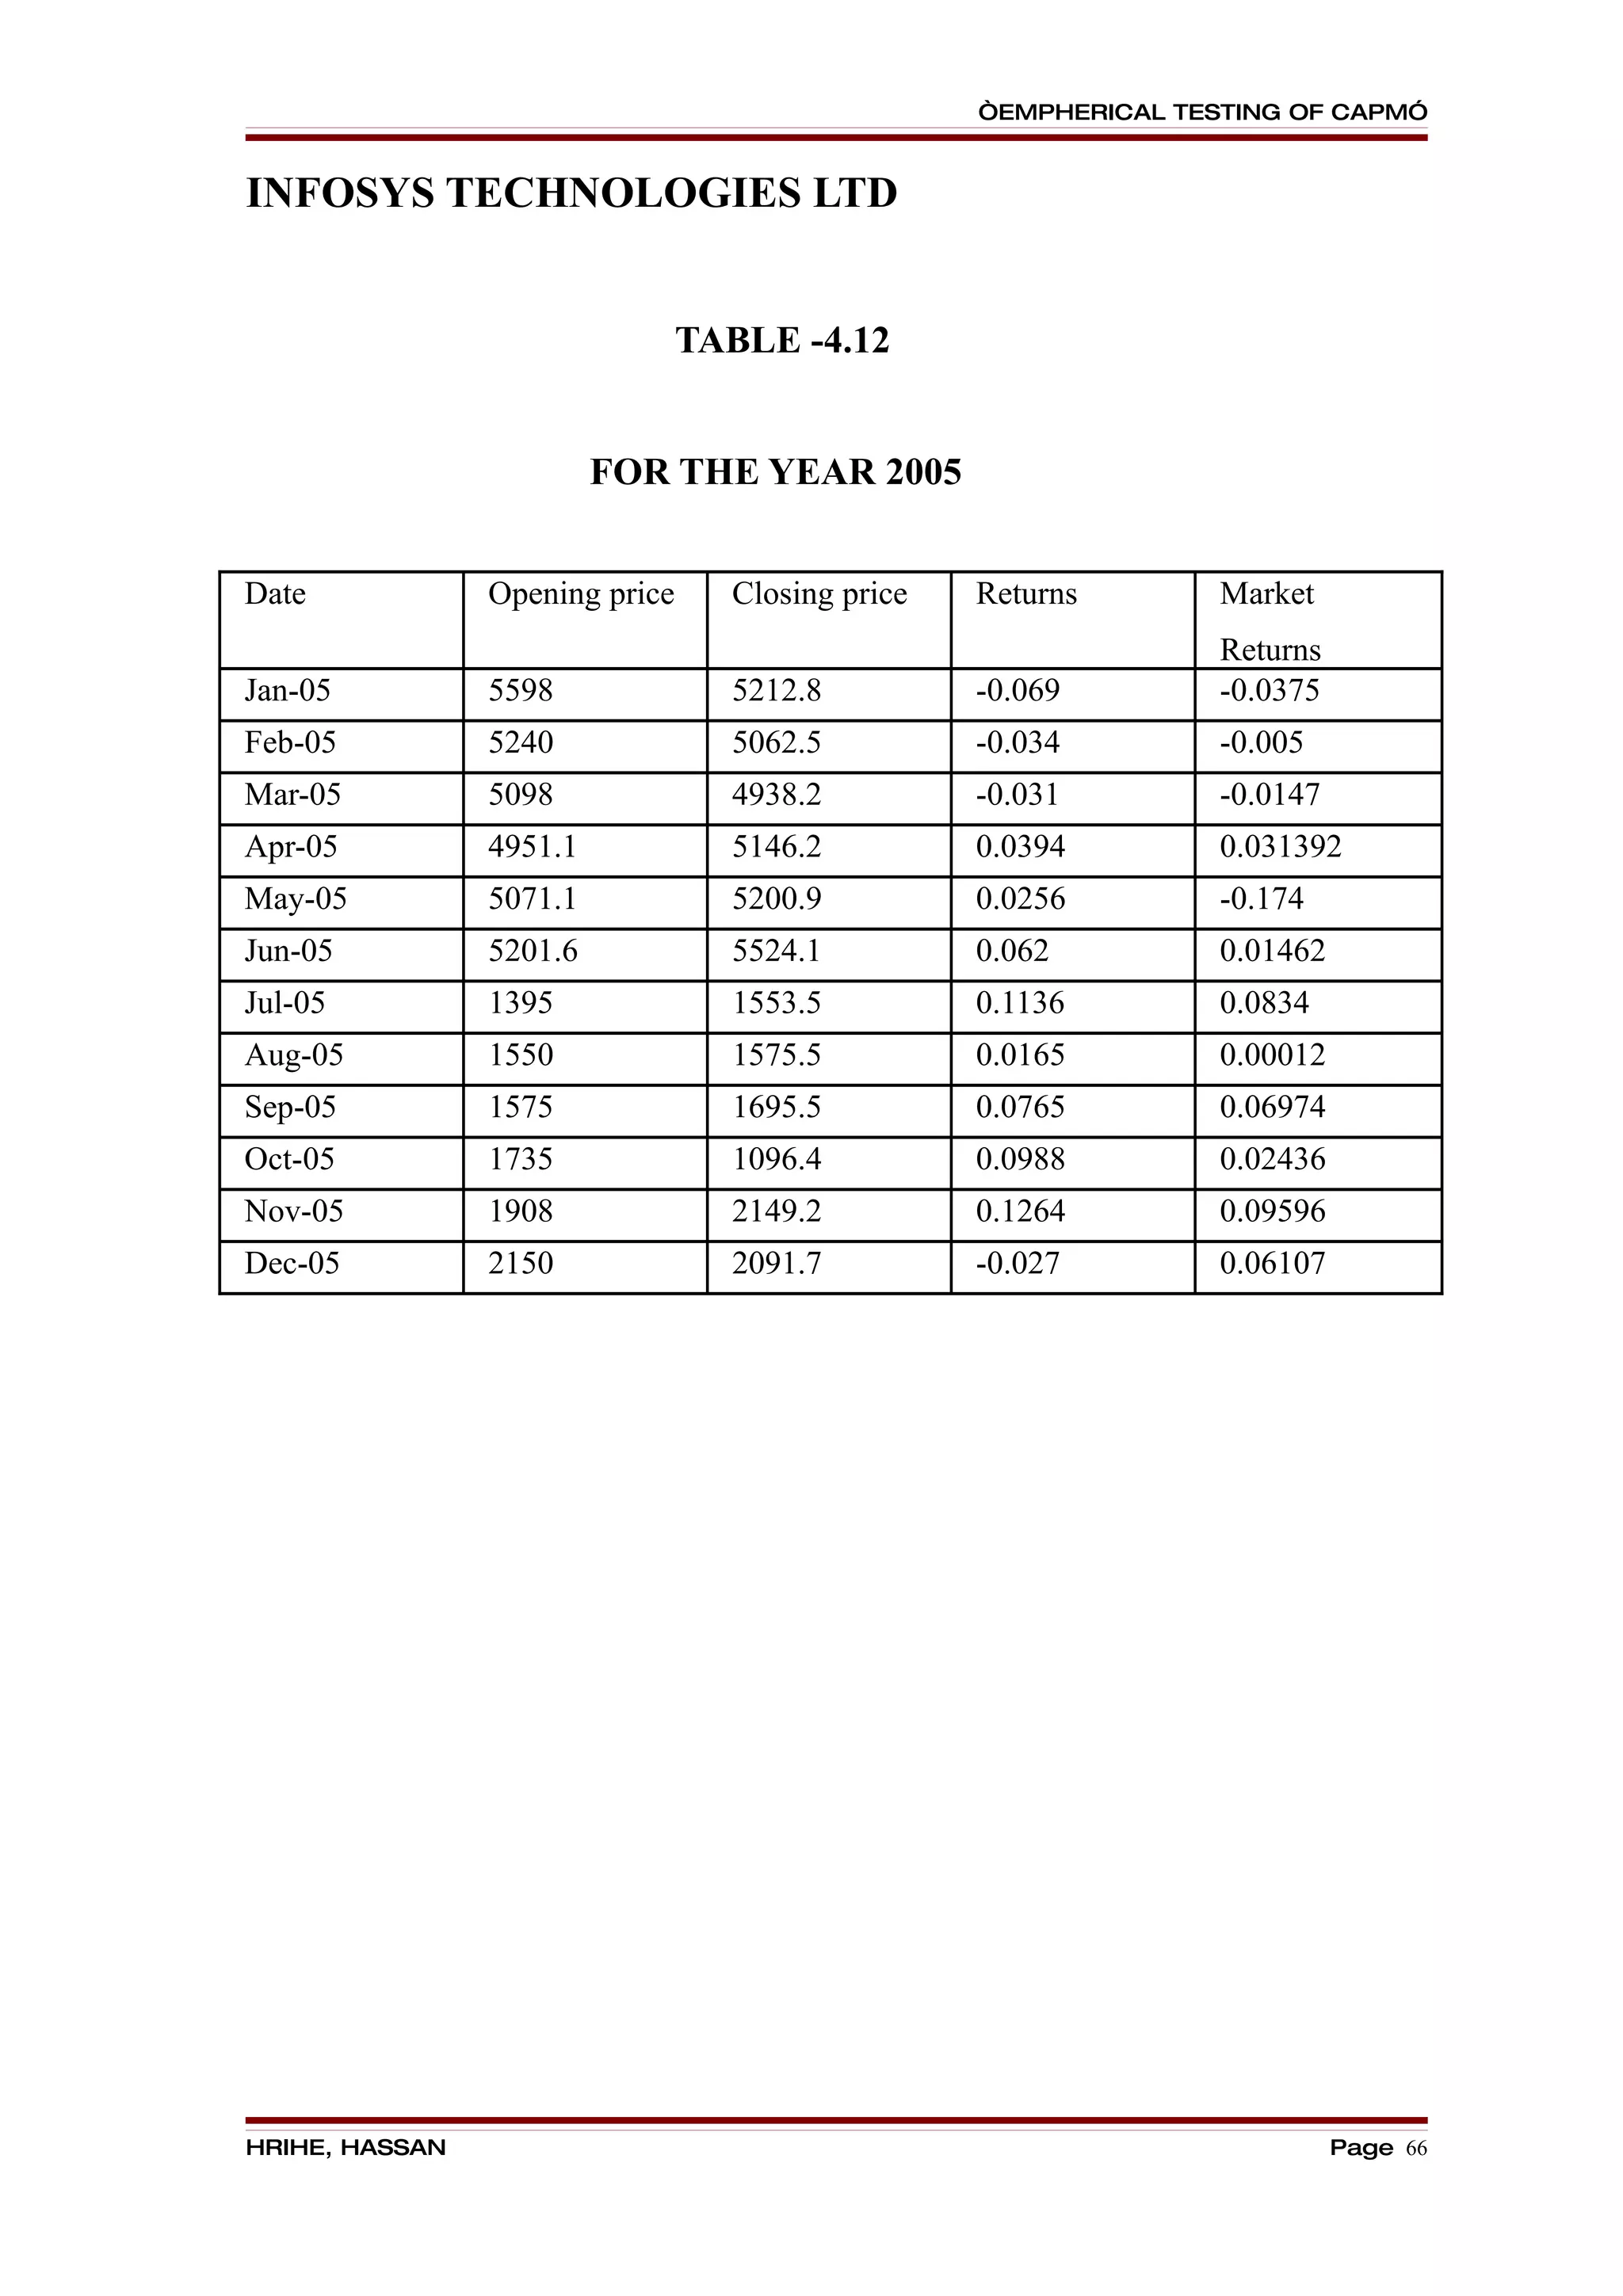
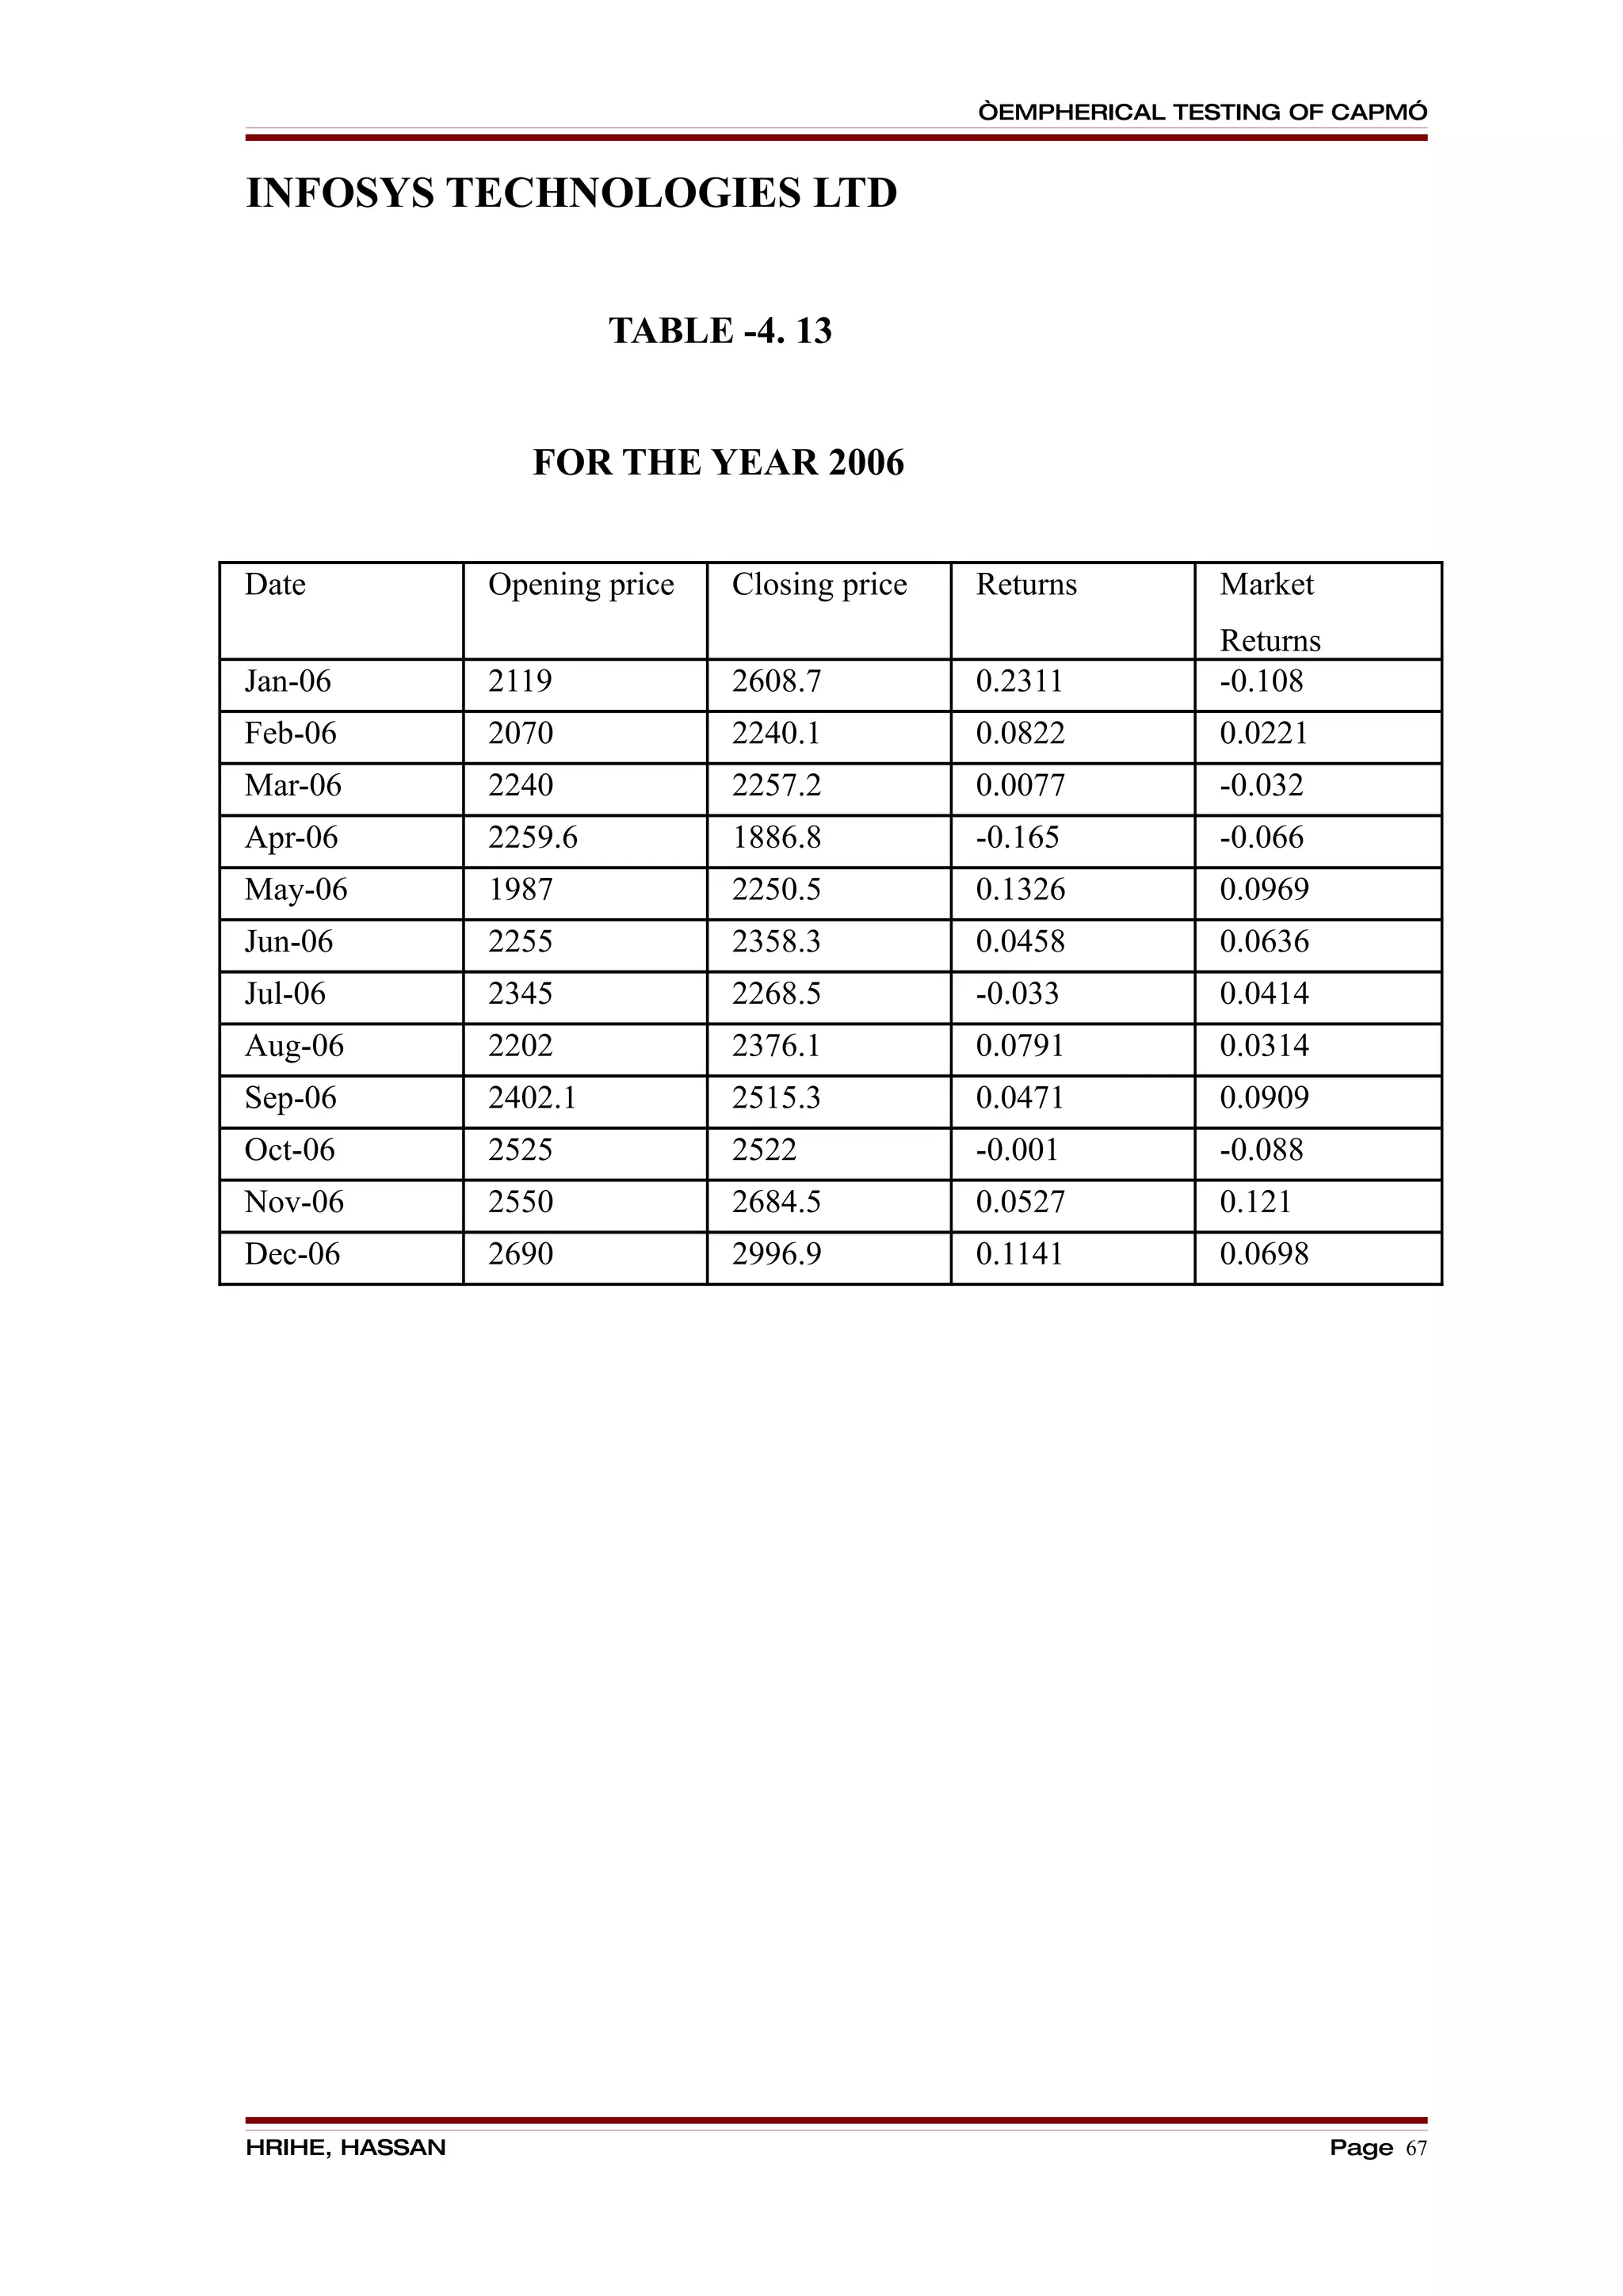
B) INFOSYS TECHNOLOGIES LTD:
Rj = Rf + β ∗ [E(Rm) - Rf]
= 6 + 0.5628 ∗ [30-6]
= 6 + 0.5628 ∗ [ 24]
= 6 + 13.5072
= 19.5072
Therefore, Infosys Expected Return = 19.5702
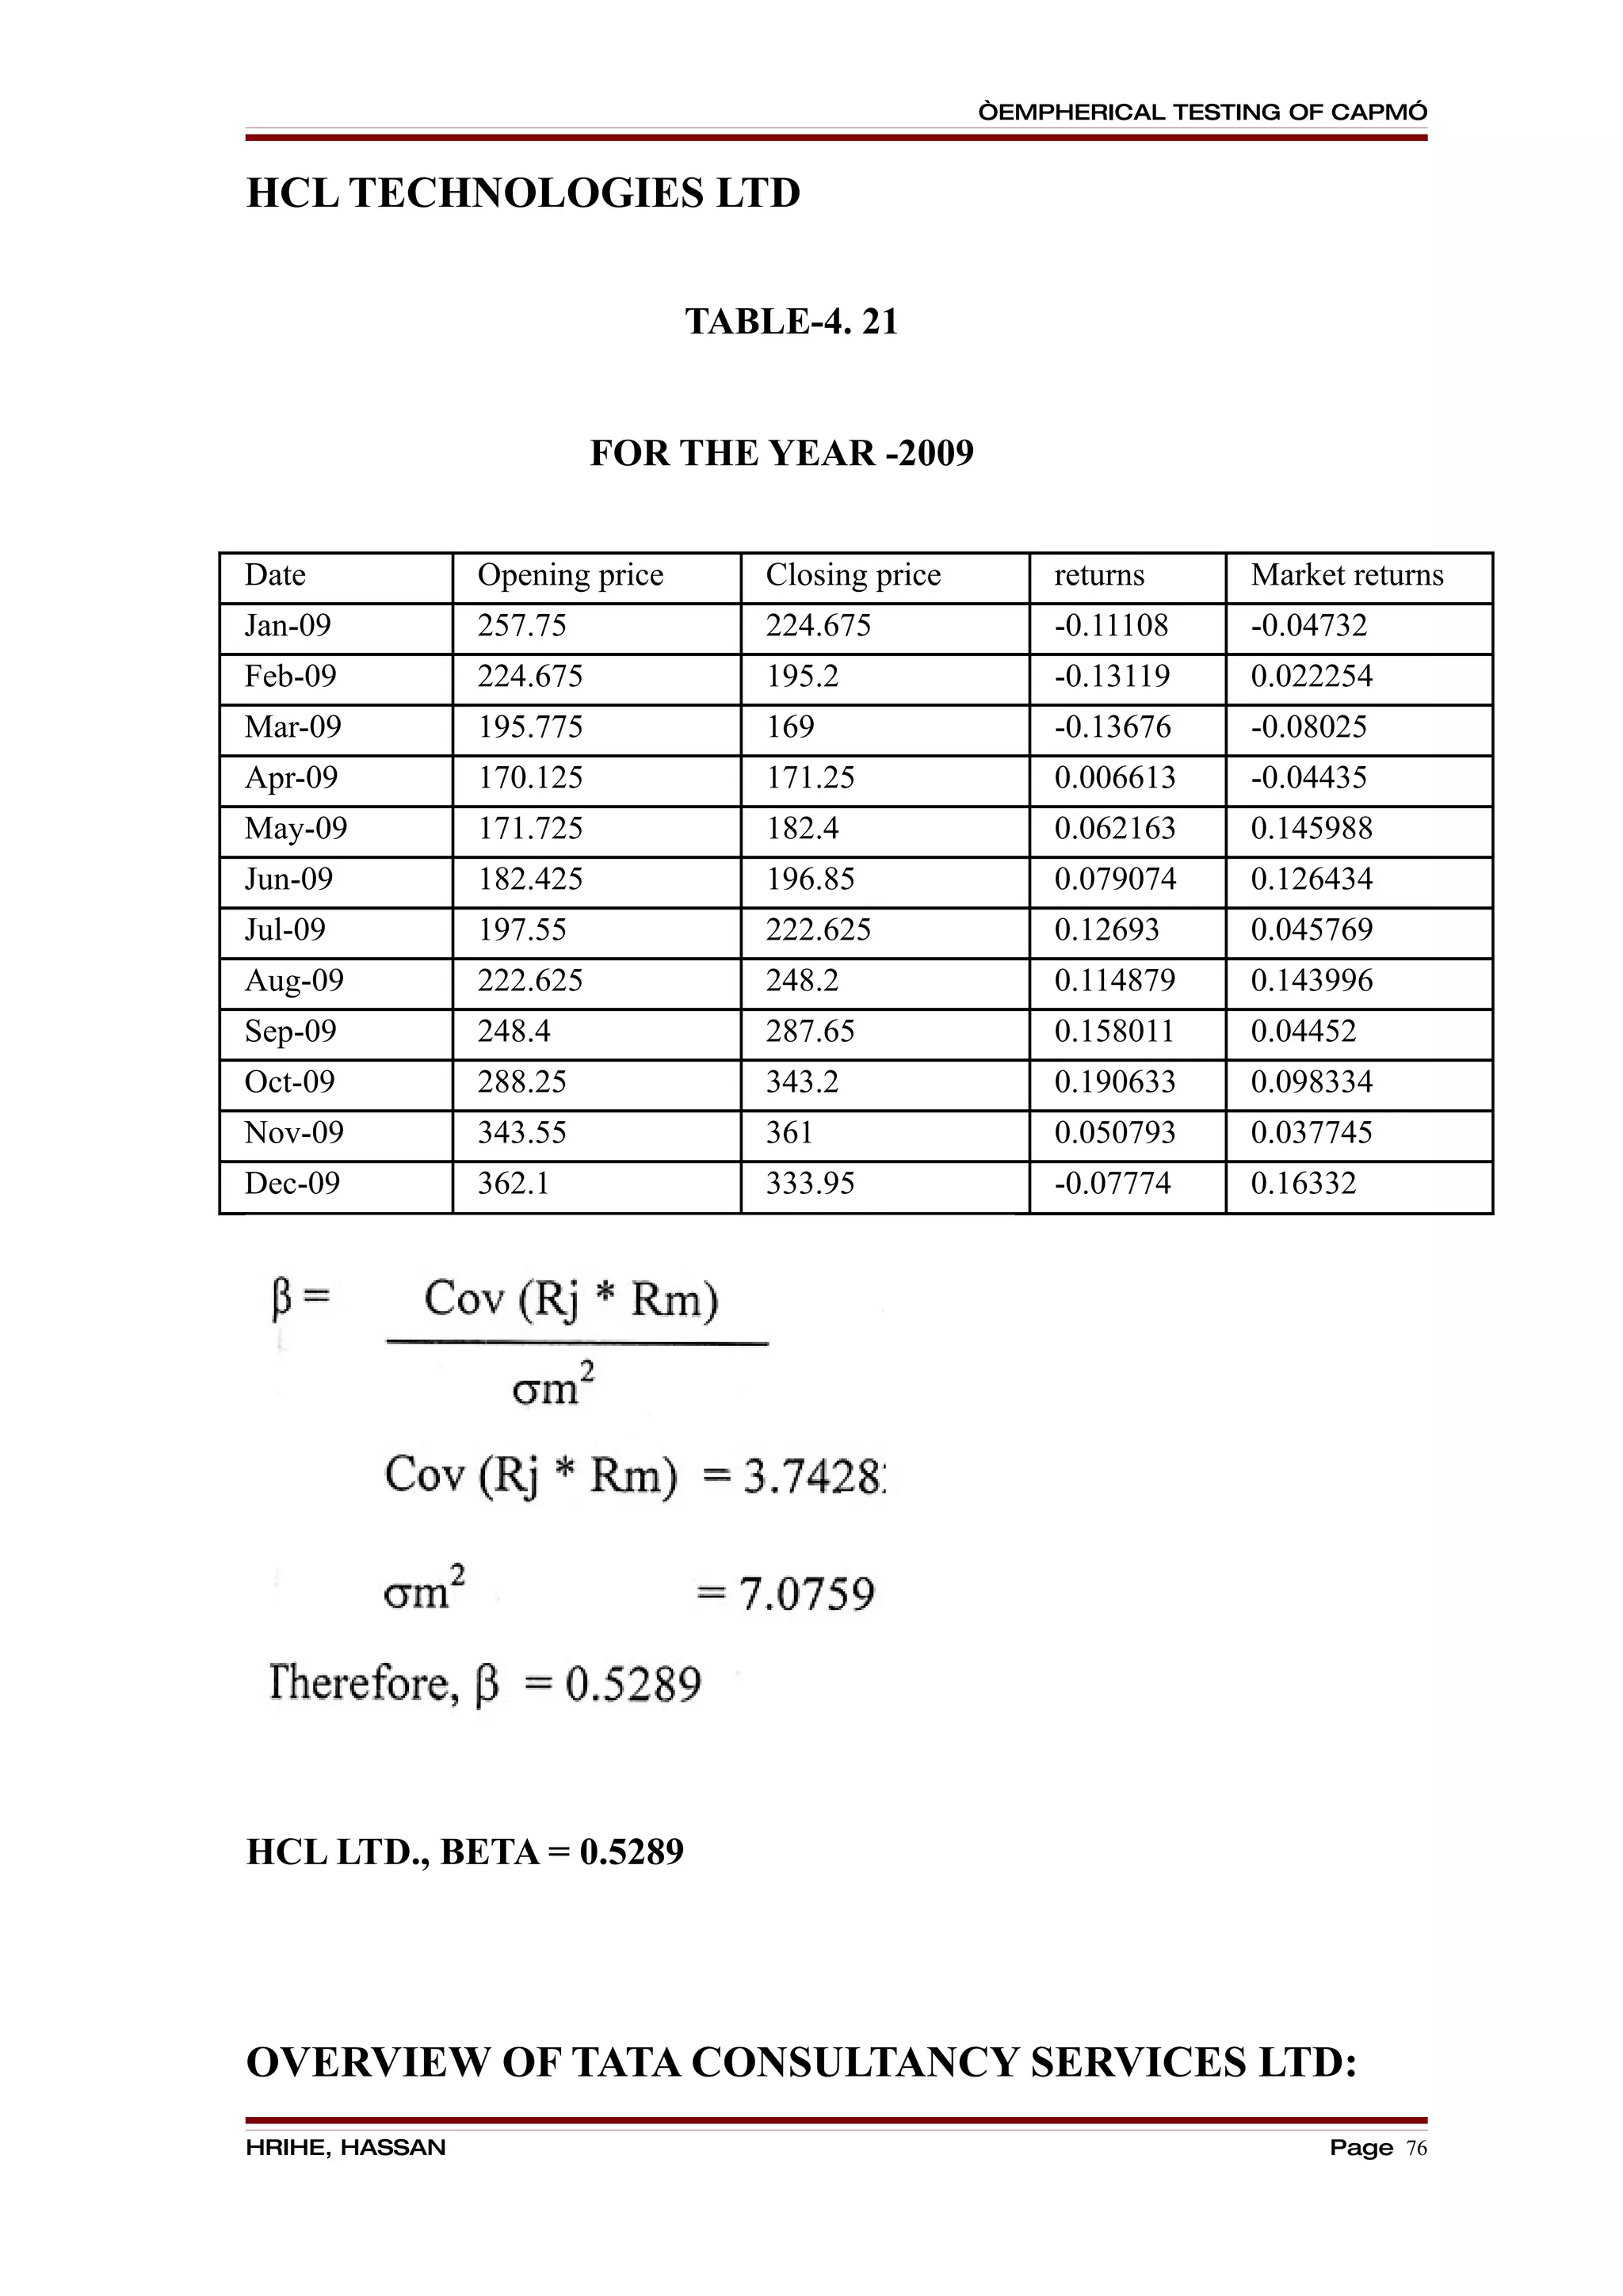
C) HCL TECHNOLOGIES LTD:
Rj = Rf + β ∗ [E(Rm) - Rf]
= 6 + 0.5289 ∗ [30-6]
= 6 + 0.5289 ∗ [ 24]
= 6 + 12.672
= 18.672
Therefore, HCL TECH Expected return = 18.67
HRIHE, HASSAN Page 83](https://image.slidesharecdn.com/astudyonemphericaltestingofcapitalassetpricingmodel-100924143213-phpapp02/75/A-study-on-empherical-testing-of-capital-asset-pricing-model-83-2048.jpg)
![“EMPHERICAL TESTING OF CAPM”
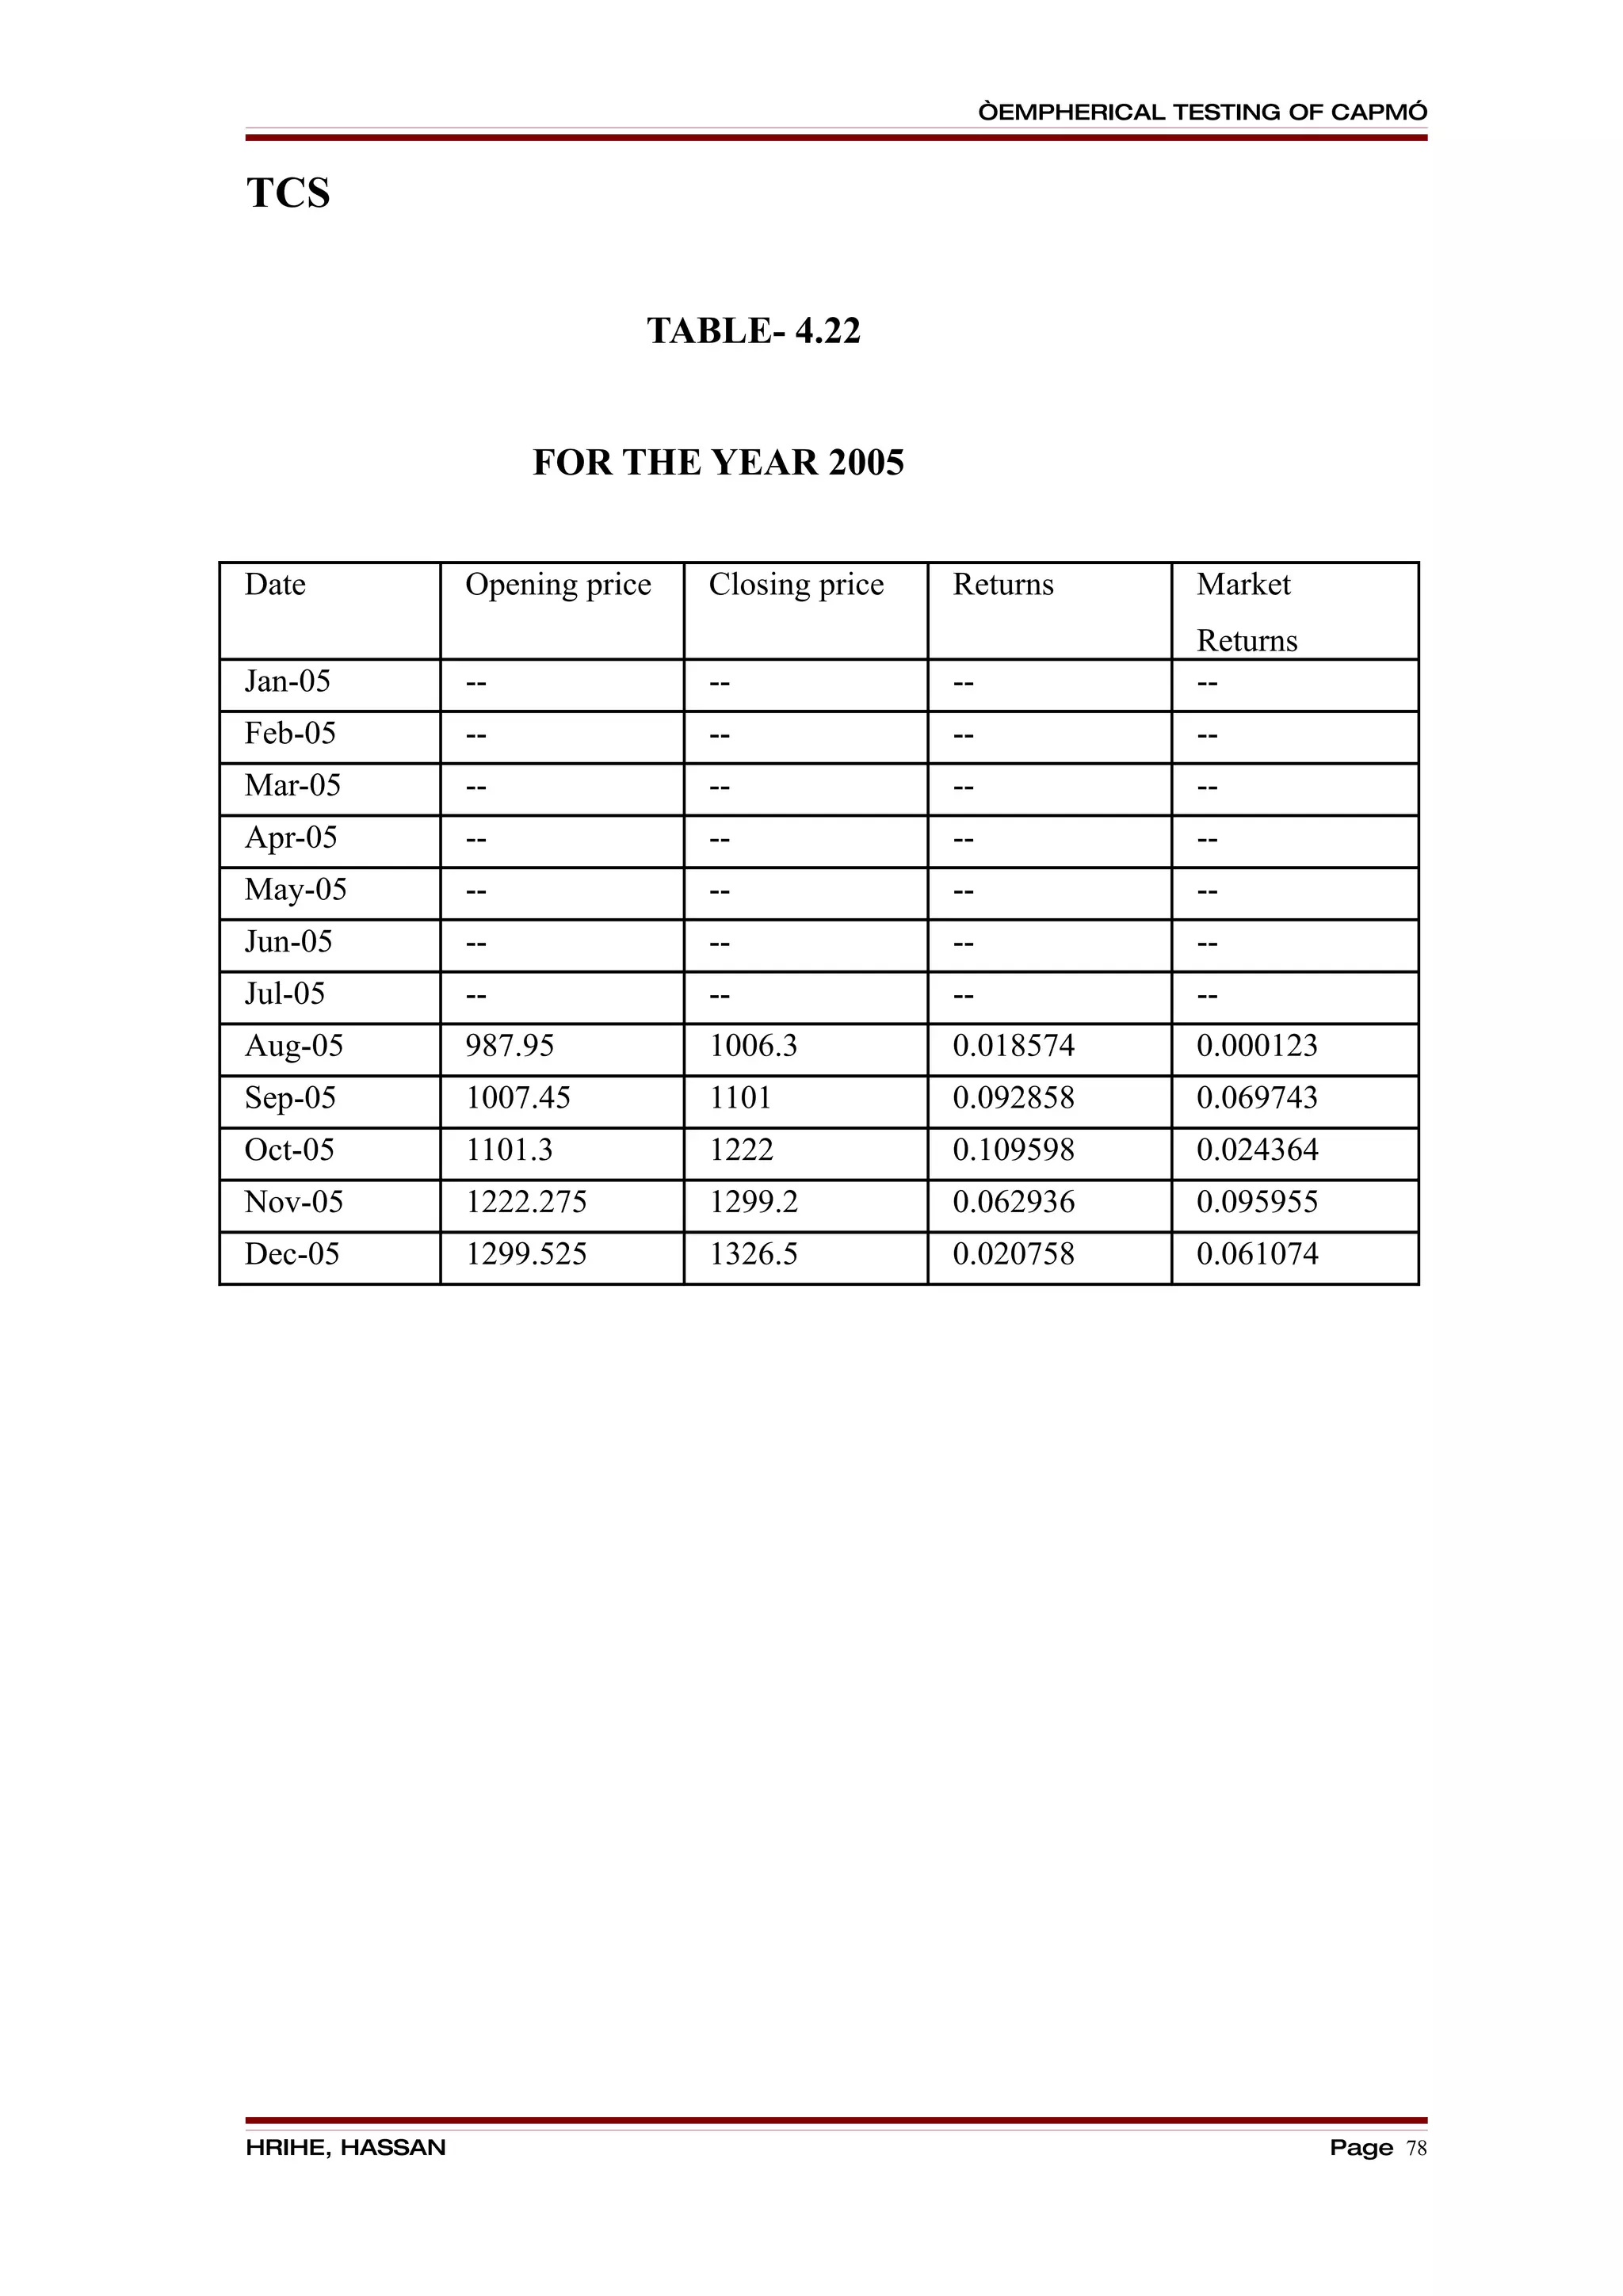
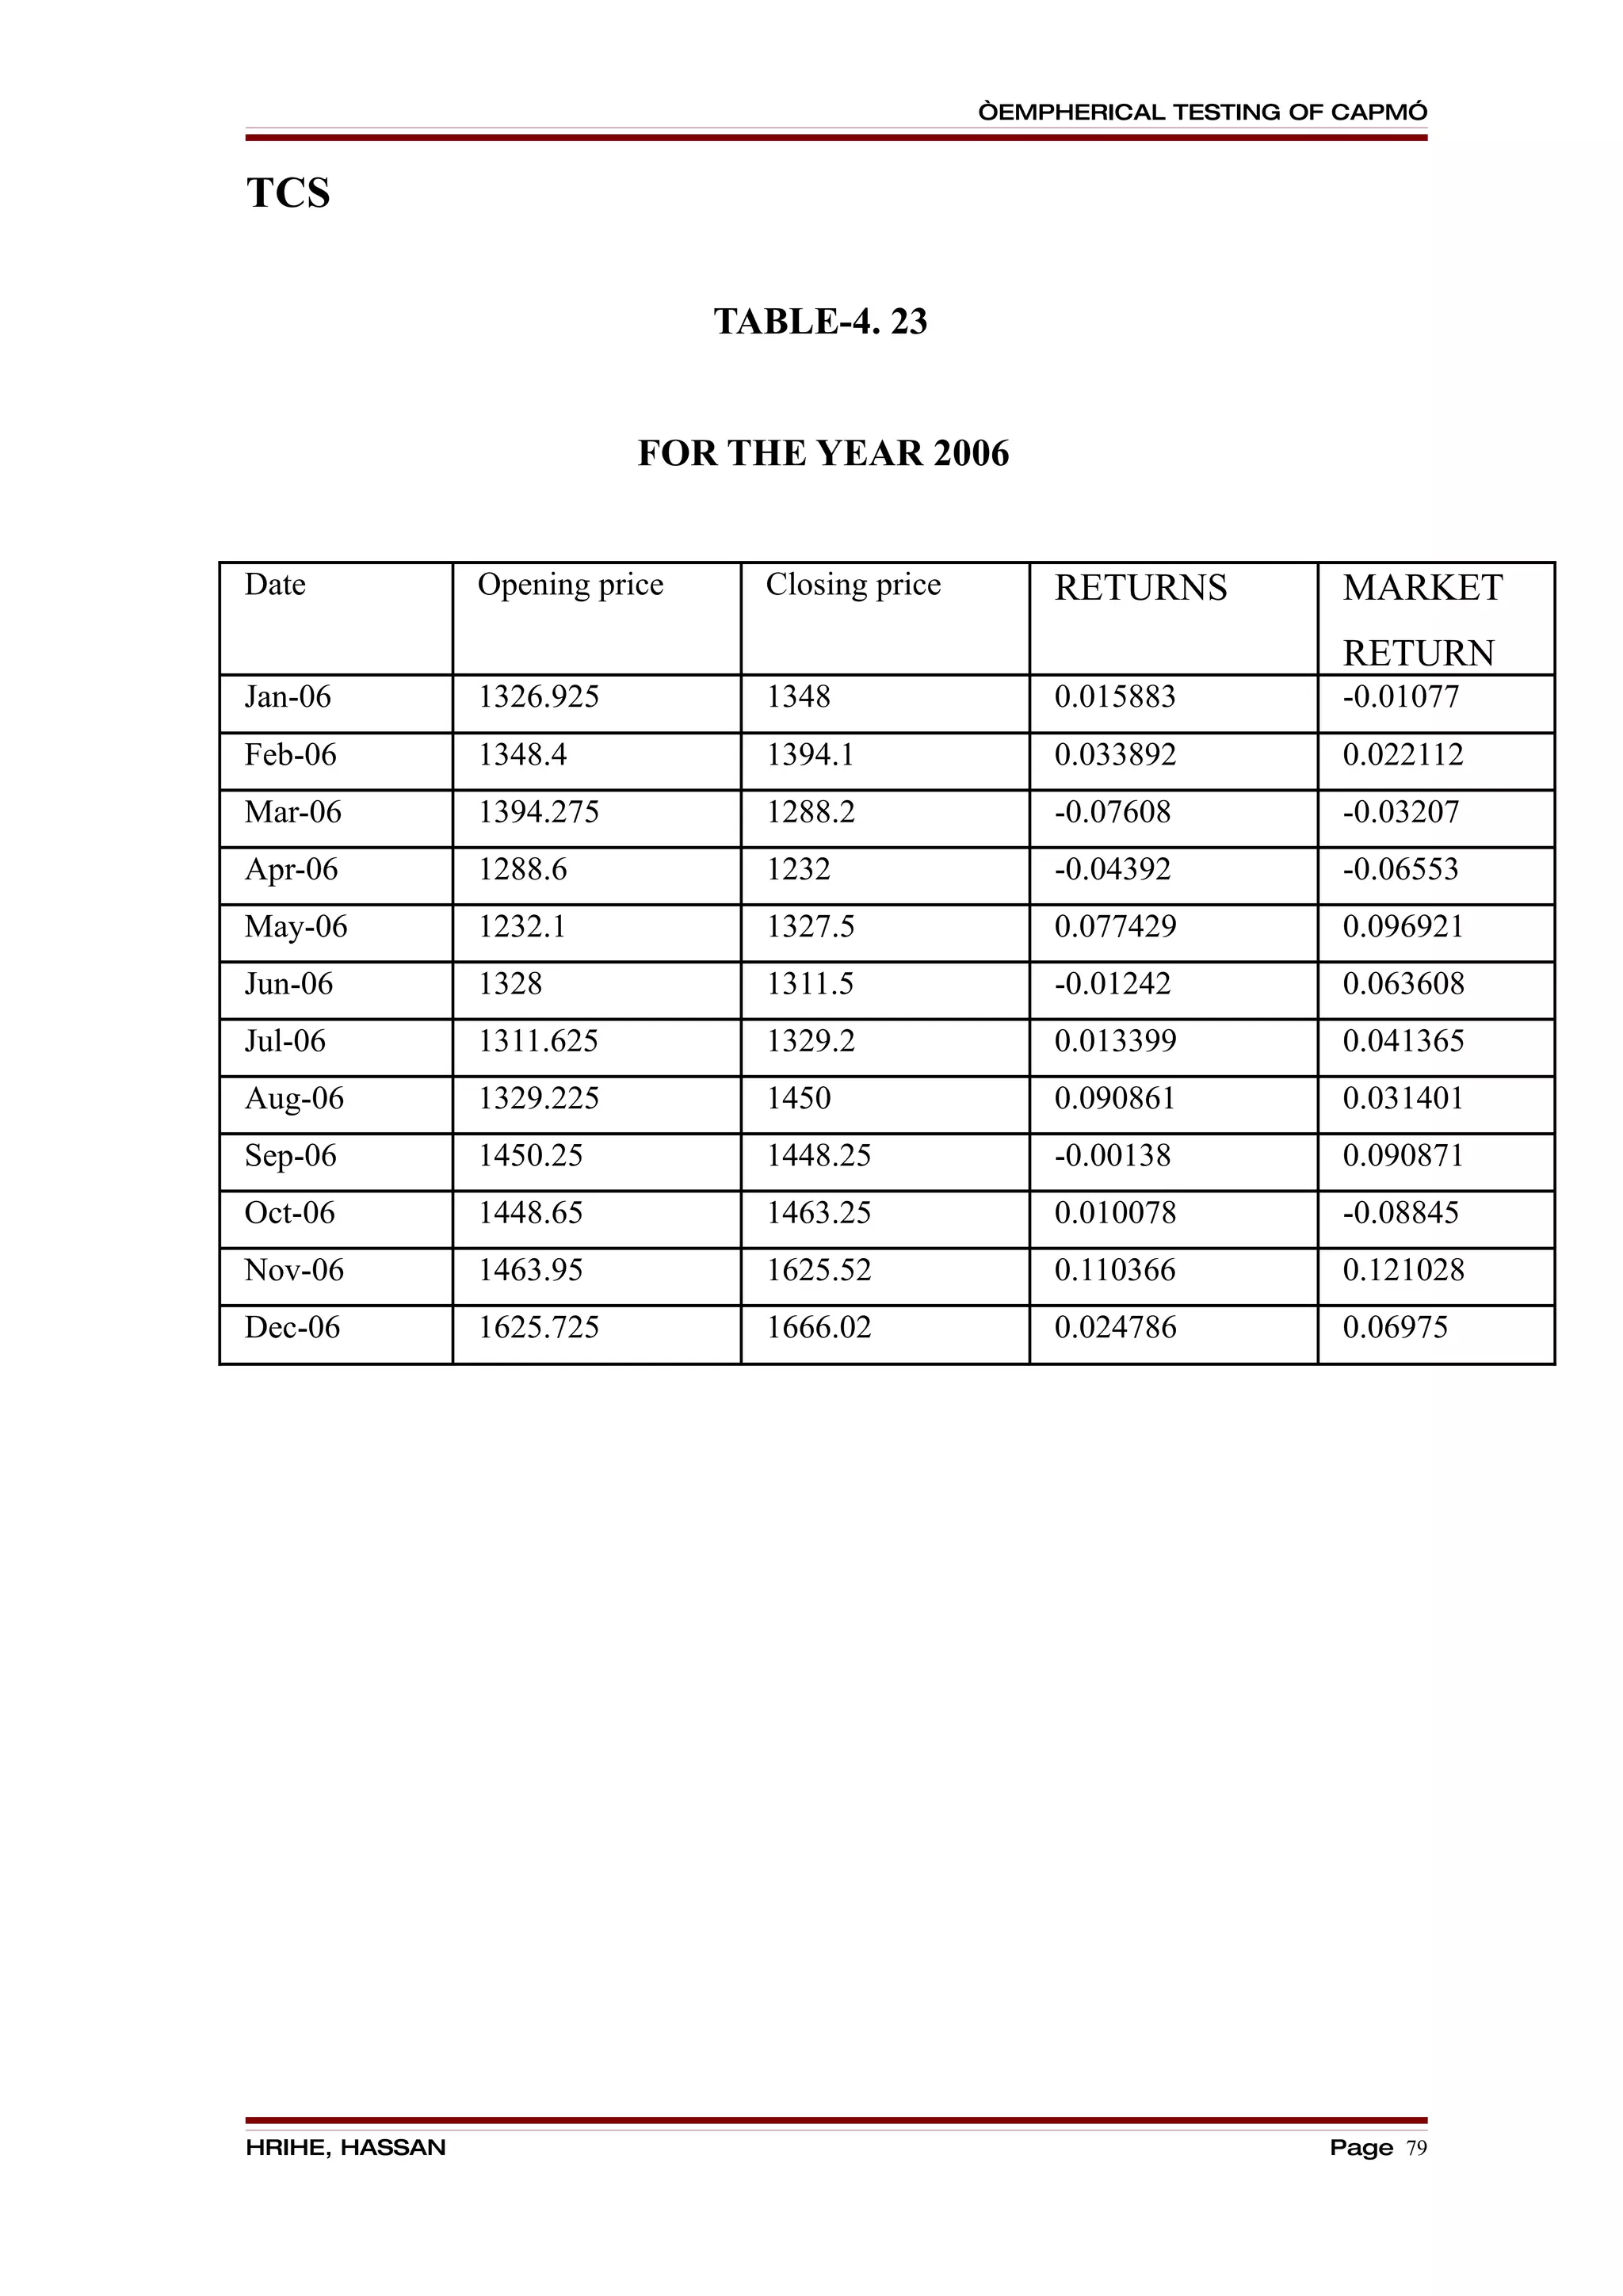
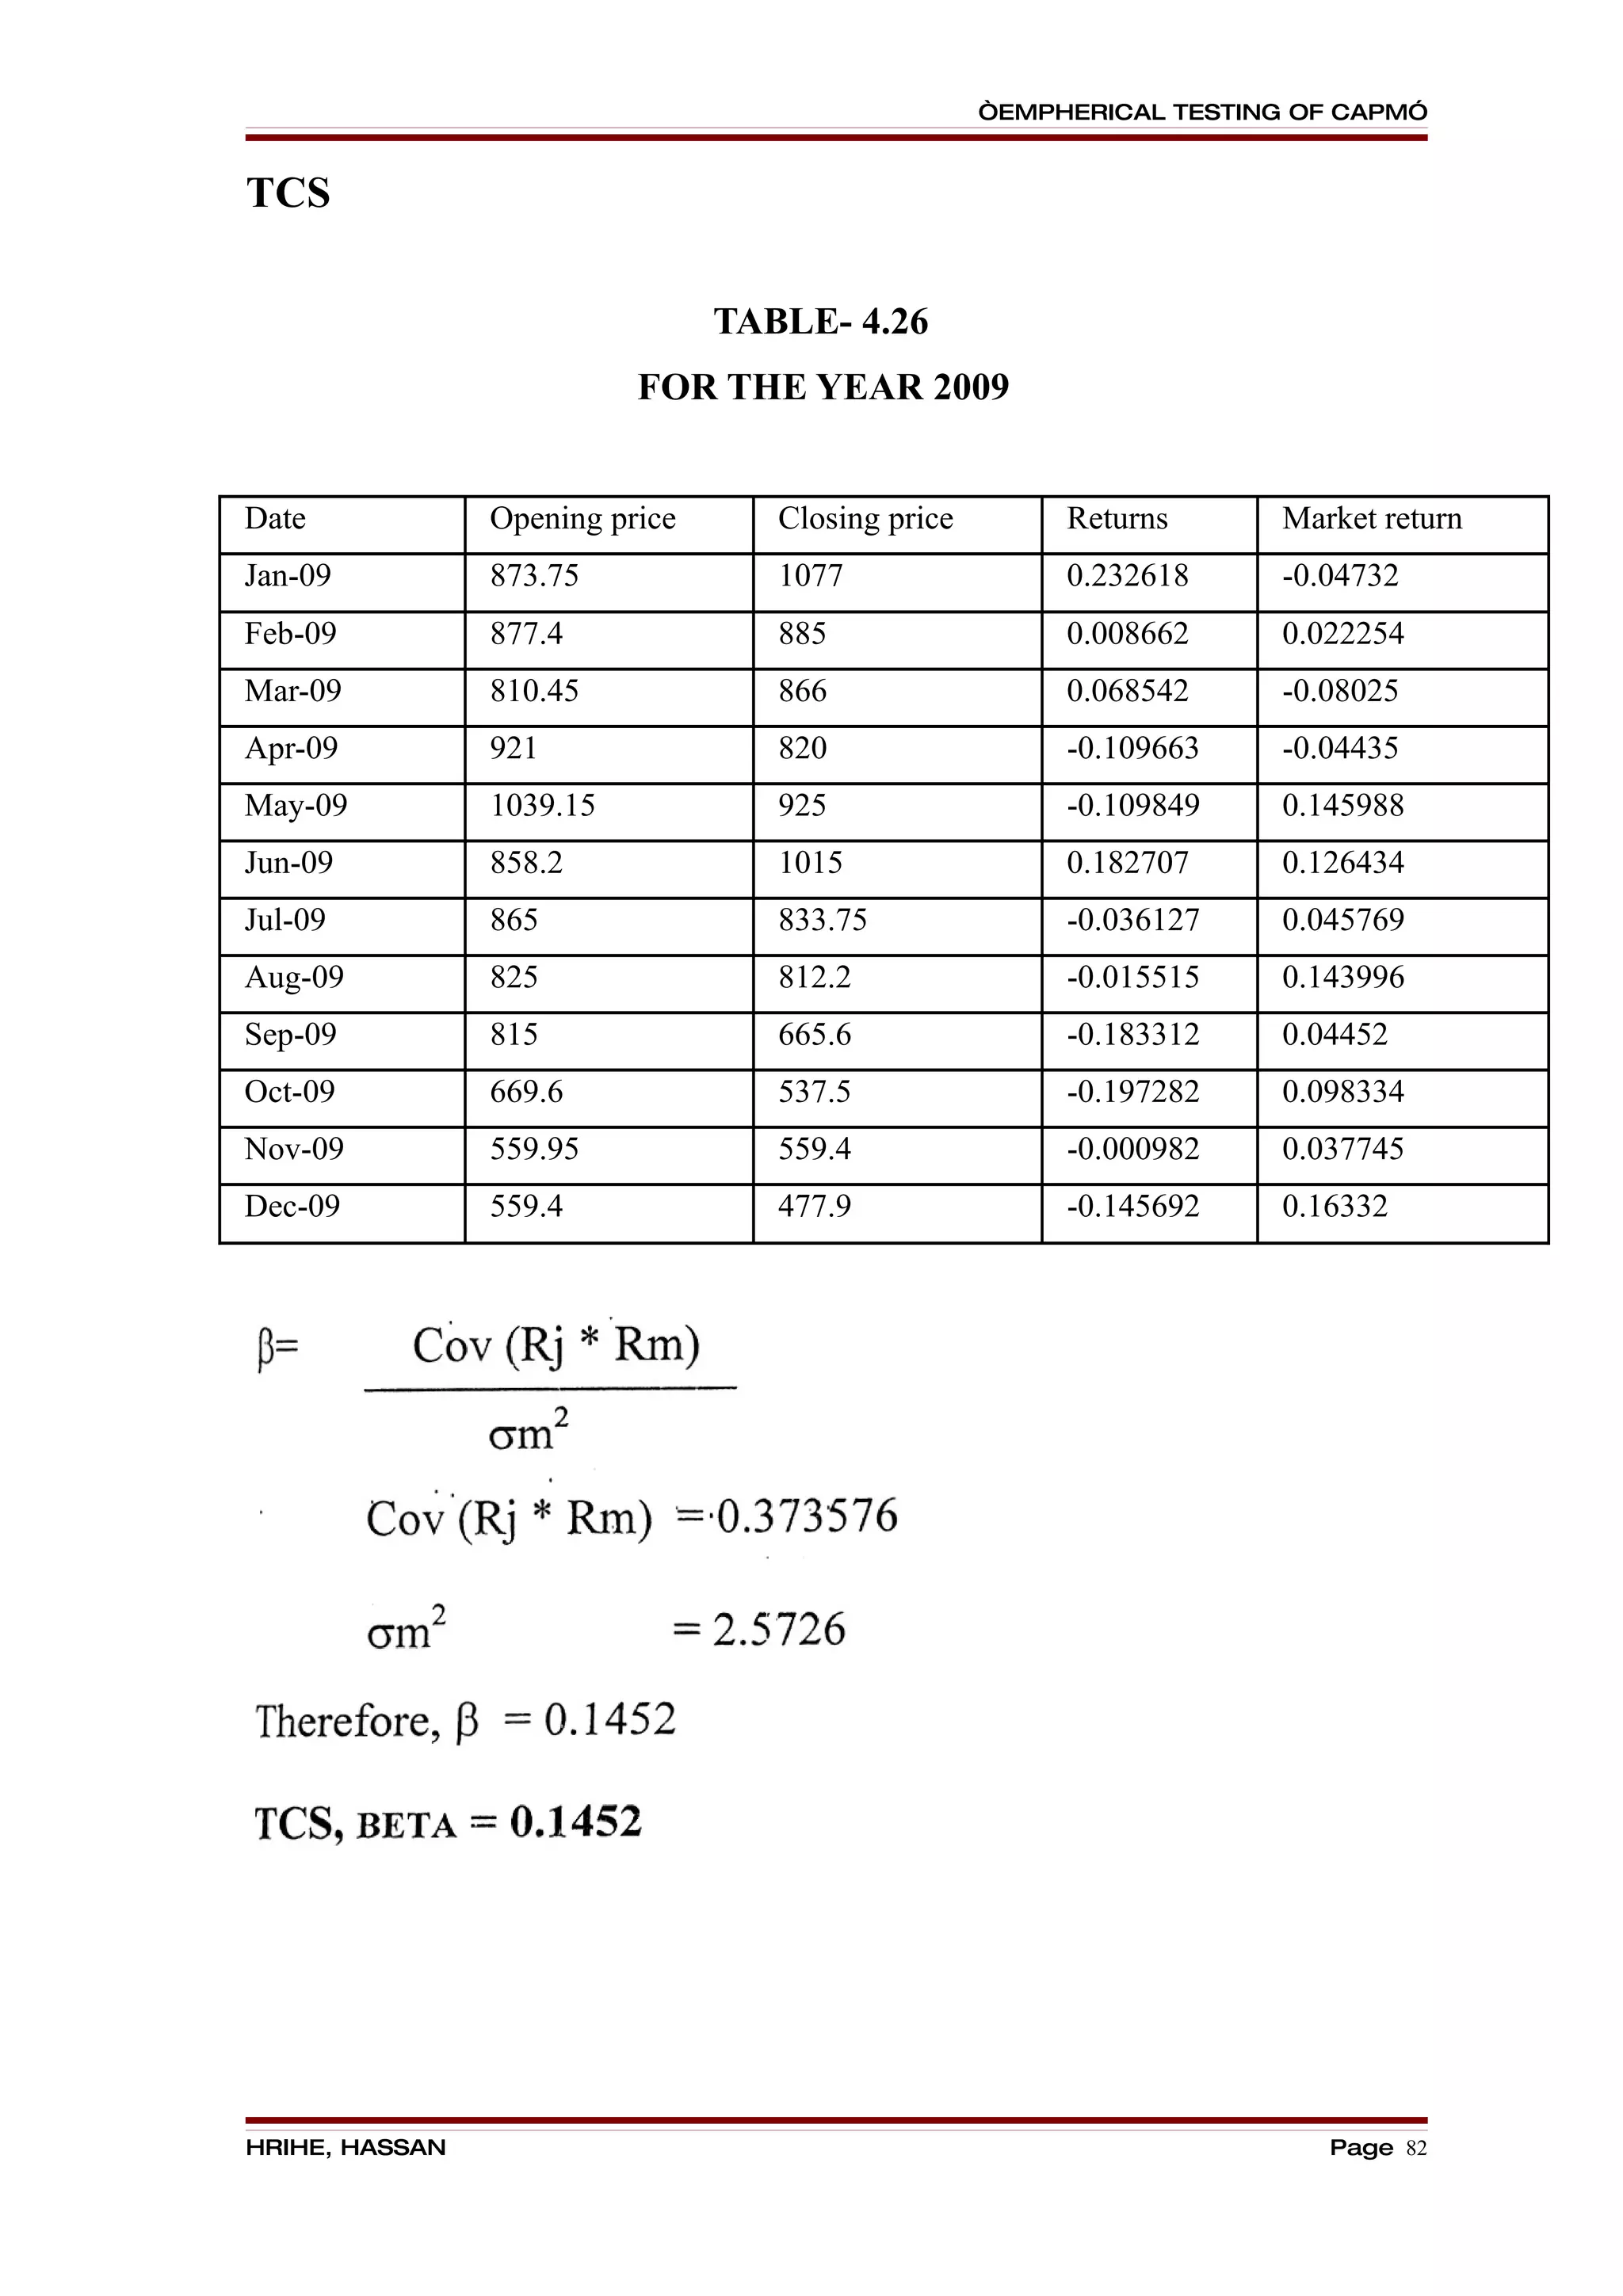
D) TCS:
Rj = Rf + β ∗ [E(Rm) - Rf]
= 6 + 0.1452 ∗ [30-6]
= 6 + 0.1452 ∗ [ 24]
= 6 + 12.672
= 9.4848
Therefore, TCS Expected Return = 9.4848
HRIHE, HASSAN Page 84](https://image.slidesharecdn.com/astudyonemphericaltestingofcapitalassetpricingmodel-100924143213-phpapp02/75/A-study-on-empherical-testing-of-capital-asset-pricing-model-84-2048.jpg)
![“EMPHERICAL TESTING OF CAPM”
INTERPRETATION:
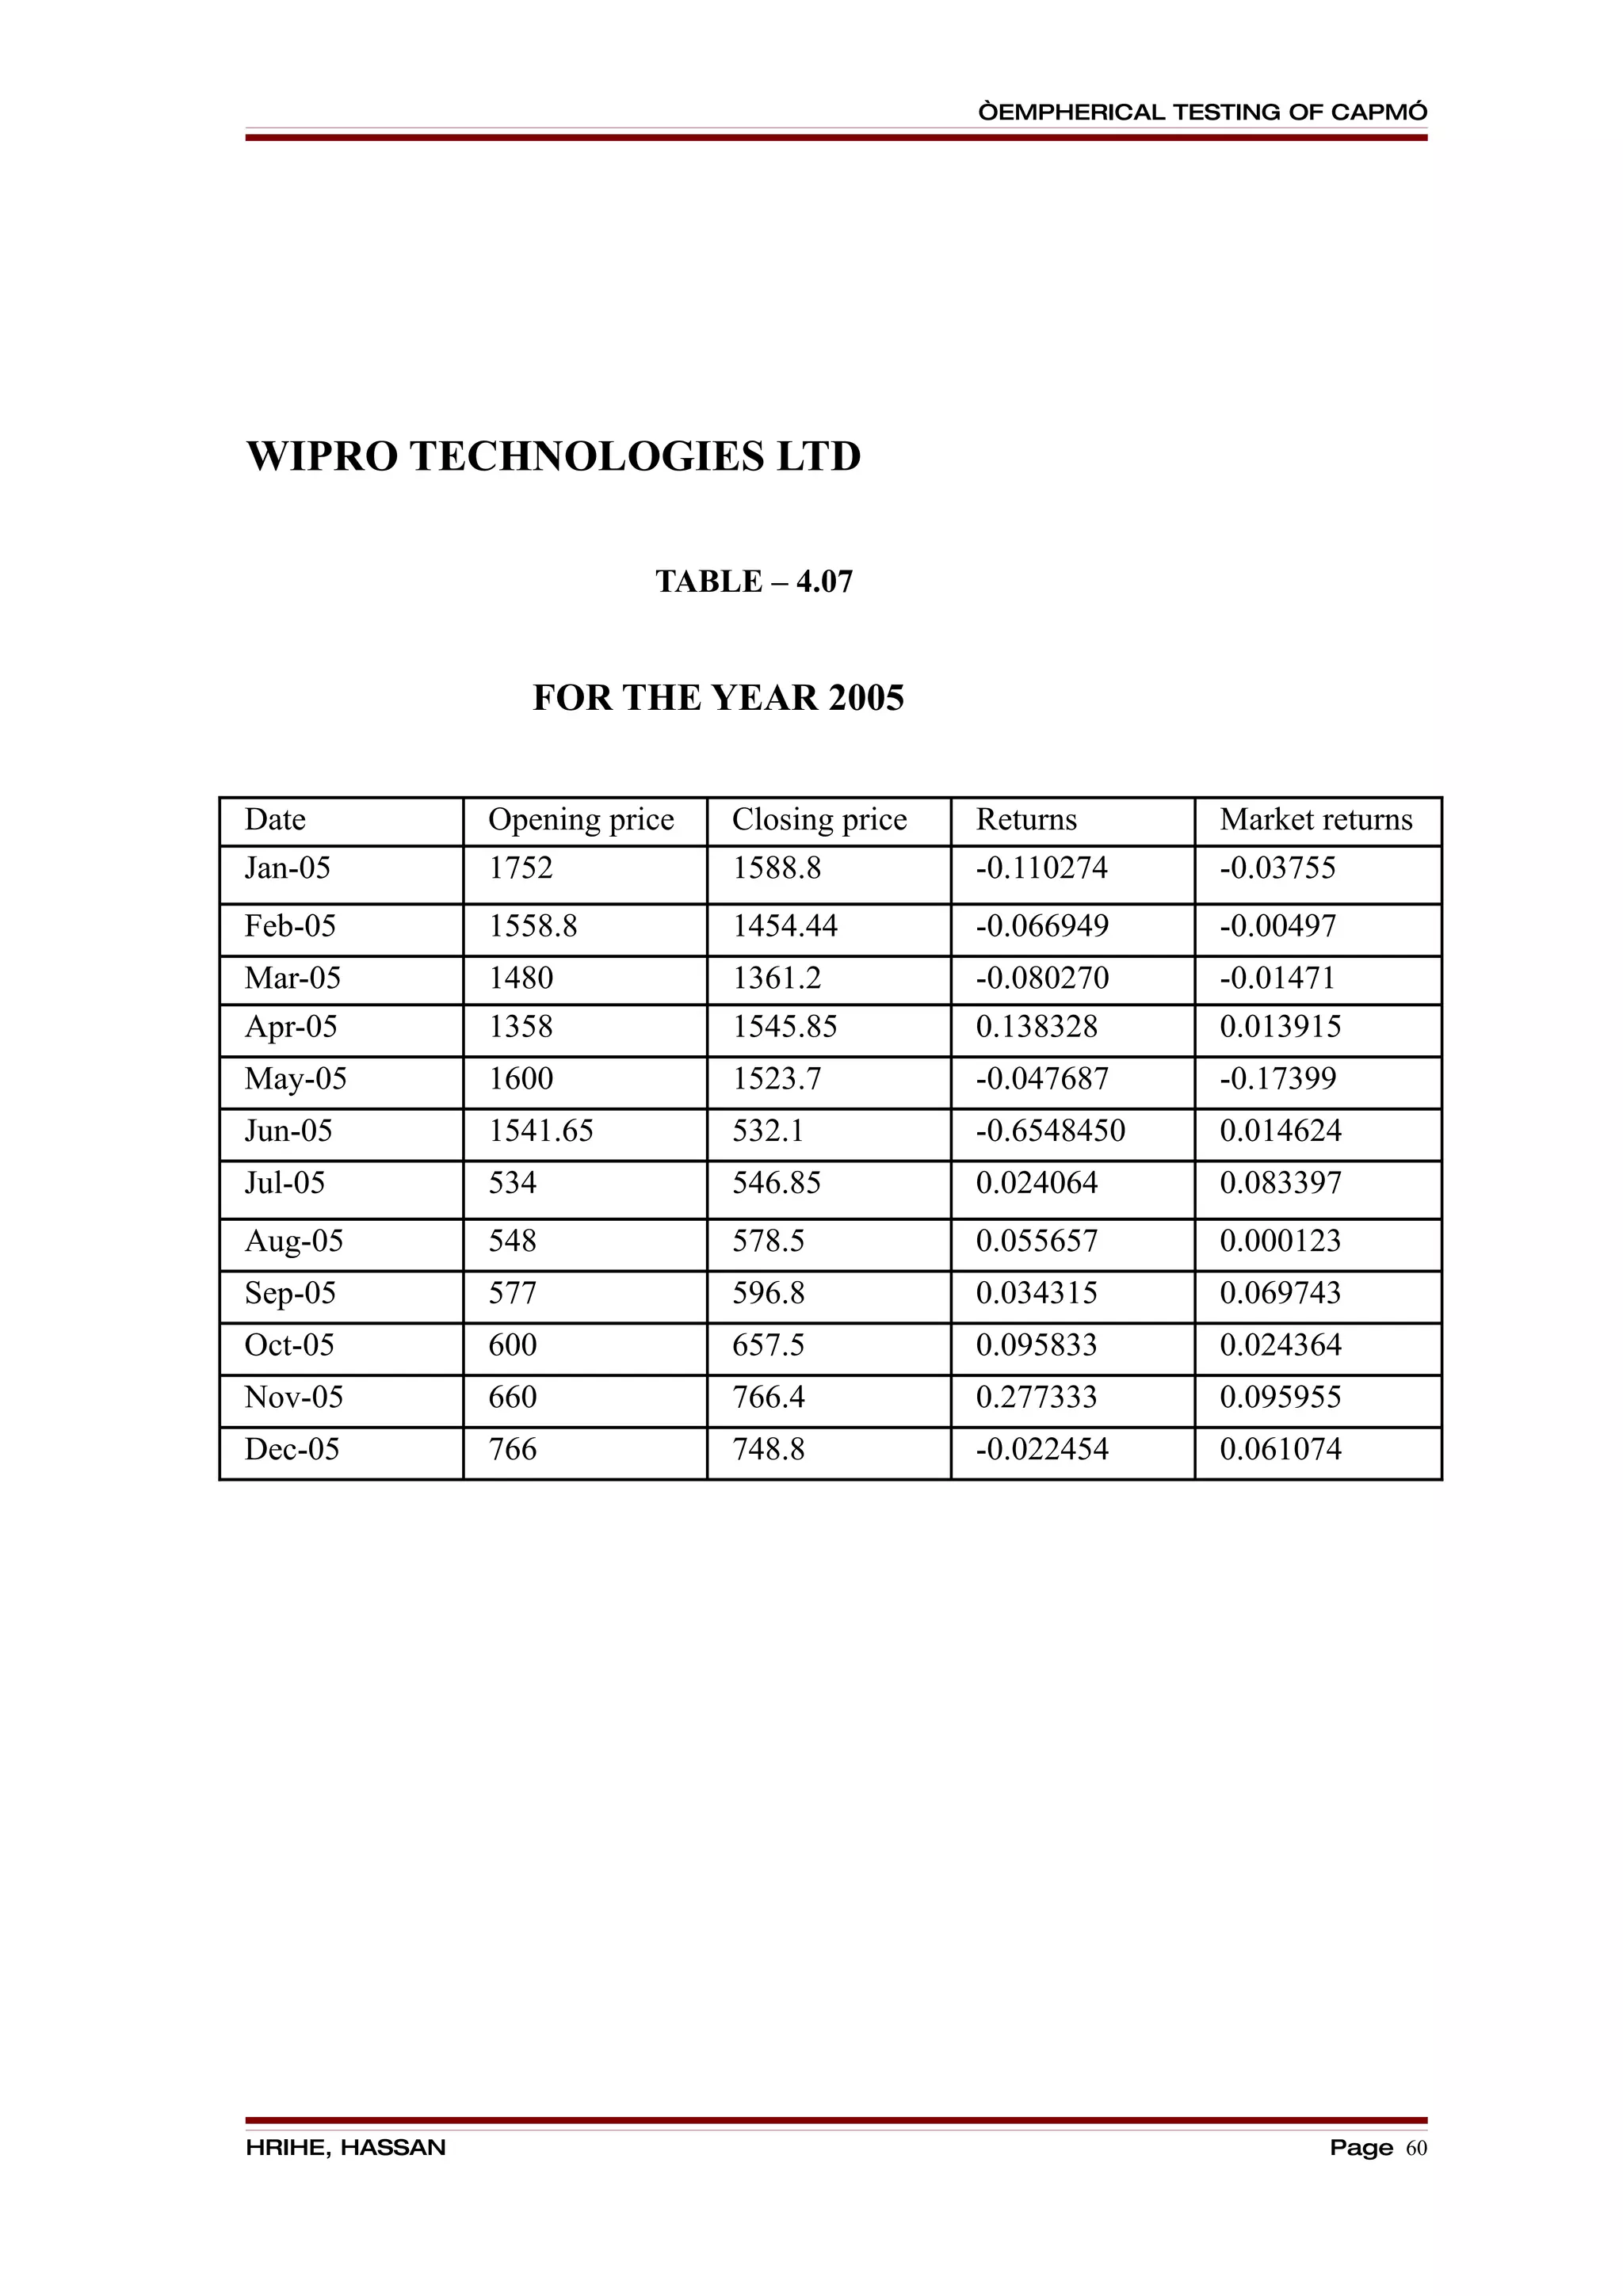
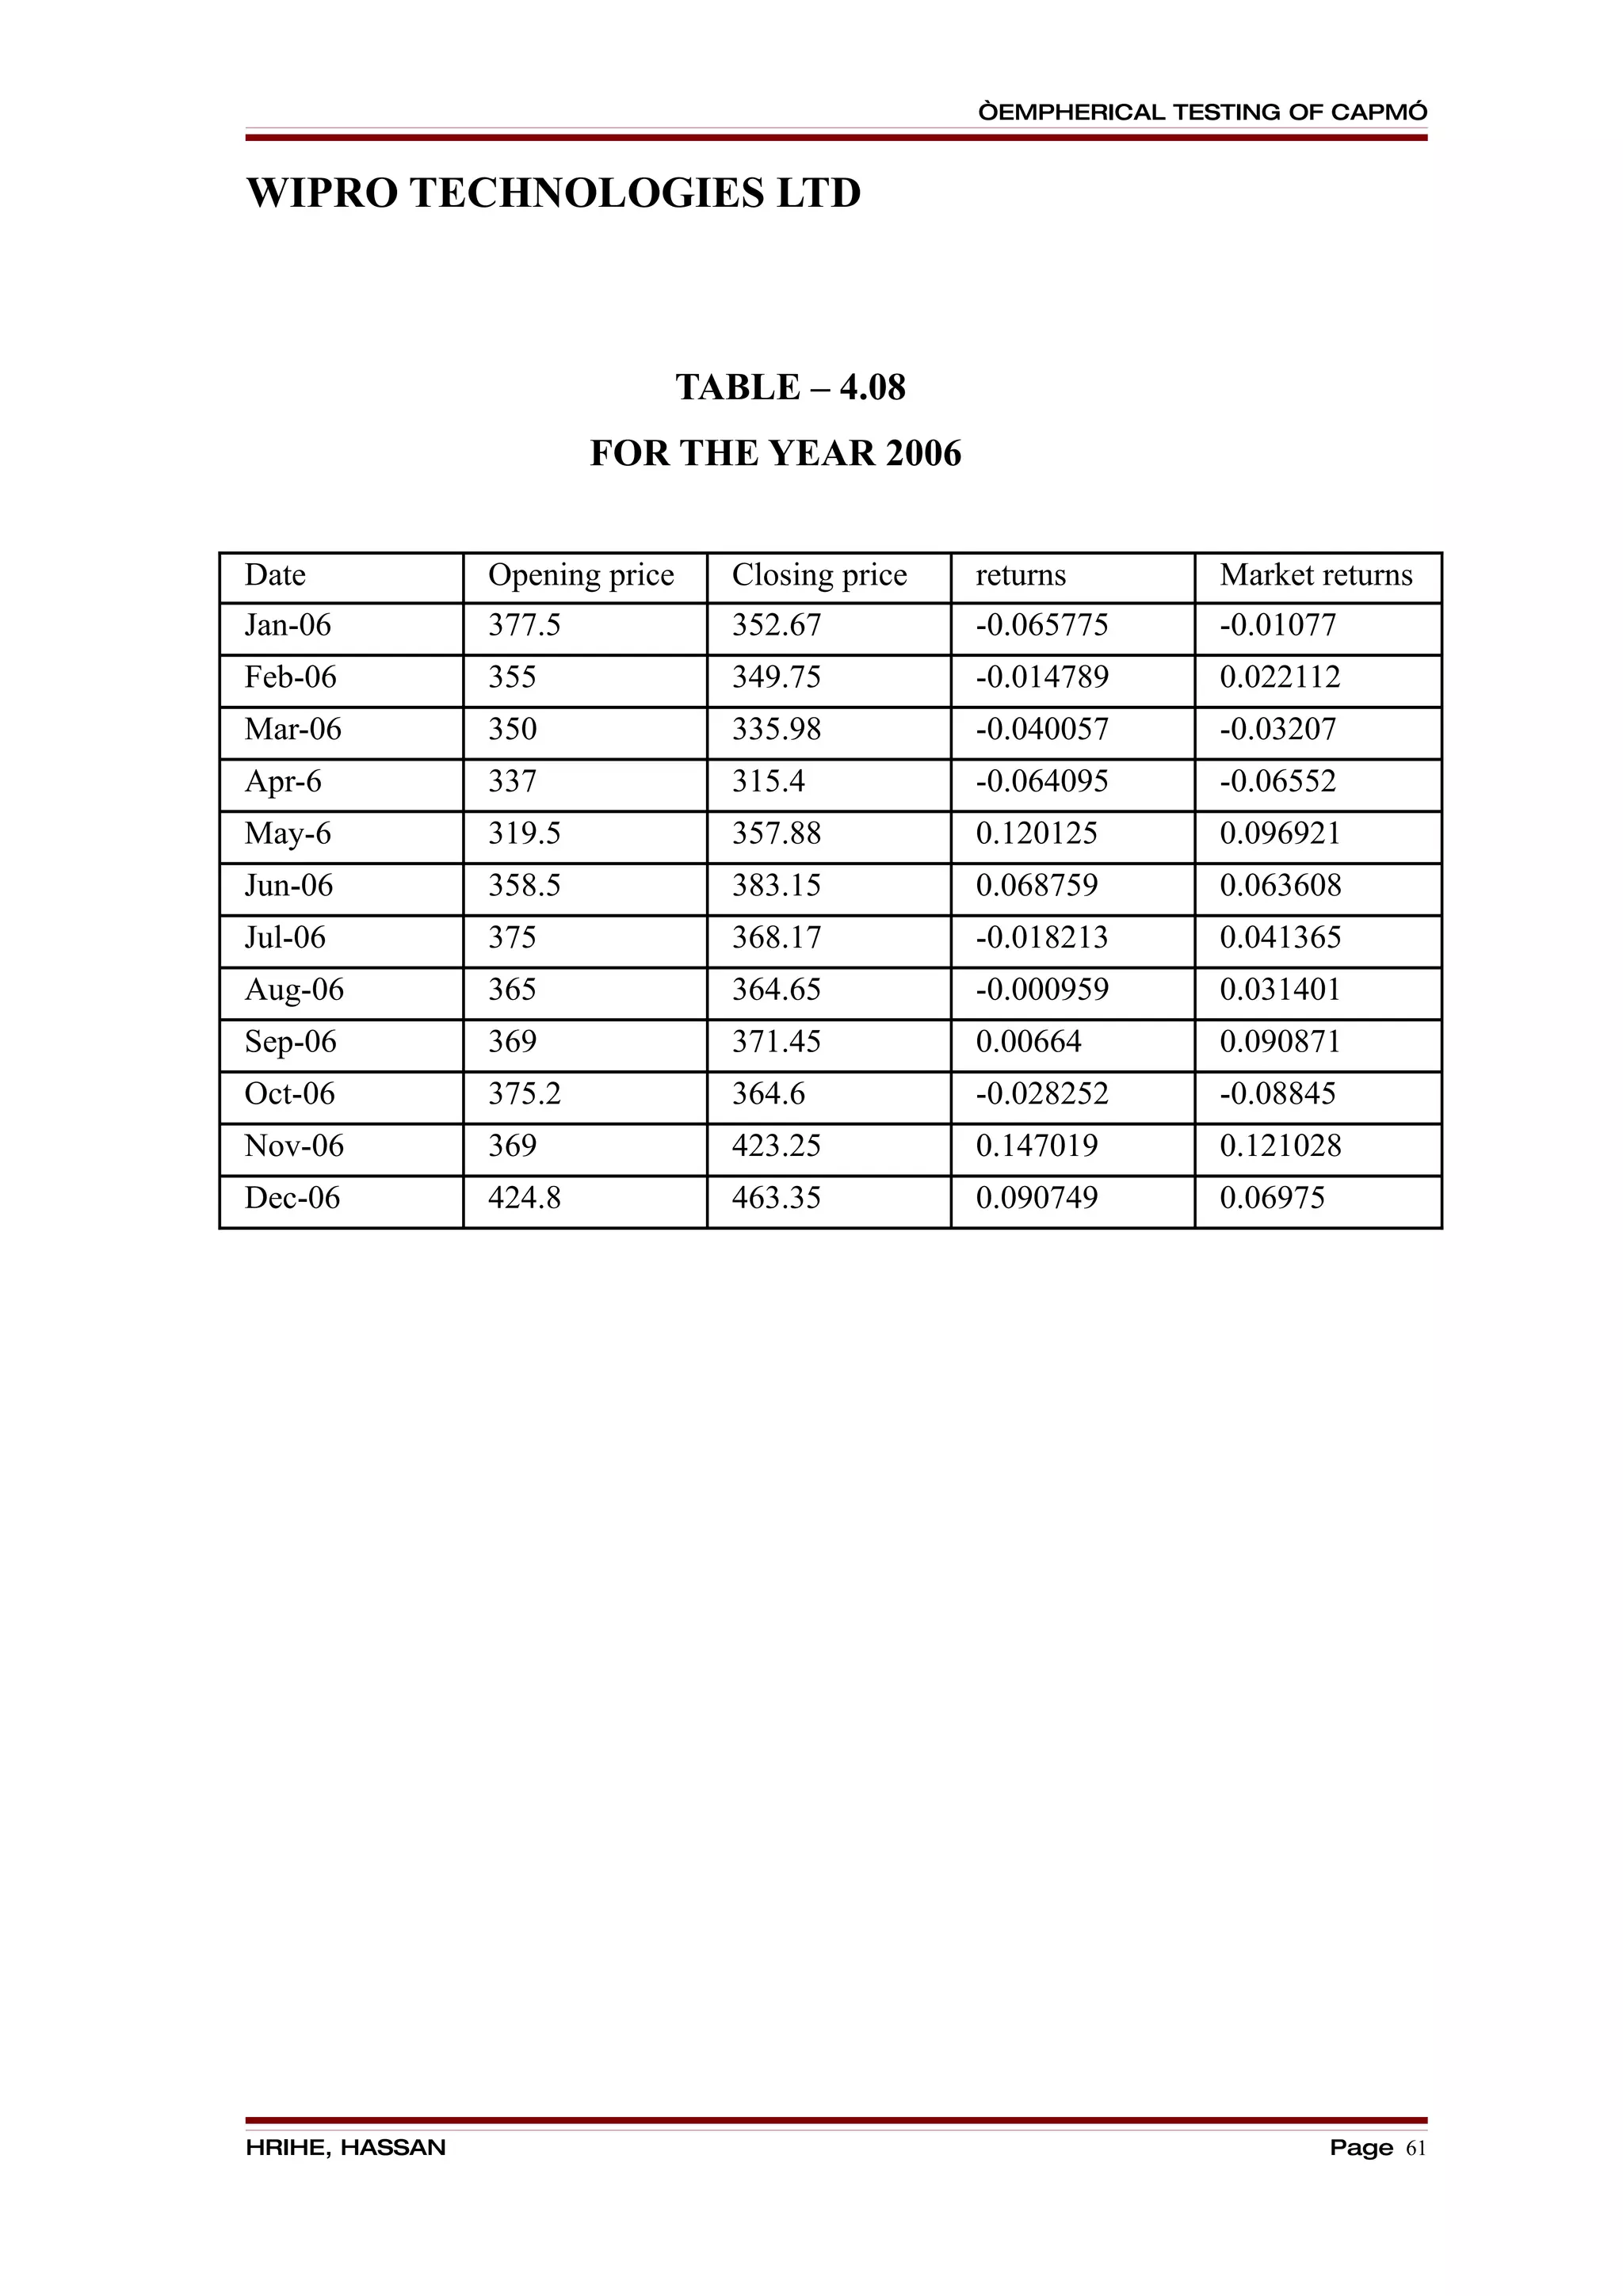
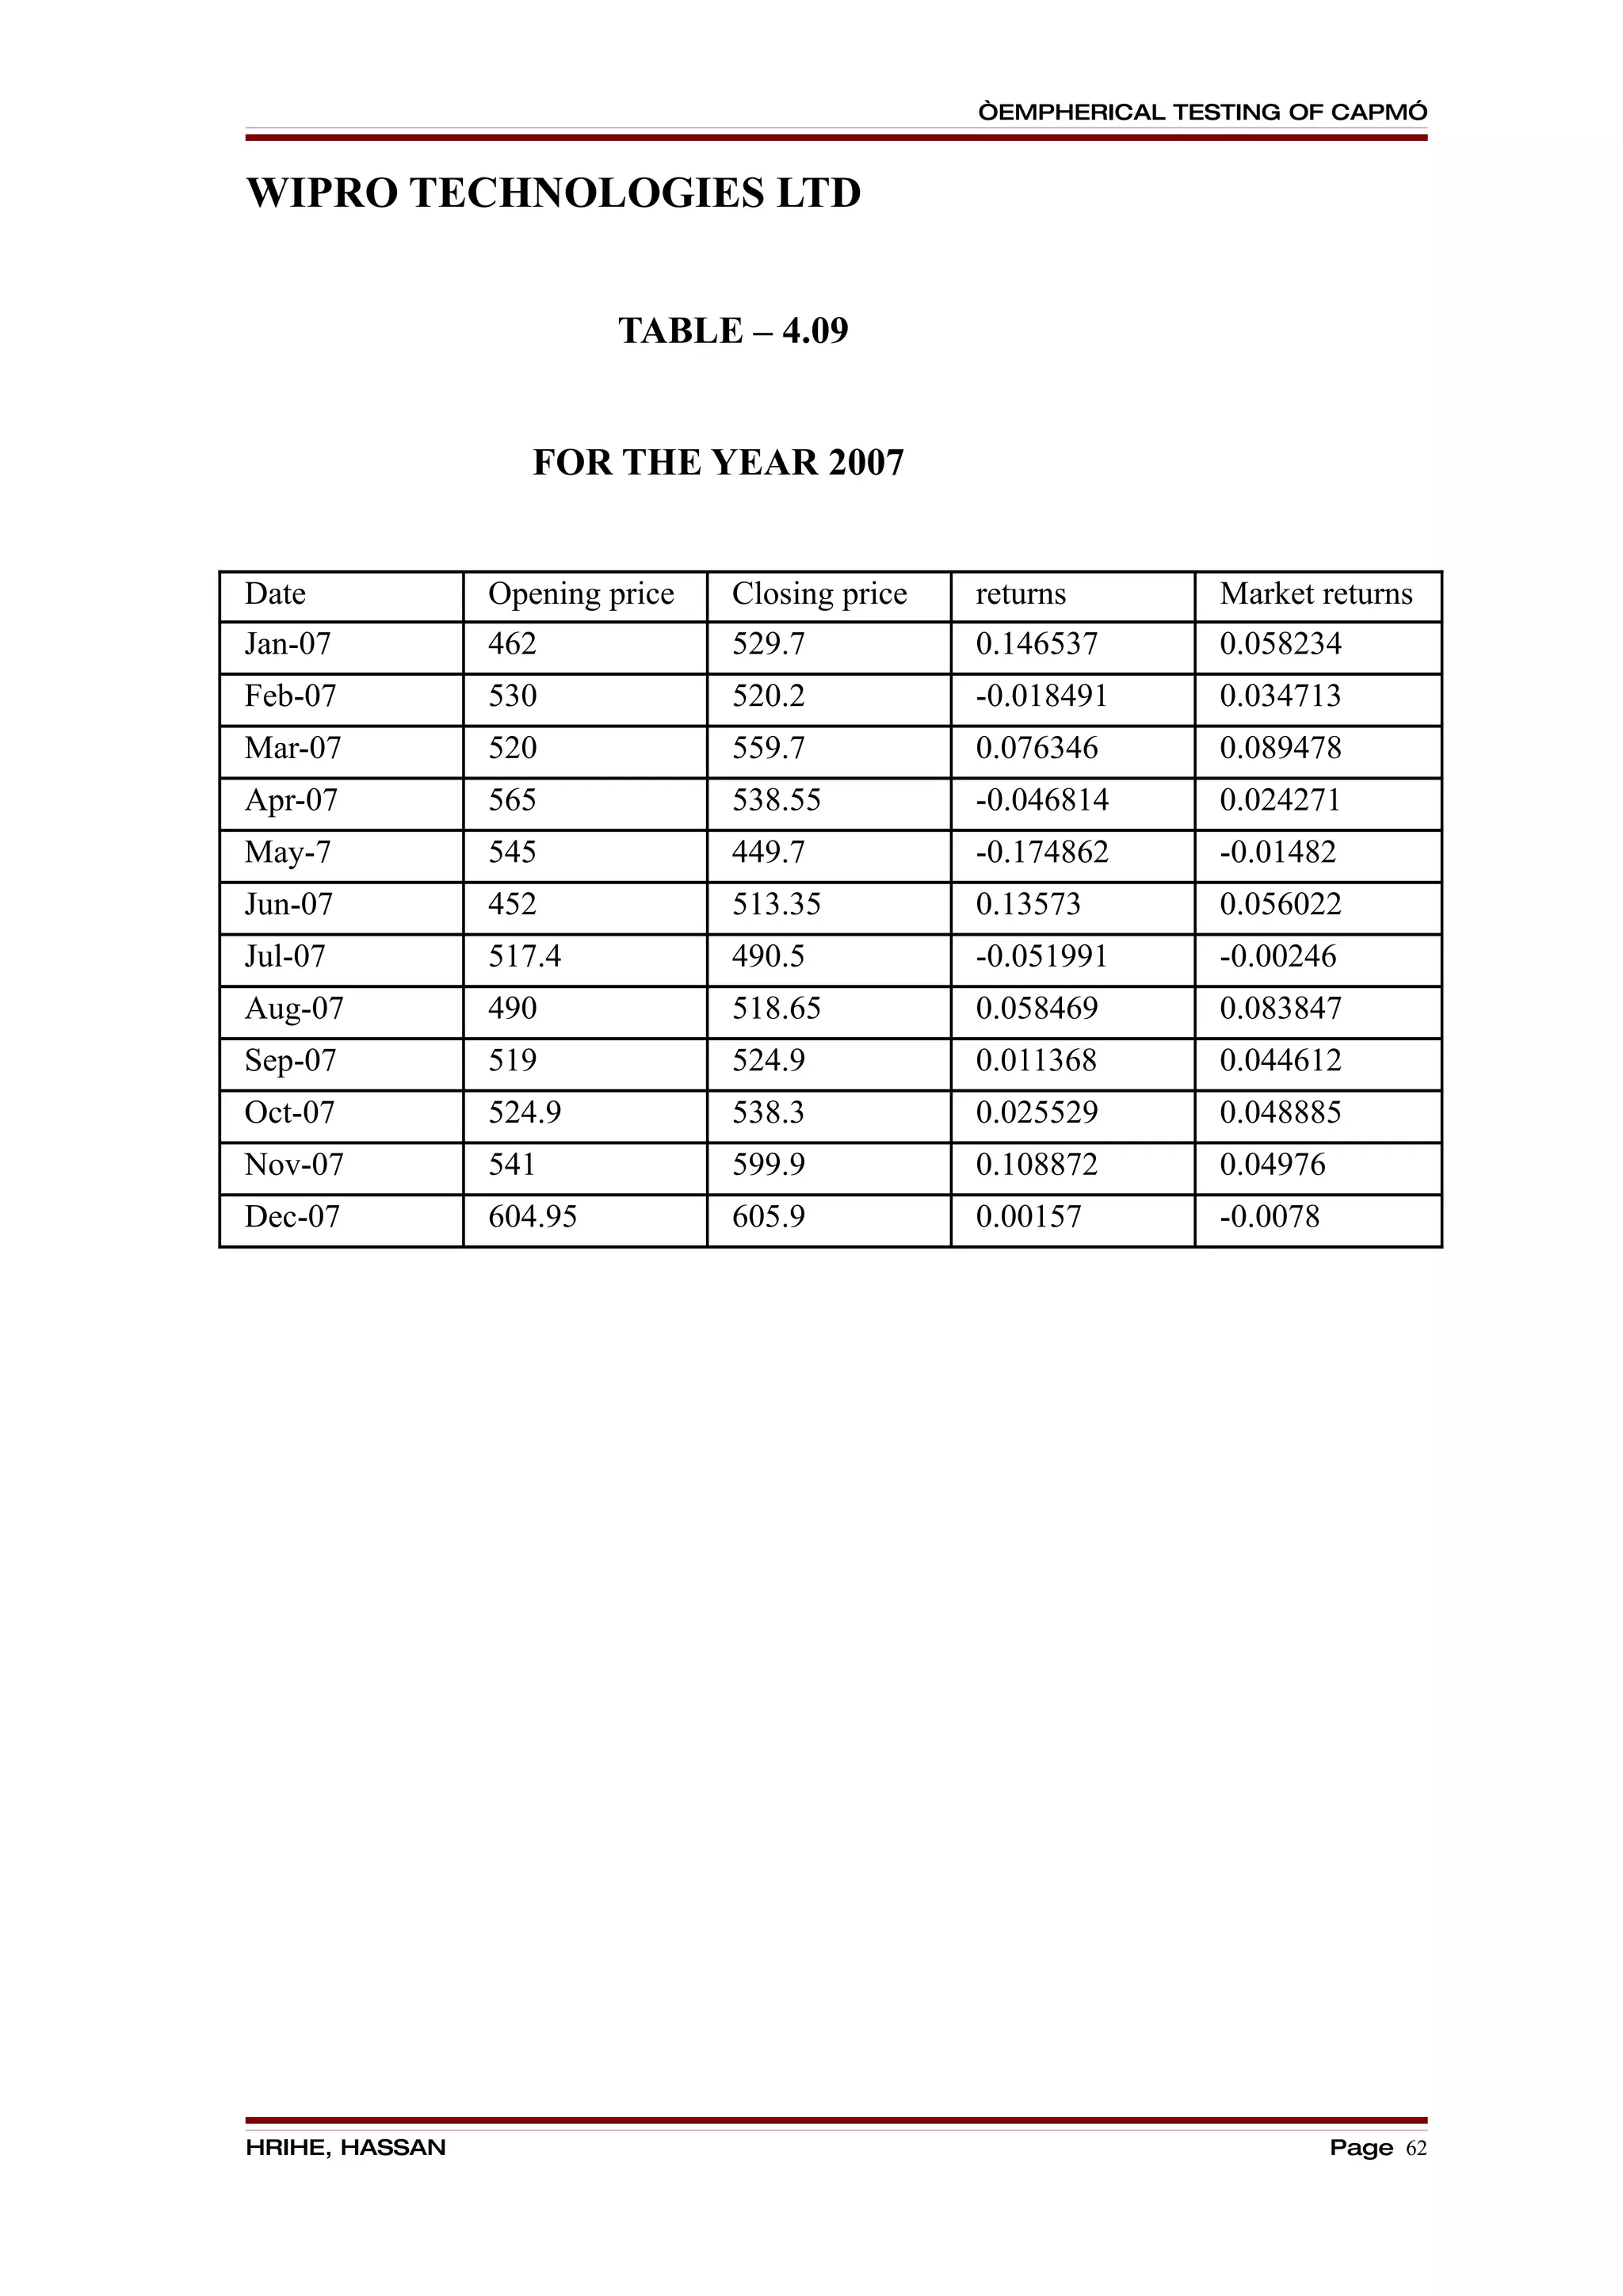
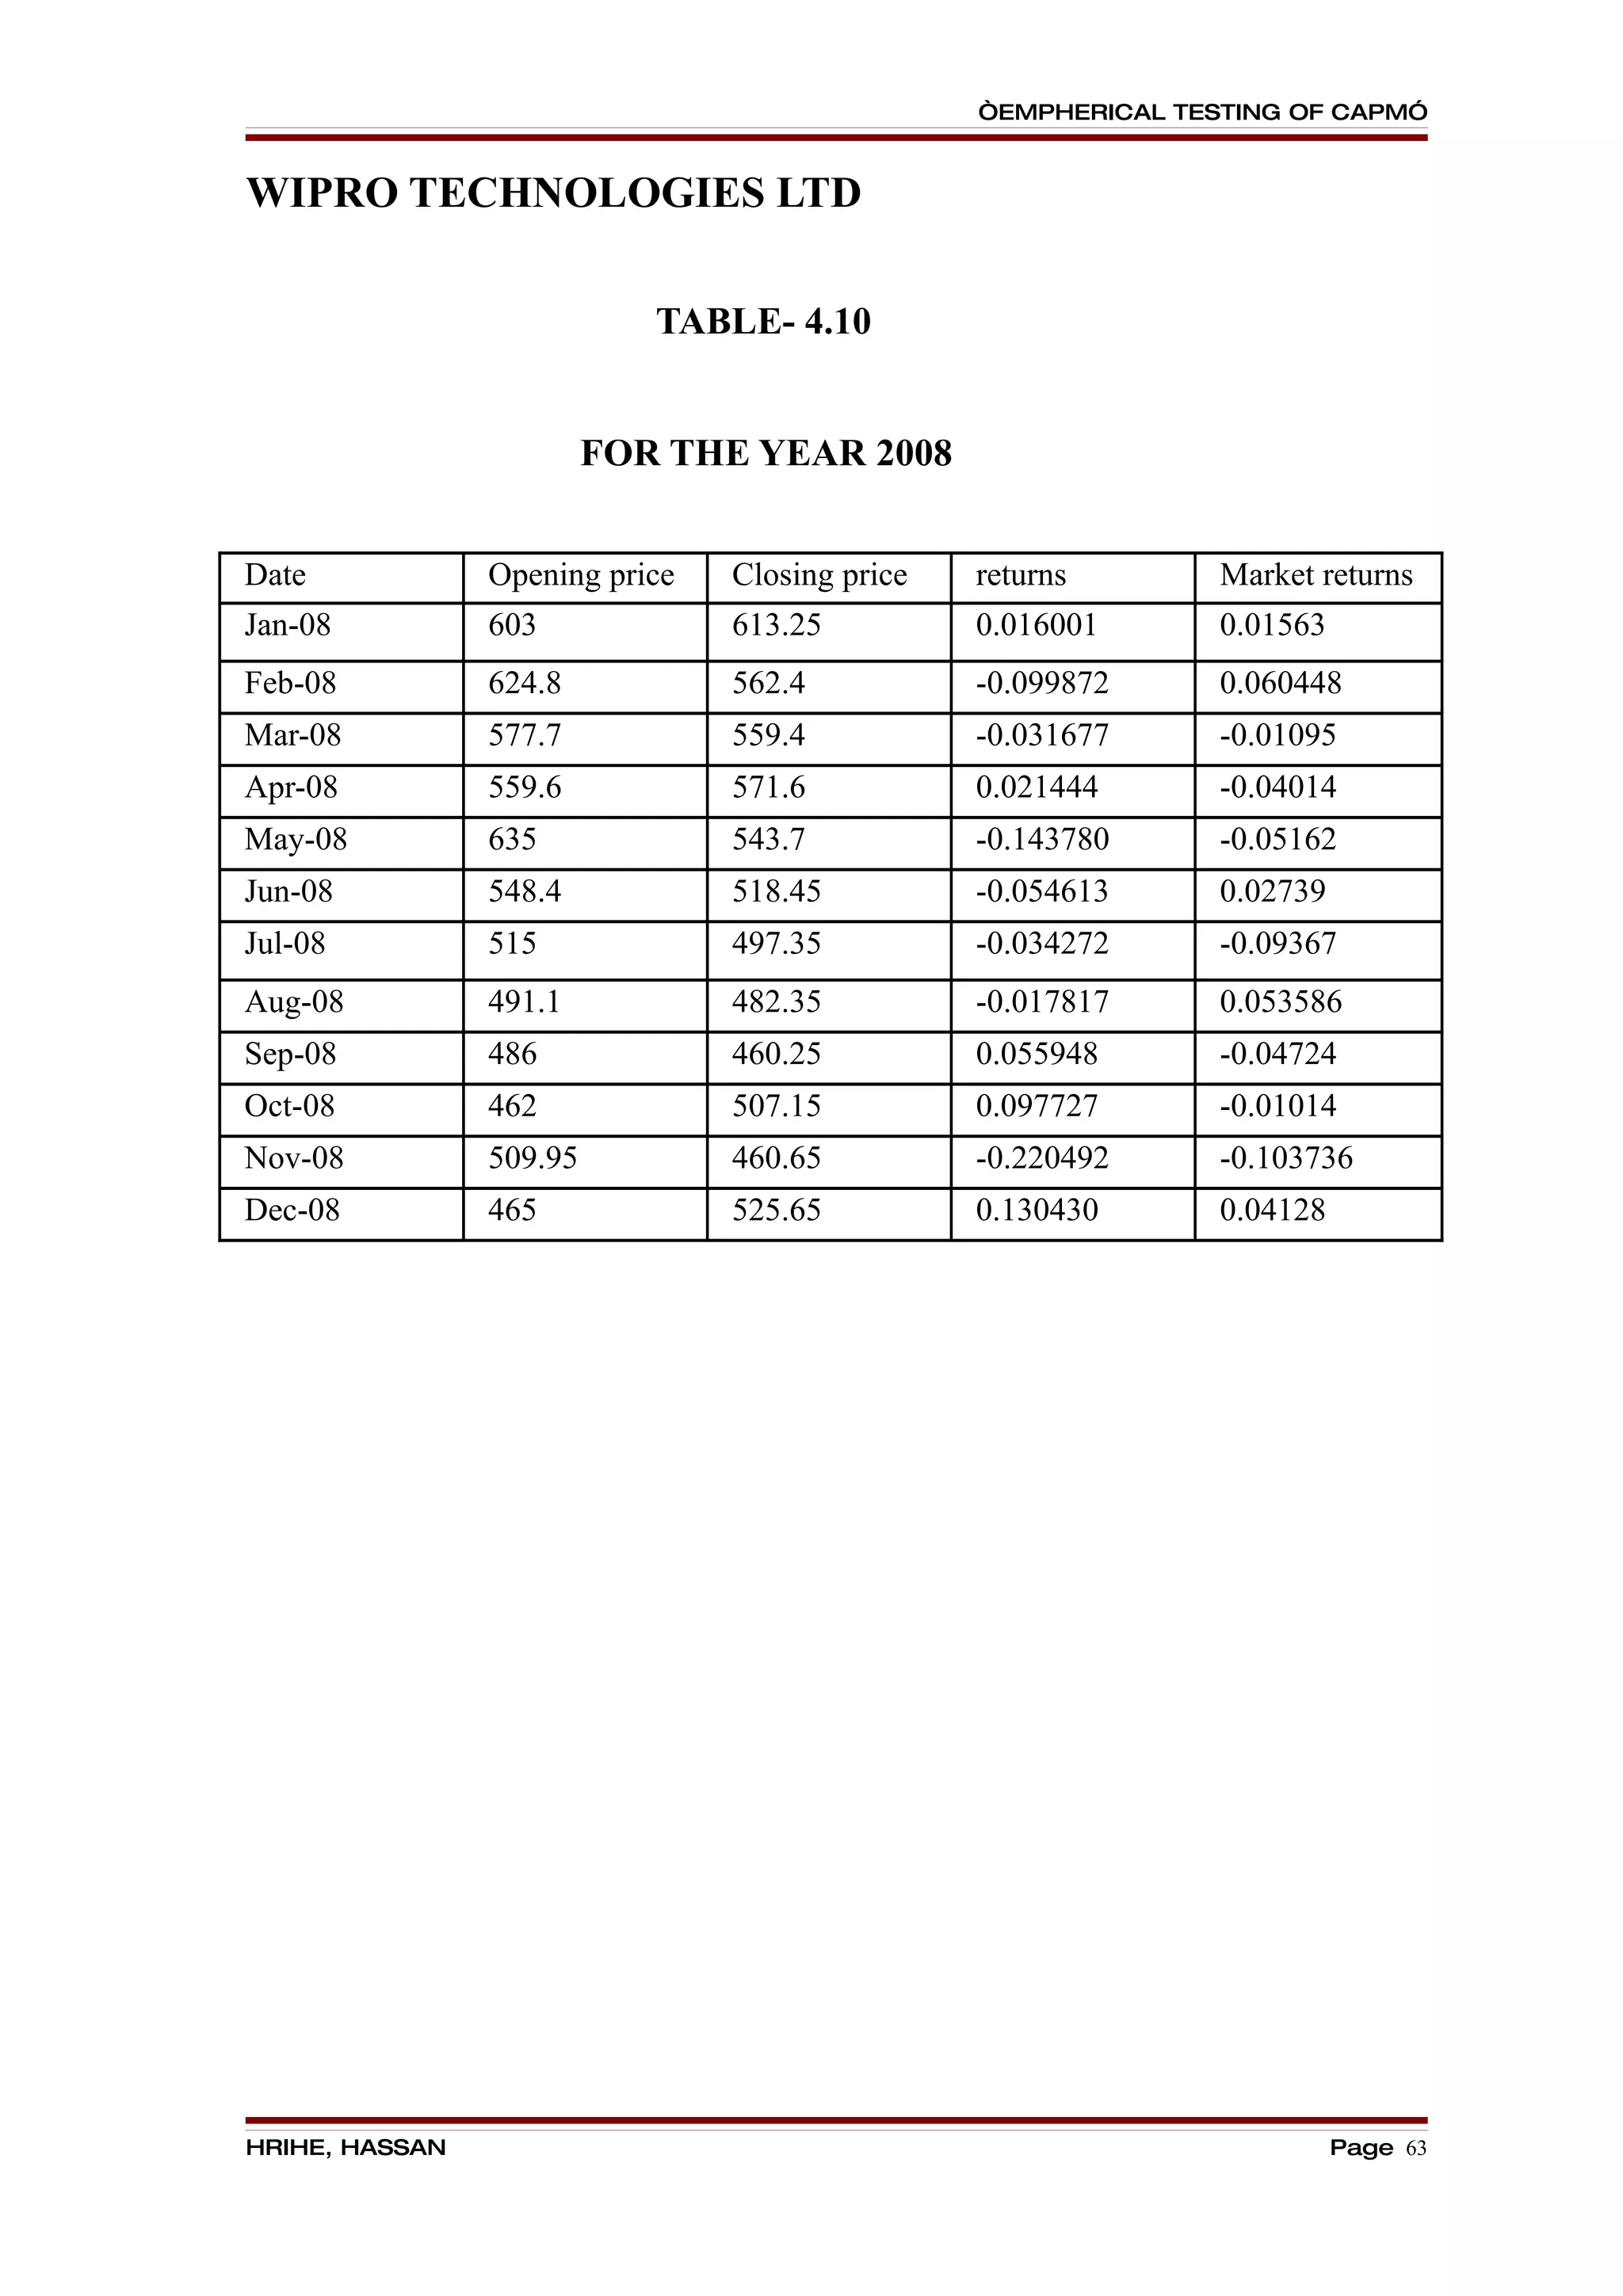
A] WIPRO TECHNOLOGIES LTD :
The data has been analysed by using Beta, Expected return, Security Market Line.
The Beta and Expected Return has been calculated on for 1st January And by taking of 12
months. The analysis has been done by taking exchange rate as independent variable and
company share price for 12 months. In the similar way, index is taken as independent
variable and its impact on exchange rate for 12 months.
From the above data Wipro Technologies Ltd, The stock has been over priced in
2005-2009. Therefore it is perceived as unfair to buy the security.
The expected return on Wipro technologies is 16.422 and the beta is 0.4351 , where
it is less than the market beta, therefore it is said to be “OVER VALUATION OF
STOCK”.
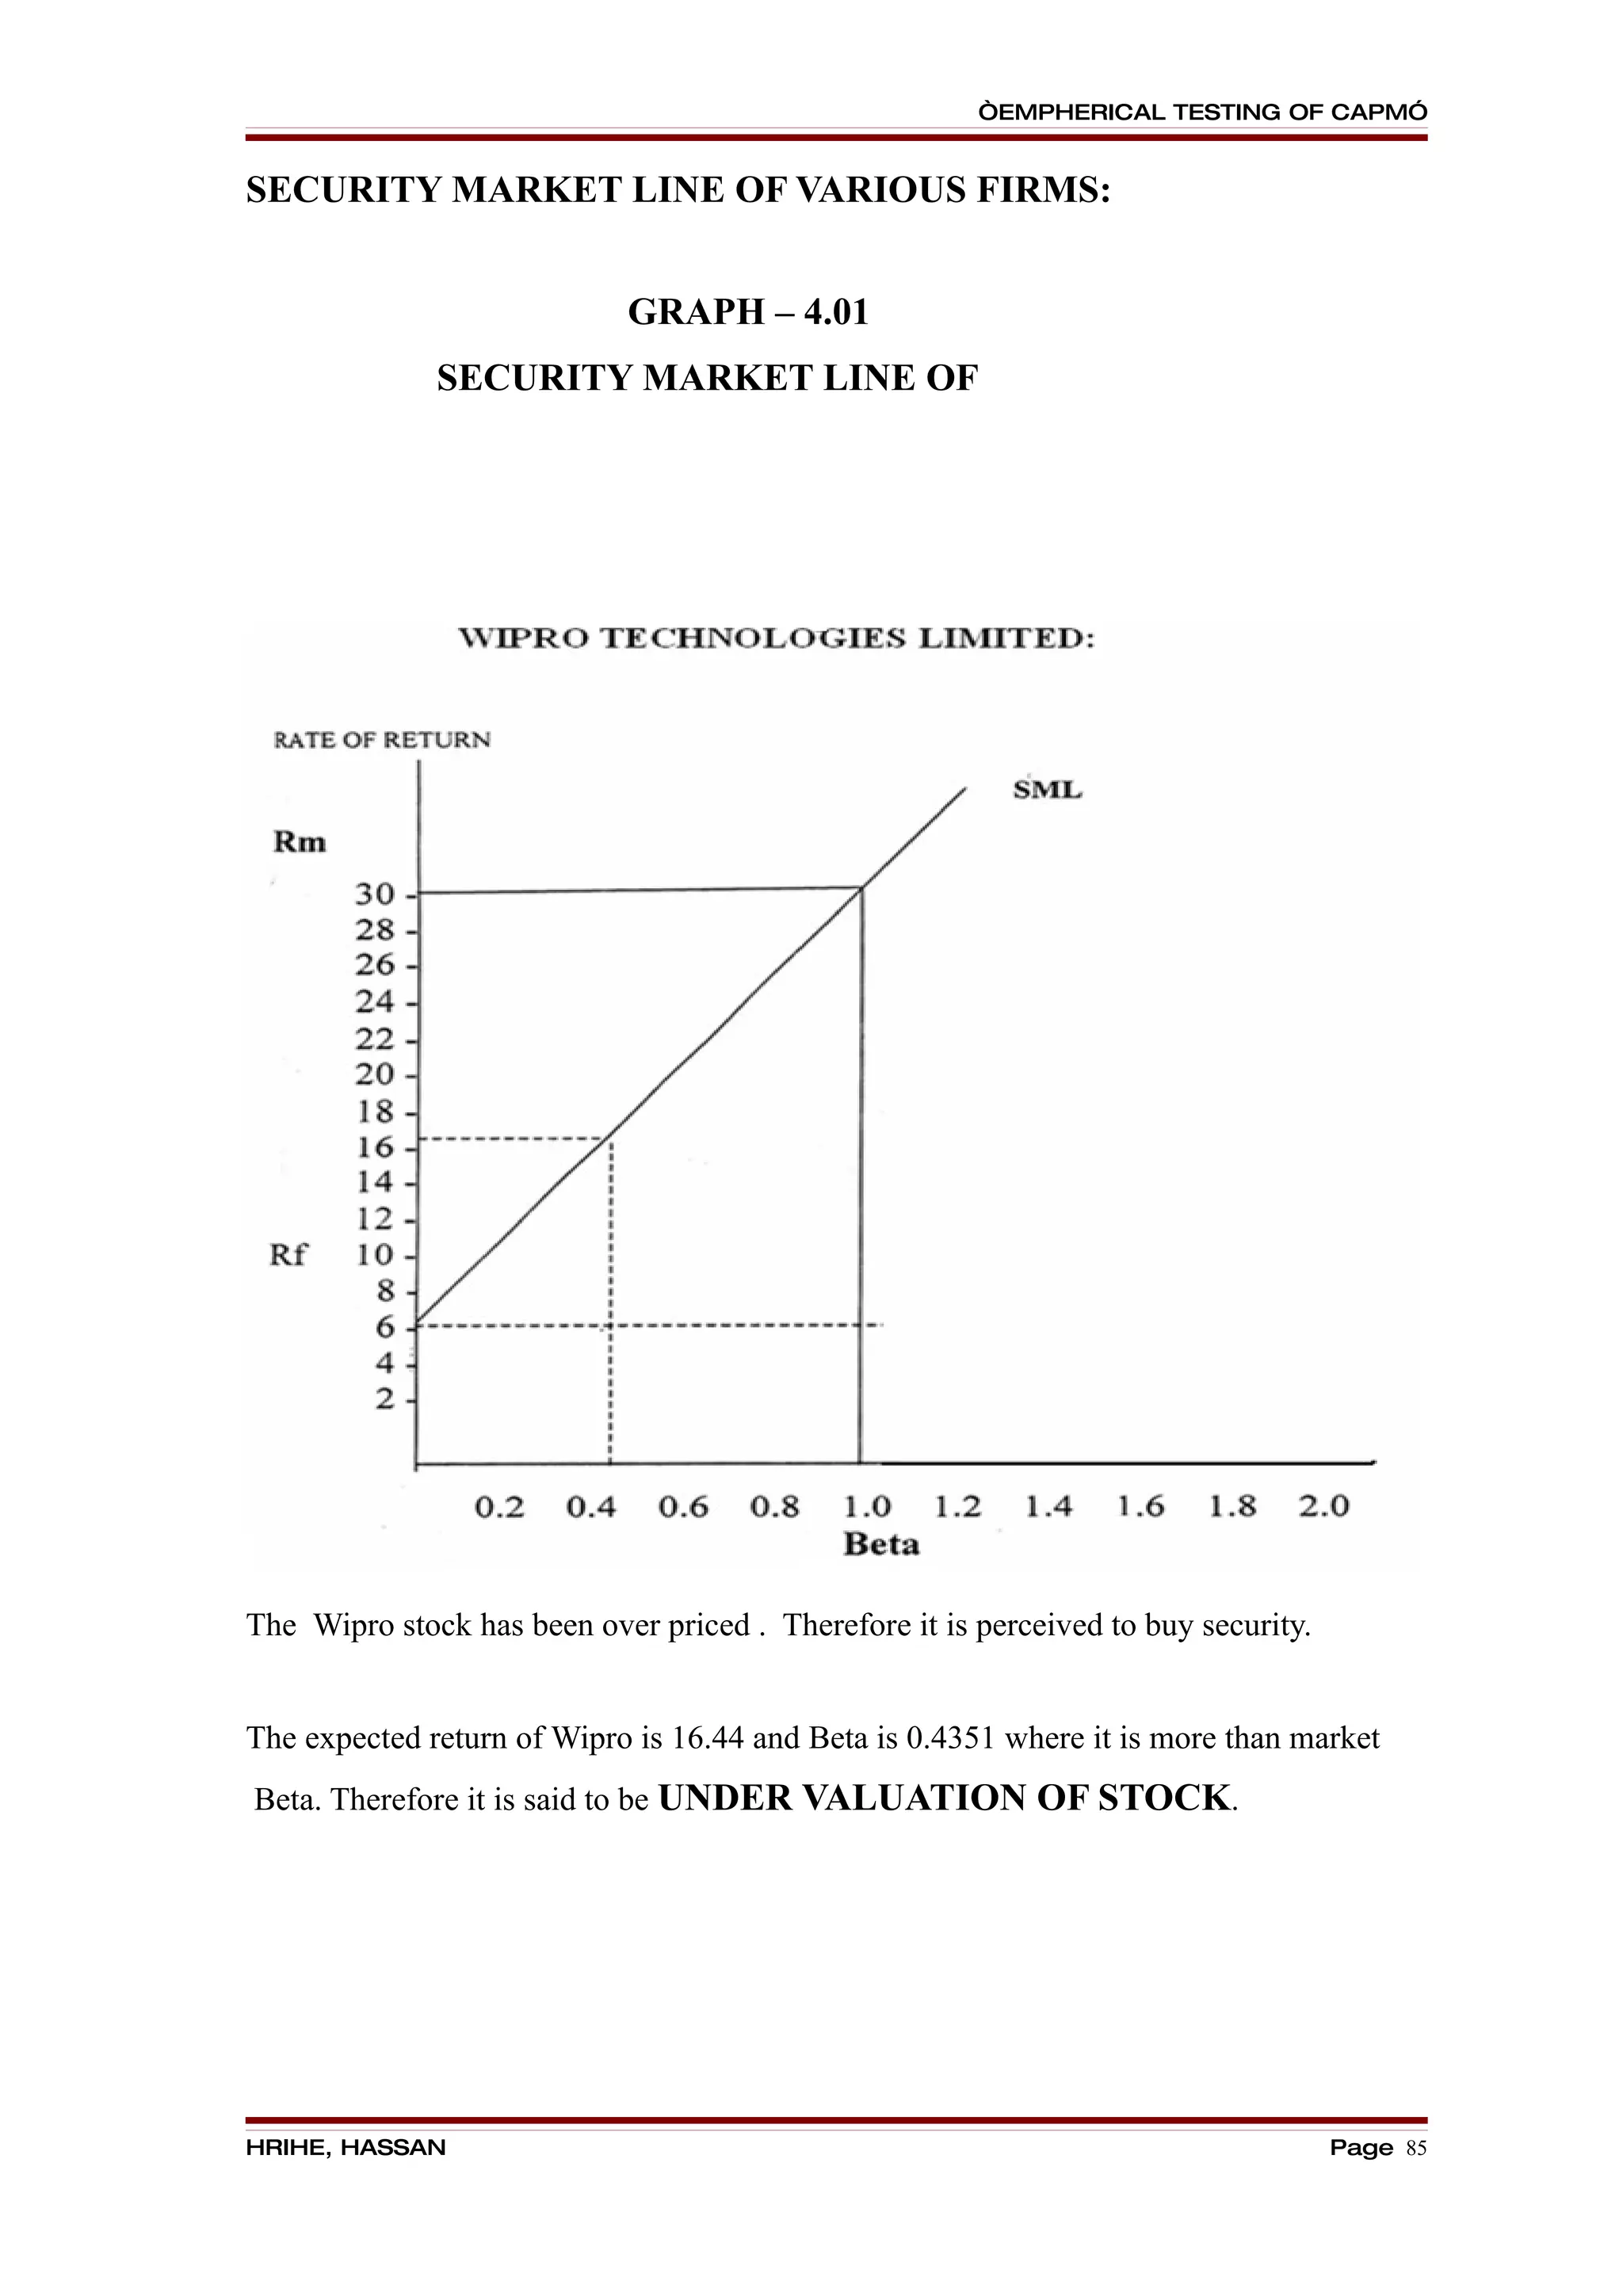
The Wipro stock has been priced. Therefore it is perceived by the security. The
expected return of the Wipro is 16.422 and the beta is 0.4351, where it is more than the
market beta, therefore it is said to be “ UNDER VALUATION OF STOCK”.
B] INFOSYS TECHNOLOGIES LTD:
The data has been analysed by using Beta, Expected return, Security Market Line.
The Beta and Expected Return has been calculated on for 1st January And by taking of 12
months. The analysis has been done by taking exchange rate as independent variable and
company share price for 12 months. In the similar way, index is taken as independent
variable and its impact on exchange rate for 12 months.
From the above data of Infosys Technologies ltd, it is clear that, in the of
2005-2009 , the stock has been over priced. Therefore it is perceived as unfair to buy the
security.
The expected return on Infosys technologies is 19.5072 and the beta is 0.5628 ,
where it is less than the market beta, therefore it is said to be “OVER VALUATION OF
STOCK”.
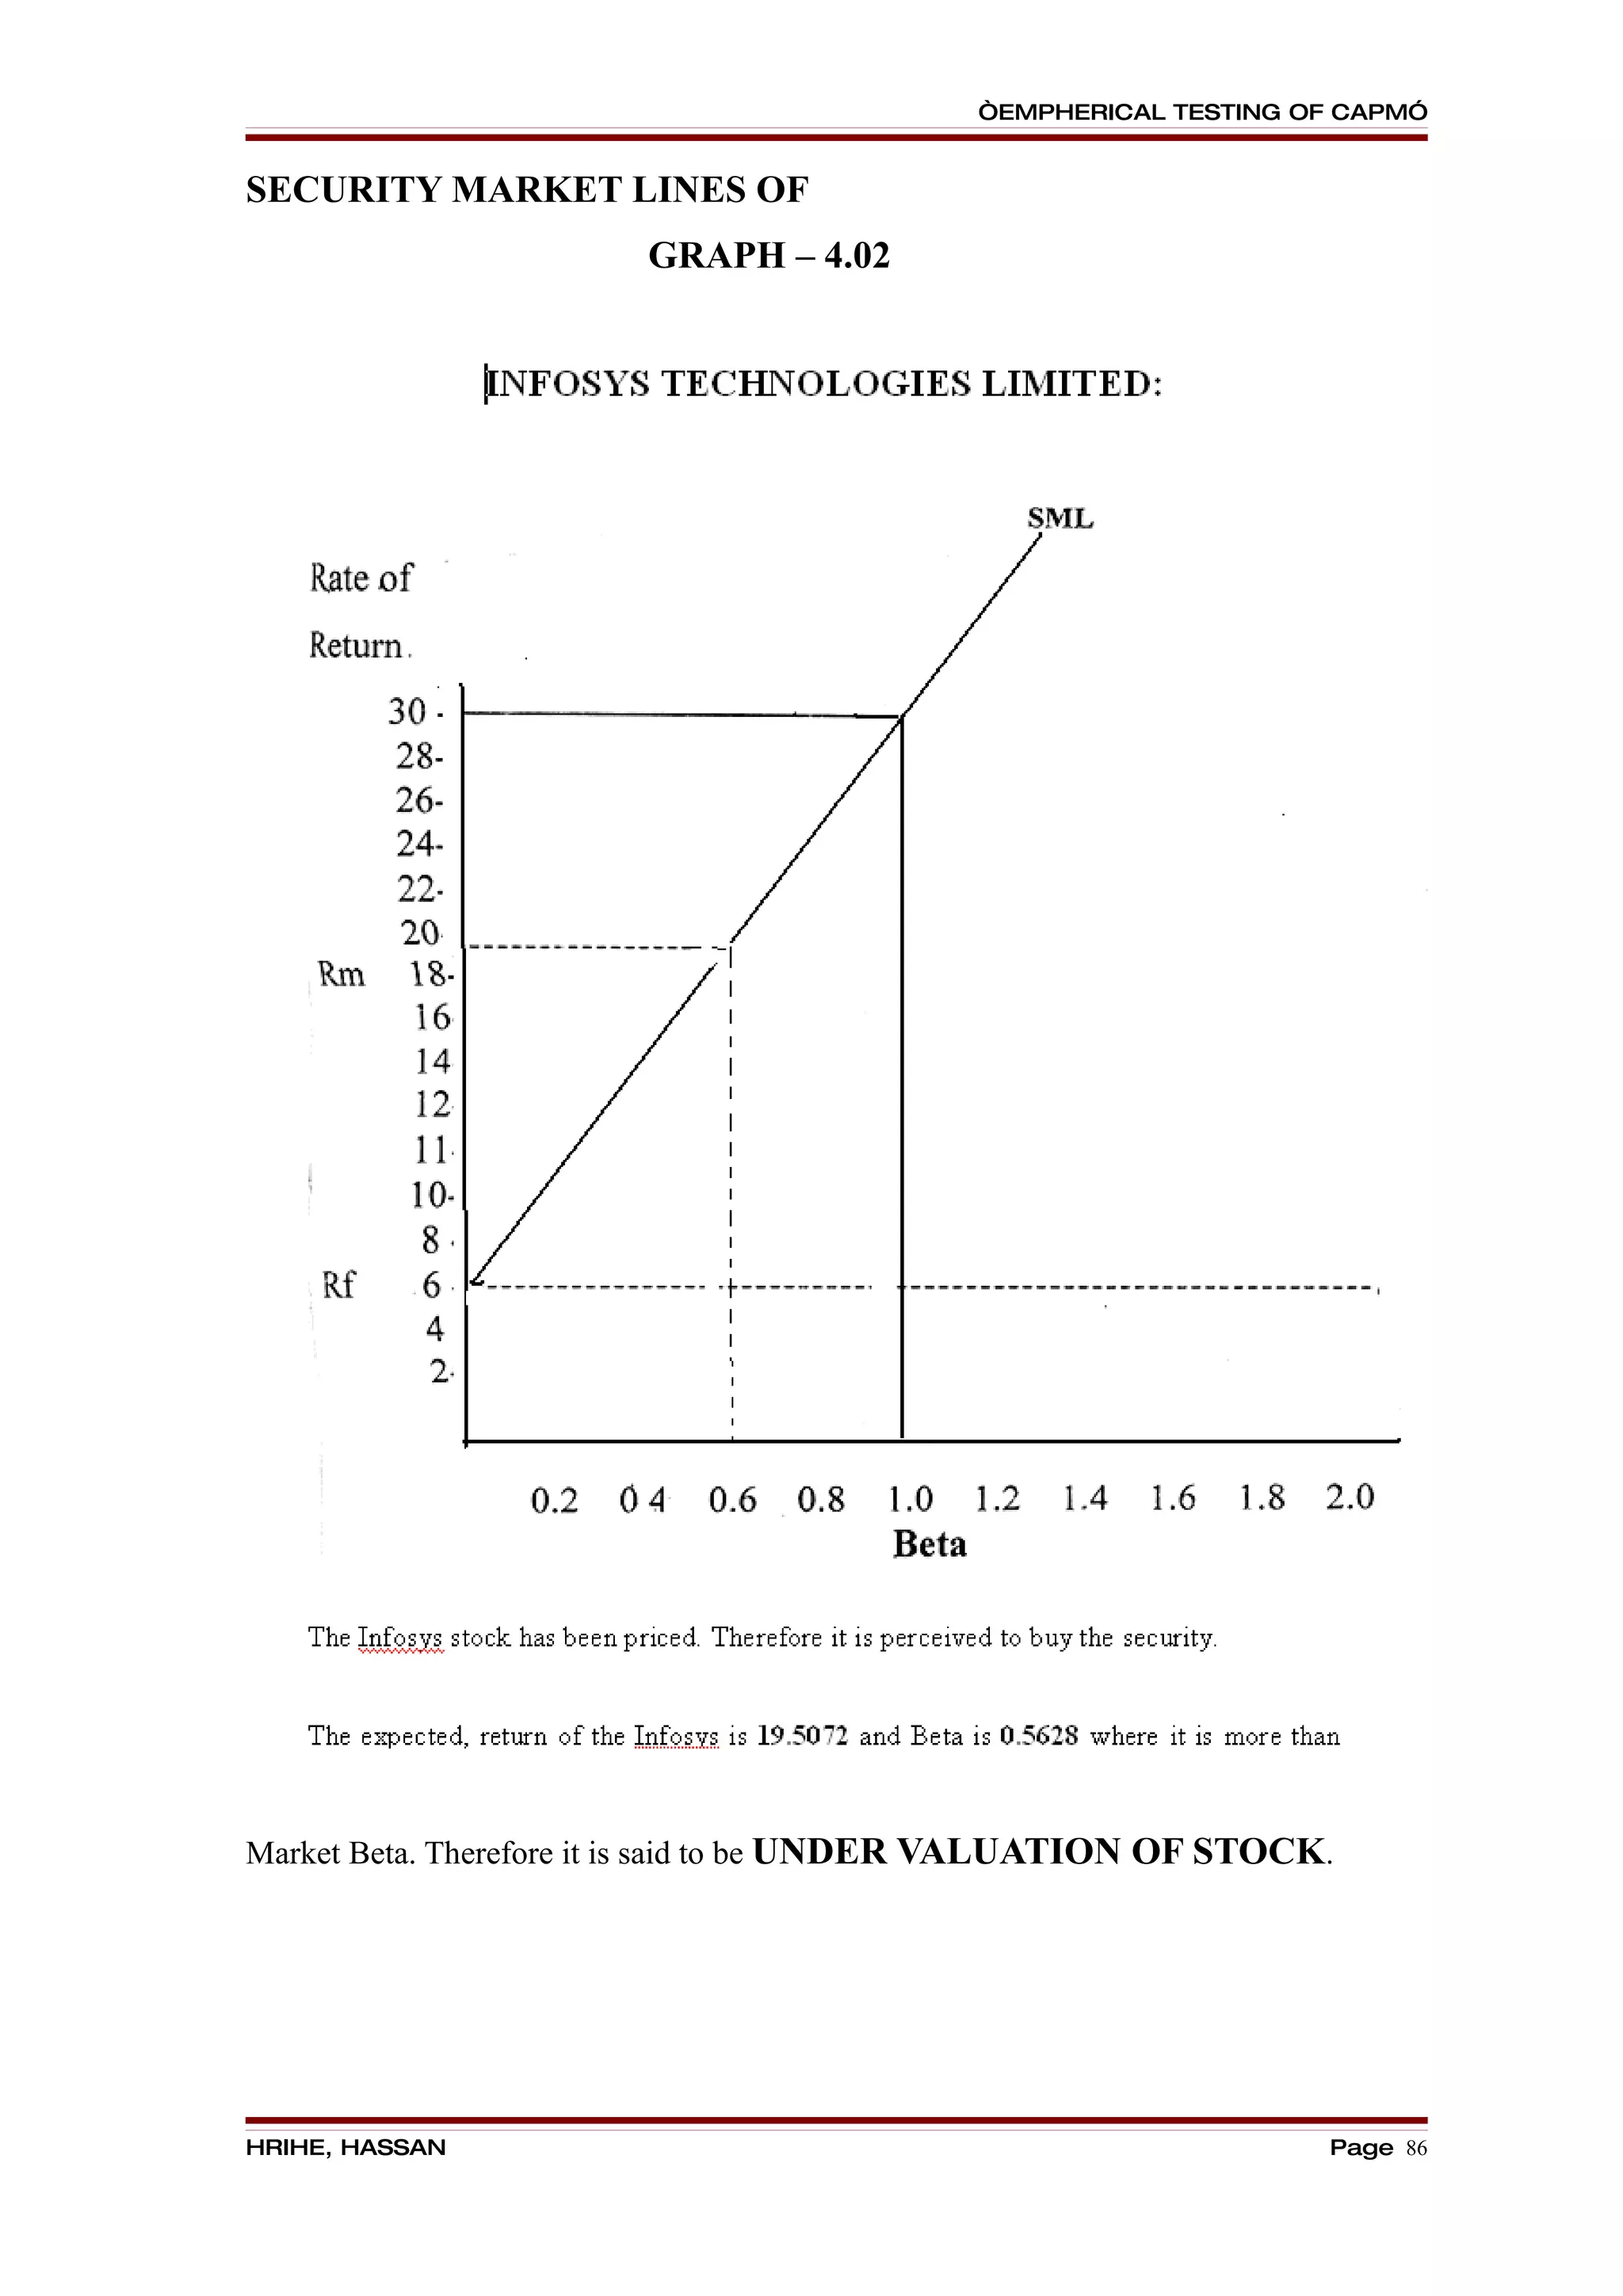
The Infosys stock has been priced. Therefore it is perceived by the security. The
expected return of the Infosys is 19.5072 and the beta is 0.5628, where it is more than
HRIHE, HASSAN Page 89](https://image.slidesharecdn.com/astudyonemphericaltestingofcapitalassetpricingmodel-100924143213-phpapp02/75/A-study-on-empherical-testing-of-capital-asset-pricing-model-89-2048.jpg)
![“EMPHERICAL TESTING OF CAPM”
the market beta, therefore it is said to be “ UNDER VALUATION OF STOCK”.
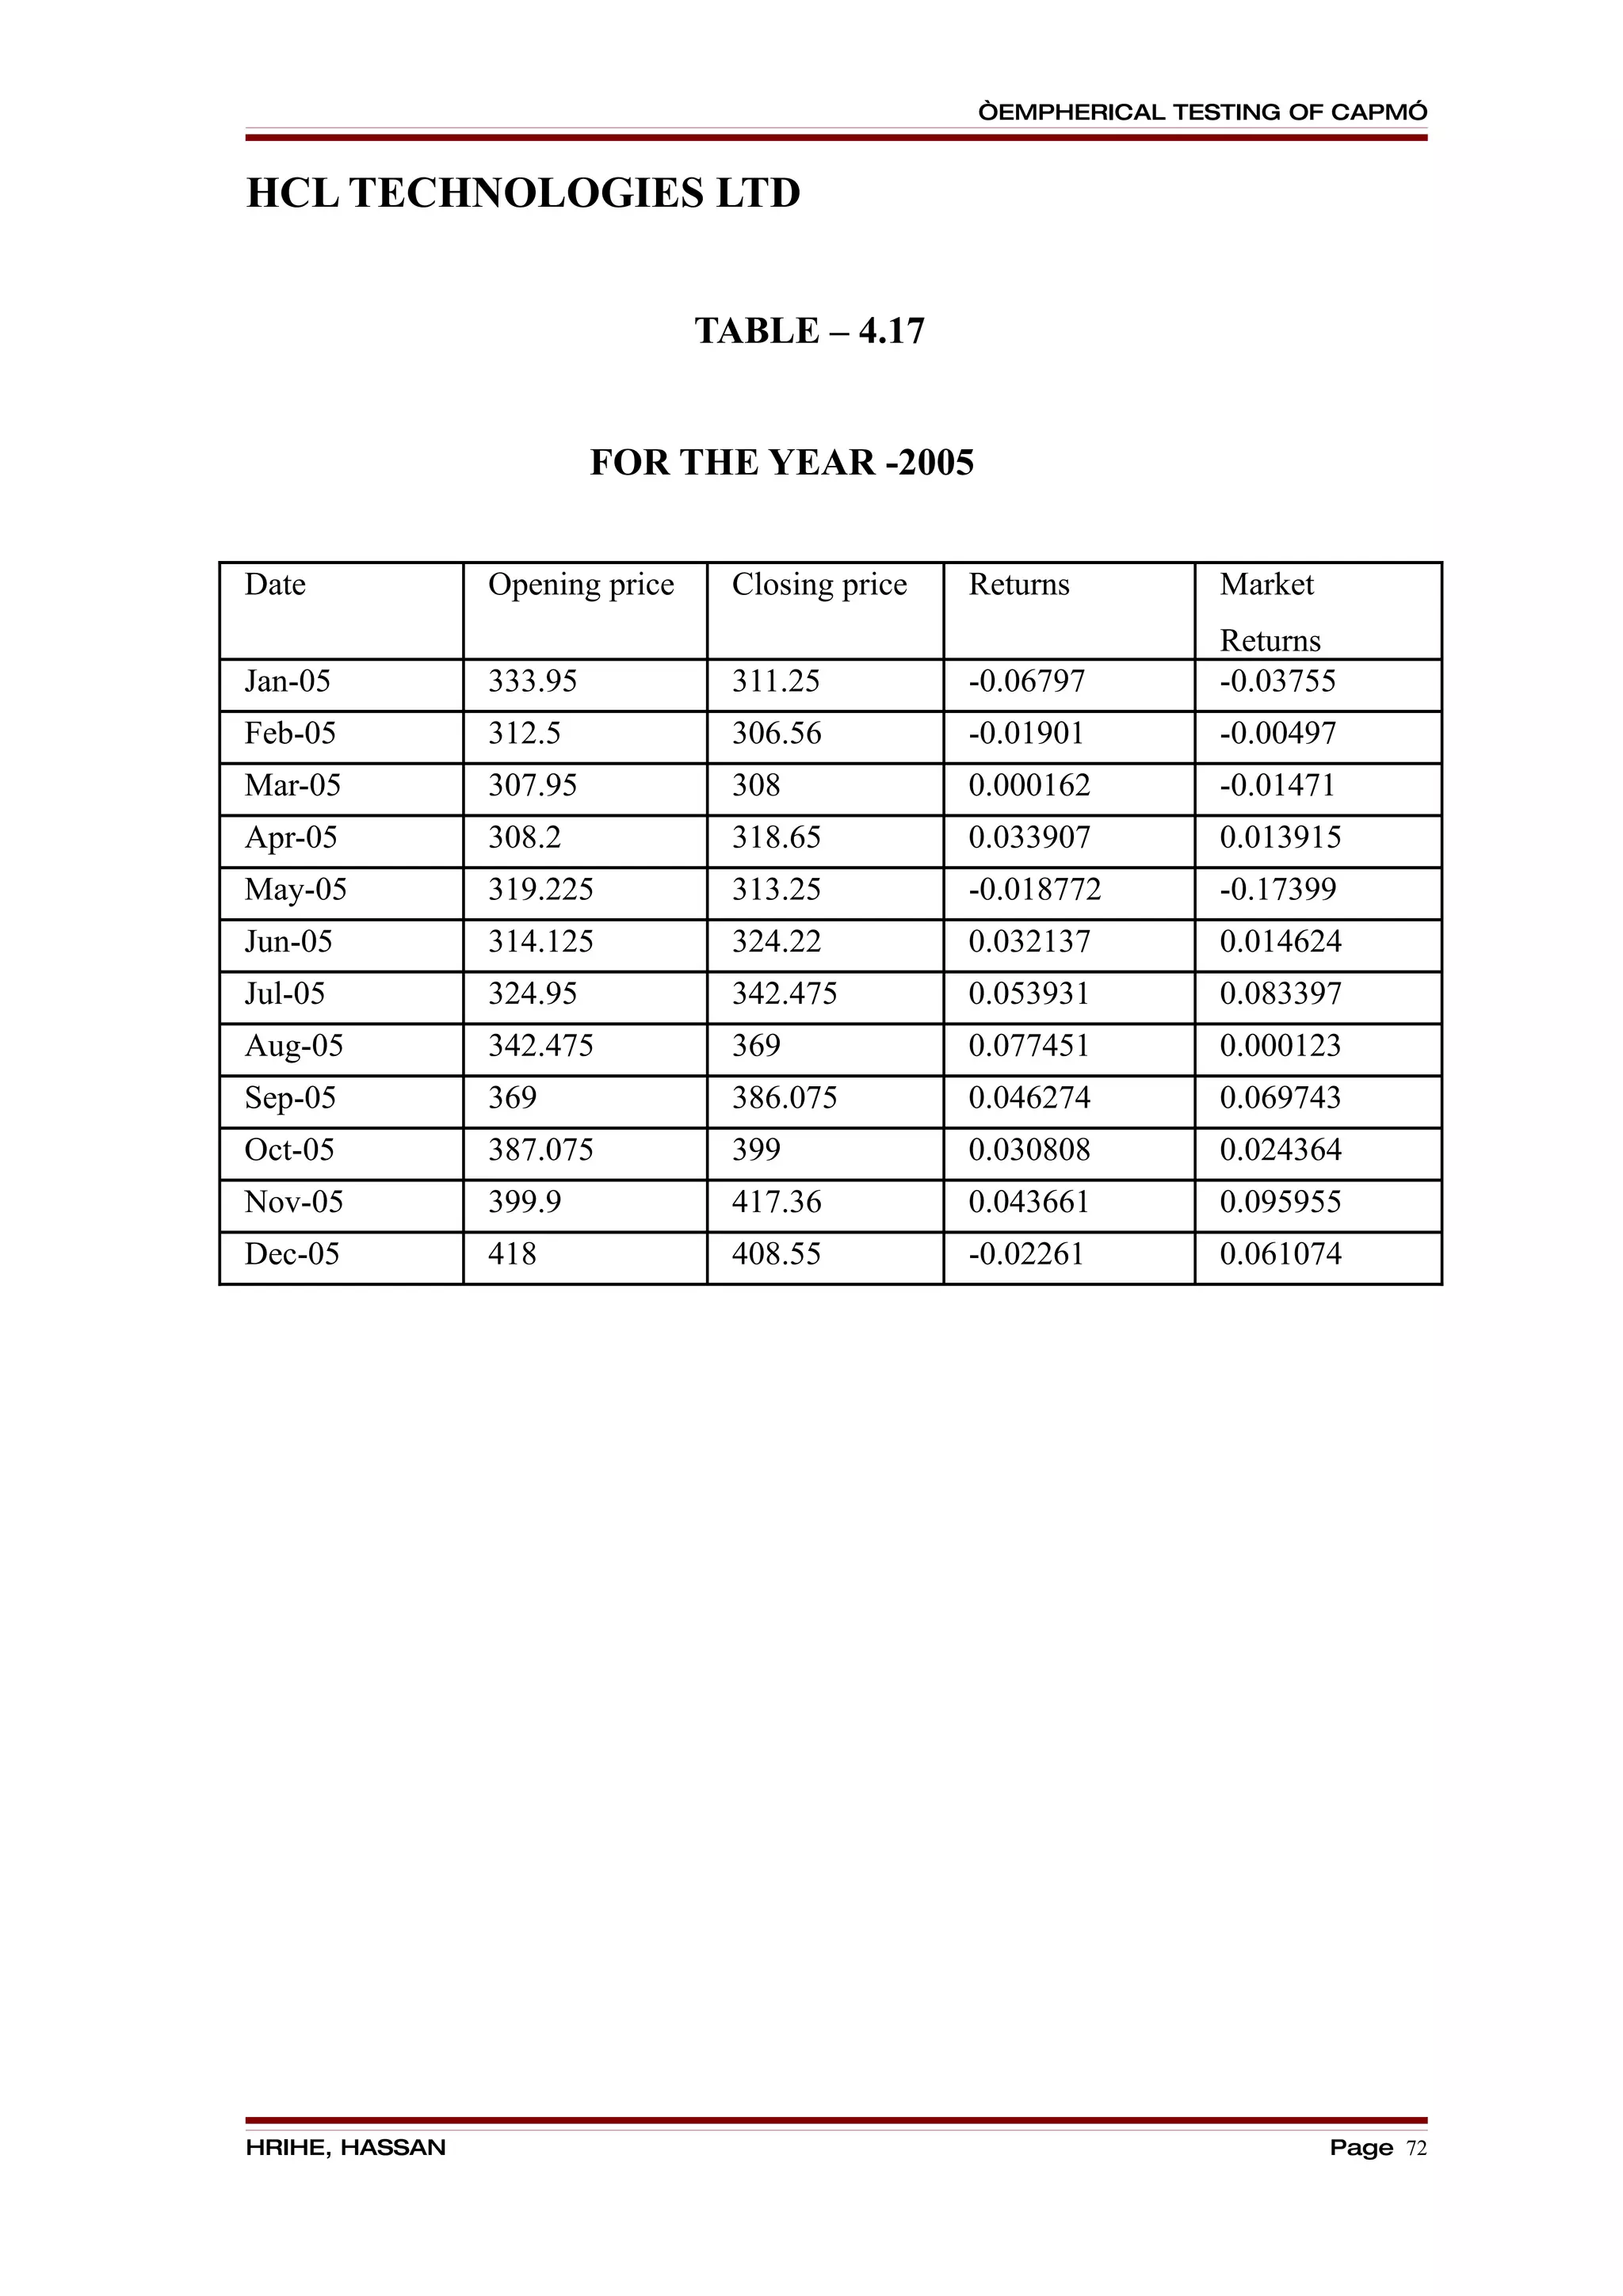
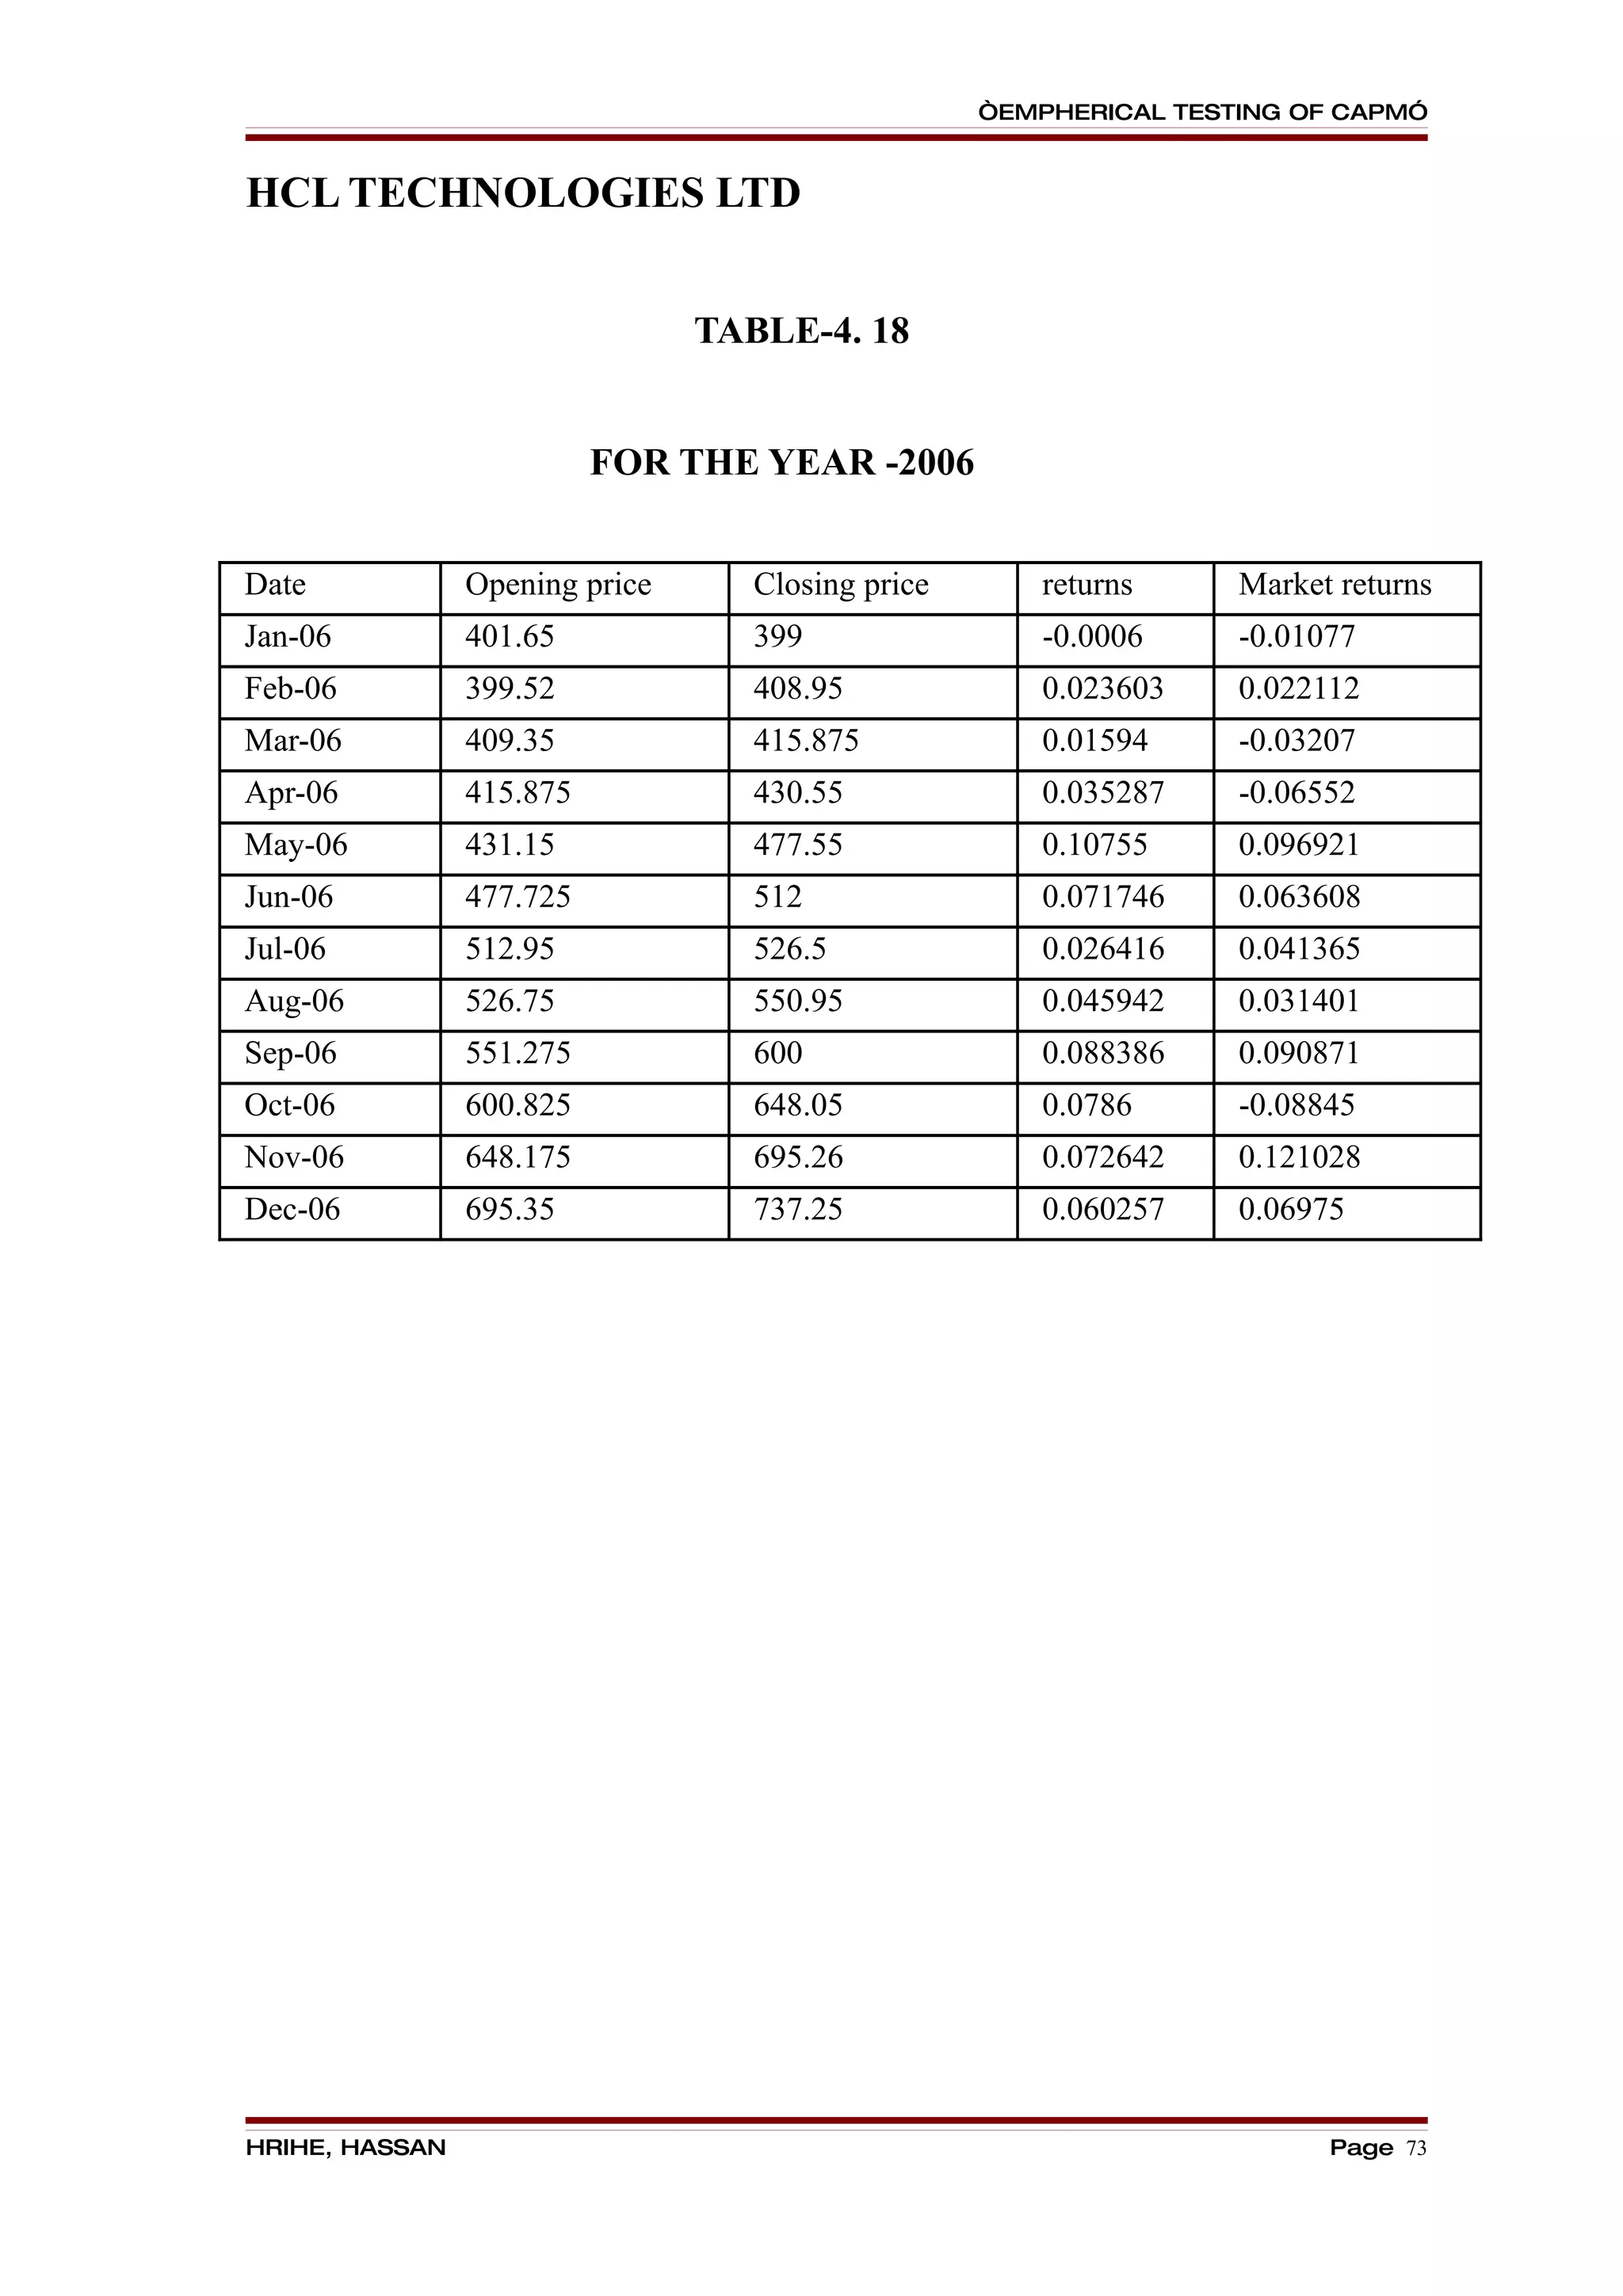
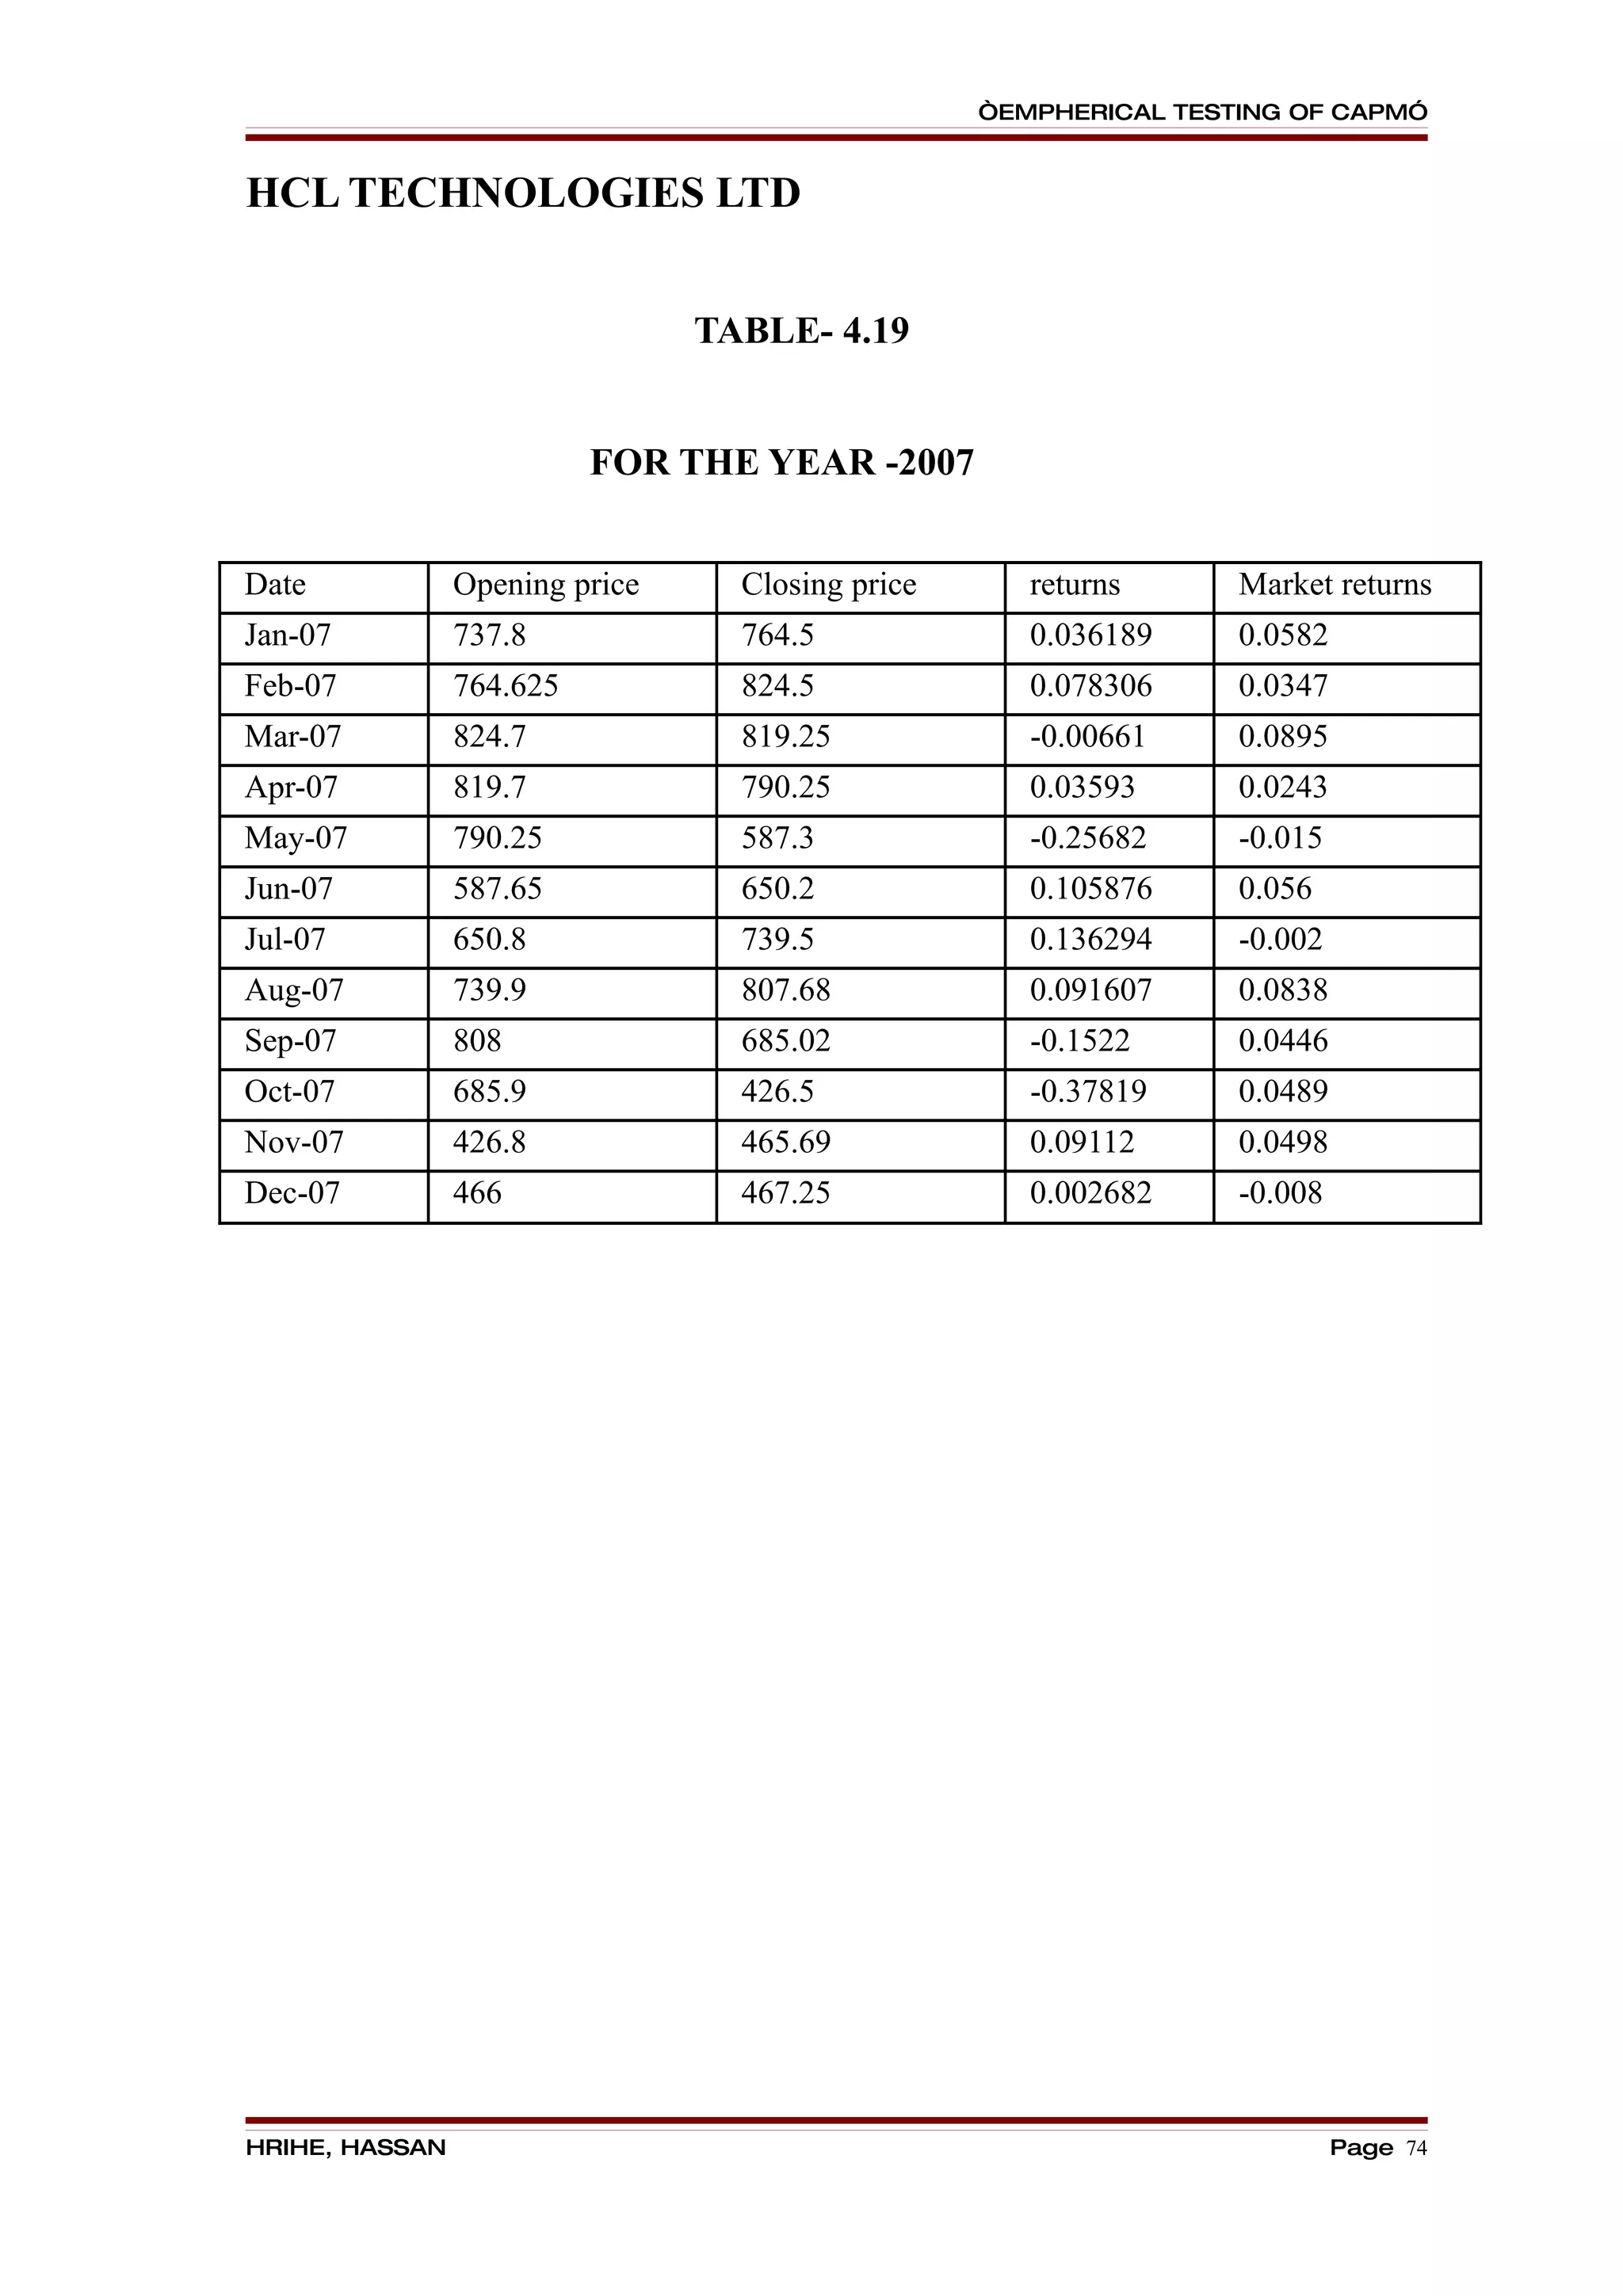
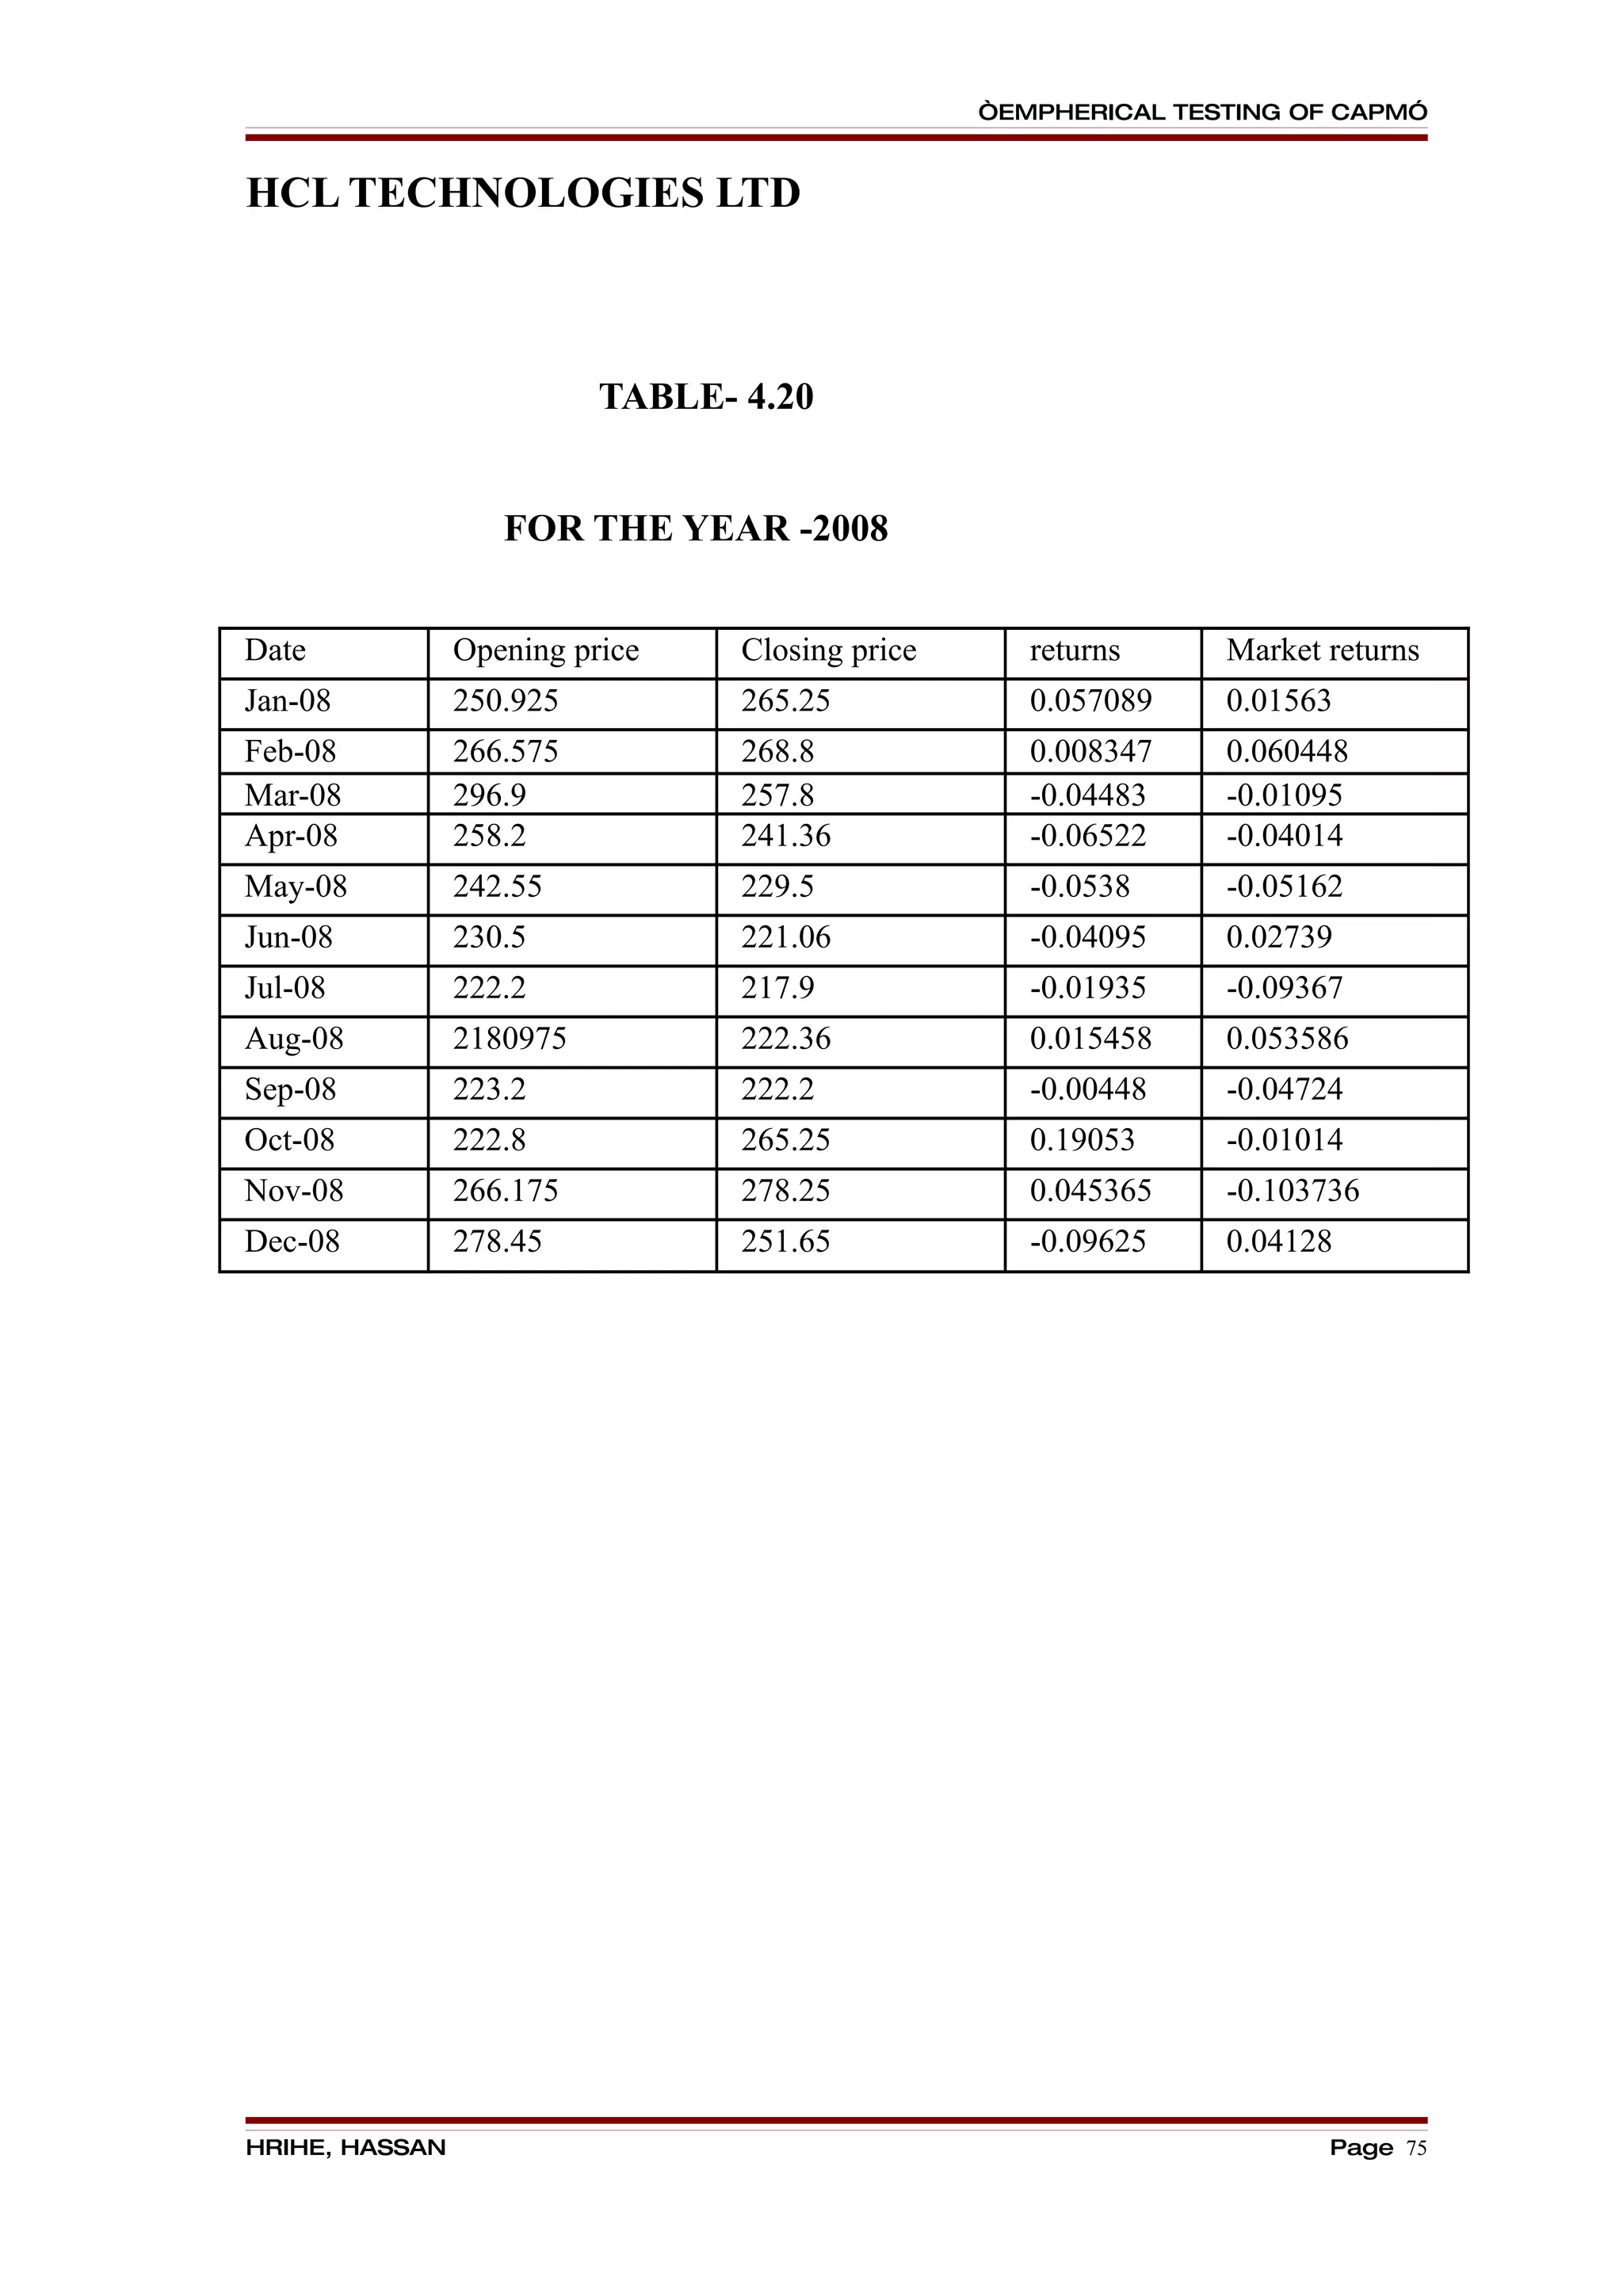
C] HCL TECHNOLOGIES LTD:
The data has been analysed by using Beta, Expected return, Security Market Line.
The Beta and Expected Return has been calculated on for 1st January And by taking of
12 months. The analysis has been done by taking exchange rate as independent variable
and company share price for 12 months. In the similar way, index is taken as independent
variable and its impact on exchange rate for 12 months.
From the above data of HCL Technologies ltd, it is clear that, in the of 2005-2009 ,
the stock has been over priced. Therefore it is perceived as unfair to buy the security.
The expected return on HCL technologies is 18.672 and the beta is 0.5289, where
it is less than the market beta, therefore it is said to be “OVER VALUATION OF
STOCK”.
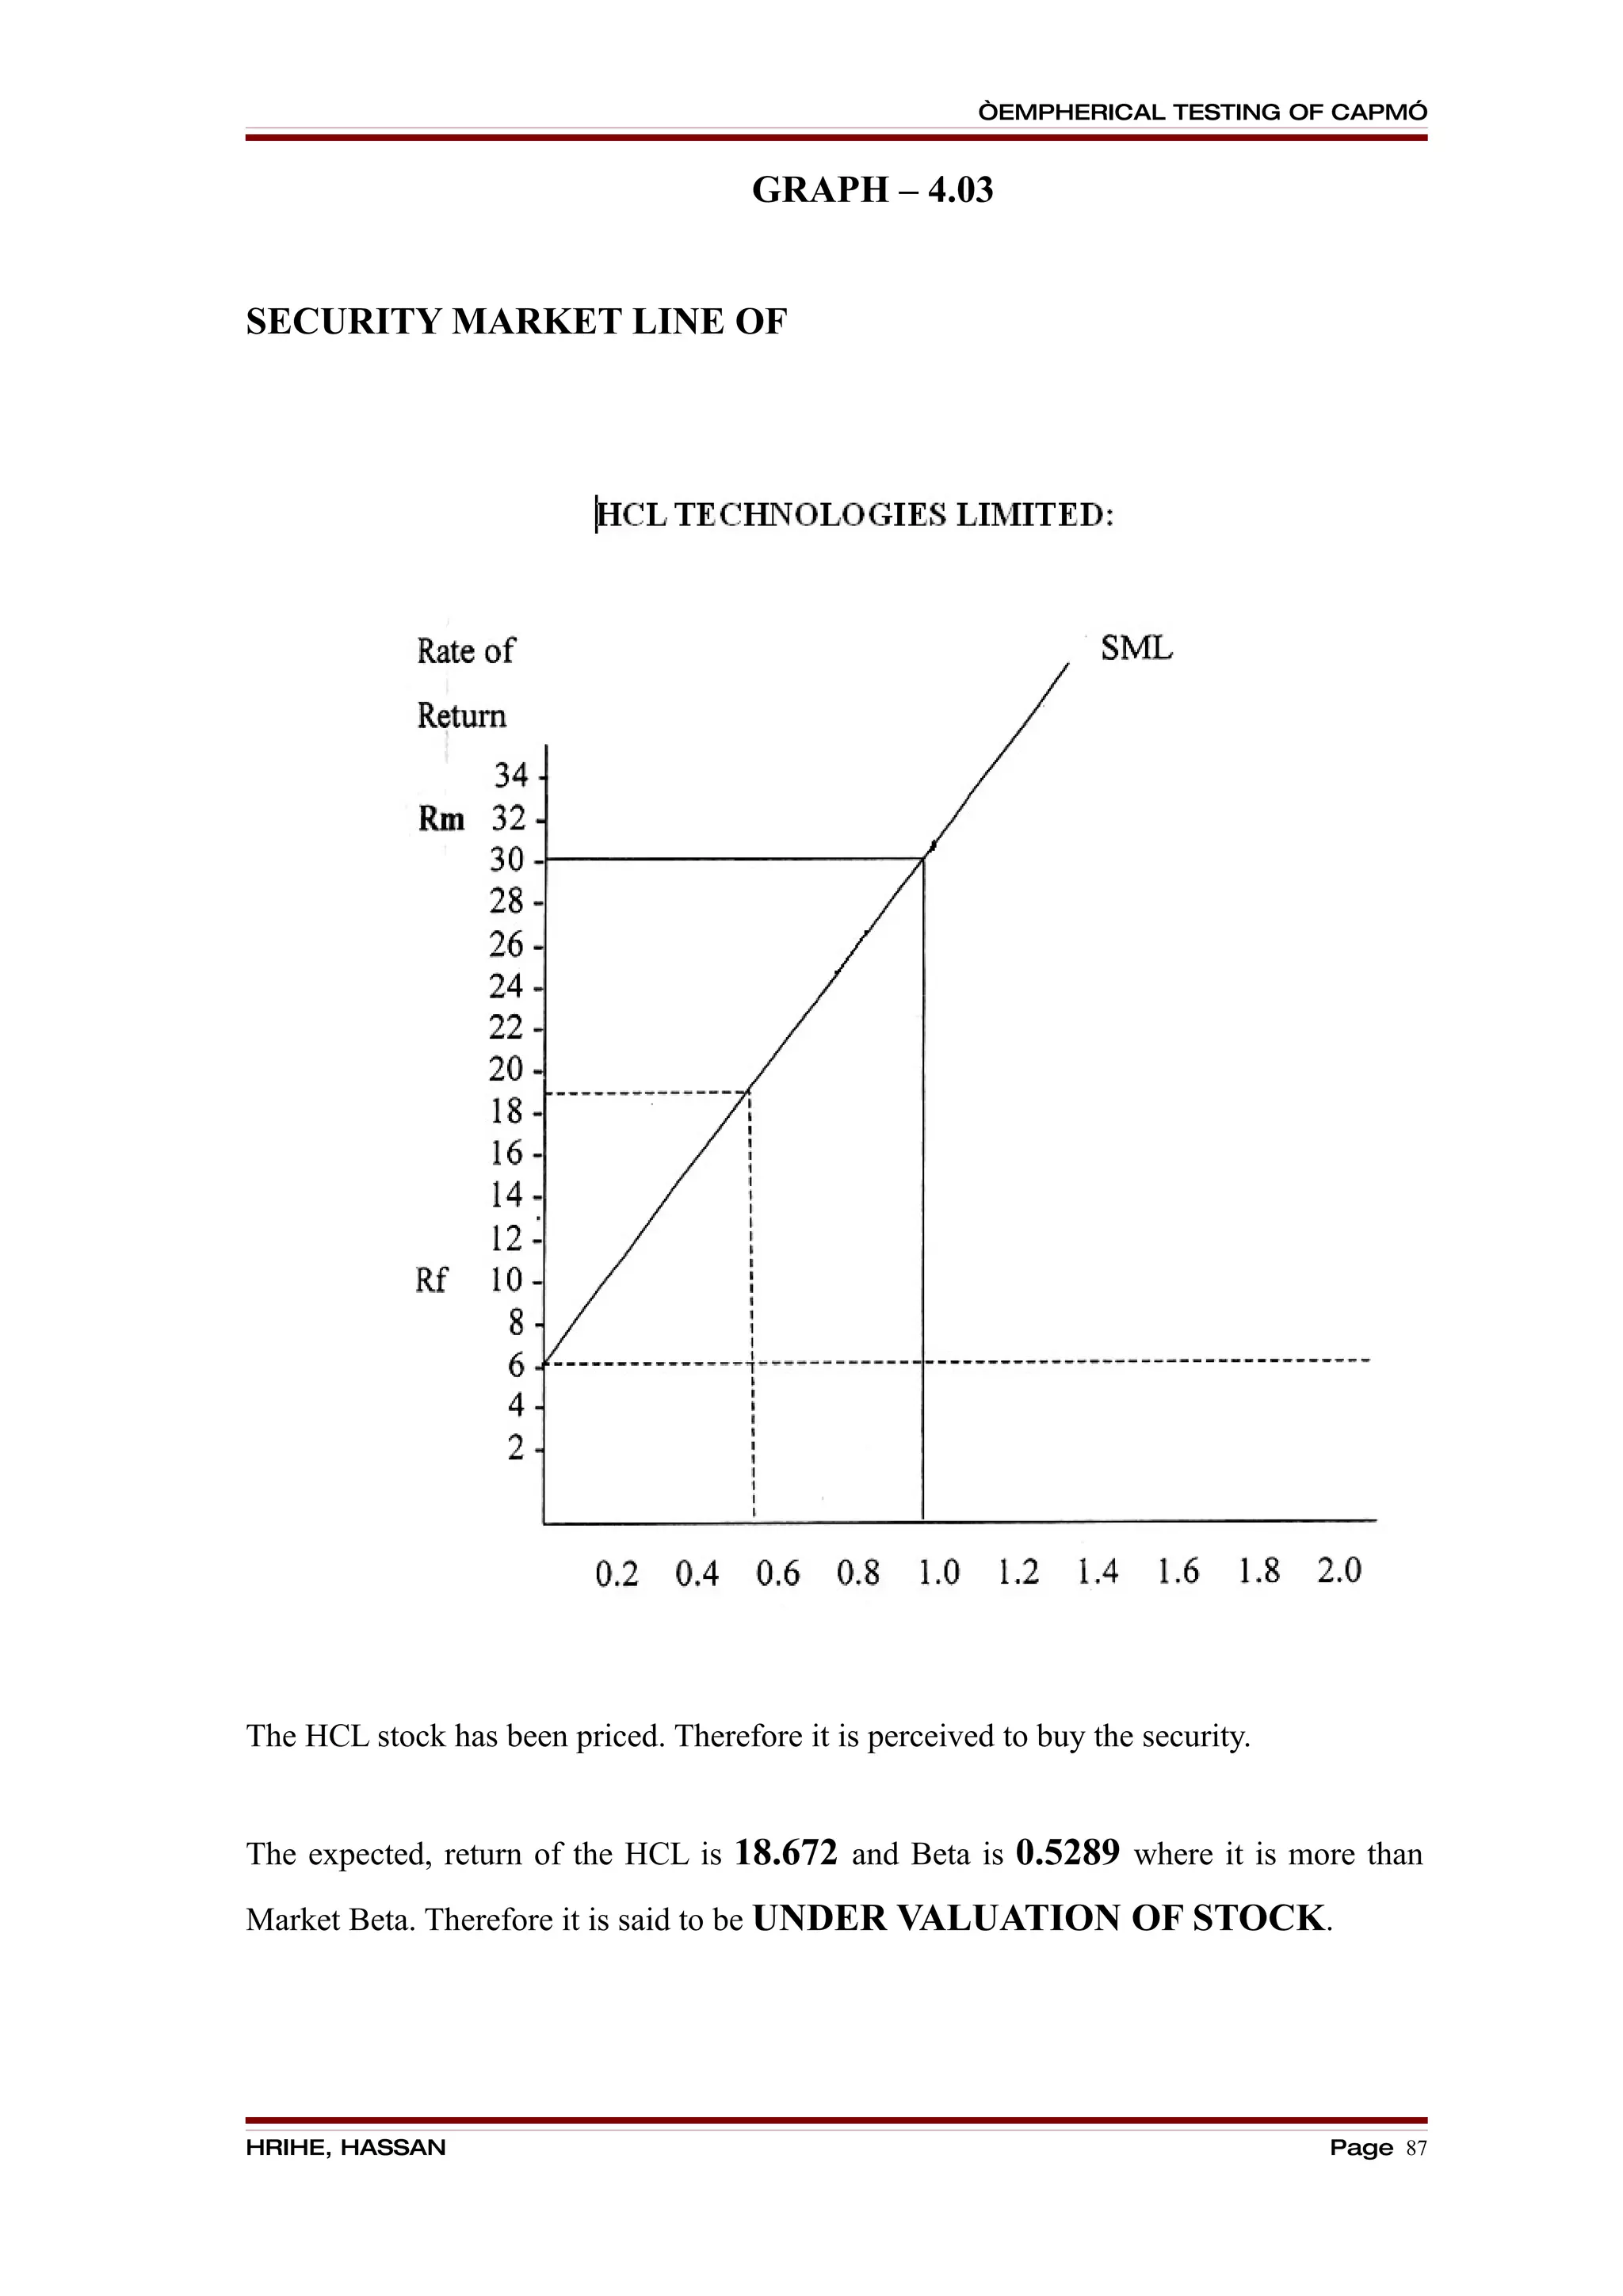
The HCL stock has been priced. Therefore it is perceived by the security. The
expected return of the HCL is 18.672 and the beta is 0.5289, where it is more than the
market beta, therefore it is said to be “ UNDER VALUATION OF STOCK”.
D] TATA CONSULTANCY SERVICE LTD:
The data has been analysed by using Beta, Expected return, Security Market Line.
The Beta and Expected Return has been calculated on for 1st January And by taking of
12 months. The analysis has been done by taking exchange rate as independent variable
and company share price for 12 months. In the similar way, index is taken as independent
variable and its impact on exchange rate for 12 months.
From the above data of TCS ltd, it is clear that, in the of 2005-2009 , the stock has
been over priced. Therefore it is perceived as unfair to buy the security.
The expected return on TCS is 9.4848 and the beta is 0.1452, where it is less than
the market beta, therefore it is said to be “OVER VALUATION OF STOCK”.
HRIHE, HASSAN Page 90](https://image.slidesharecdn.com/astudyonemphericaltestingofcapitalassetpricingmodel-100924143213-phpapp02/75/A-study-on-empherical-testing-of-capital-asset-pricing-model-90-2048.jpg)
![“EMPHERICAL TESTING OF CAPM”
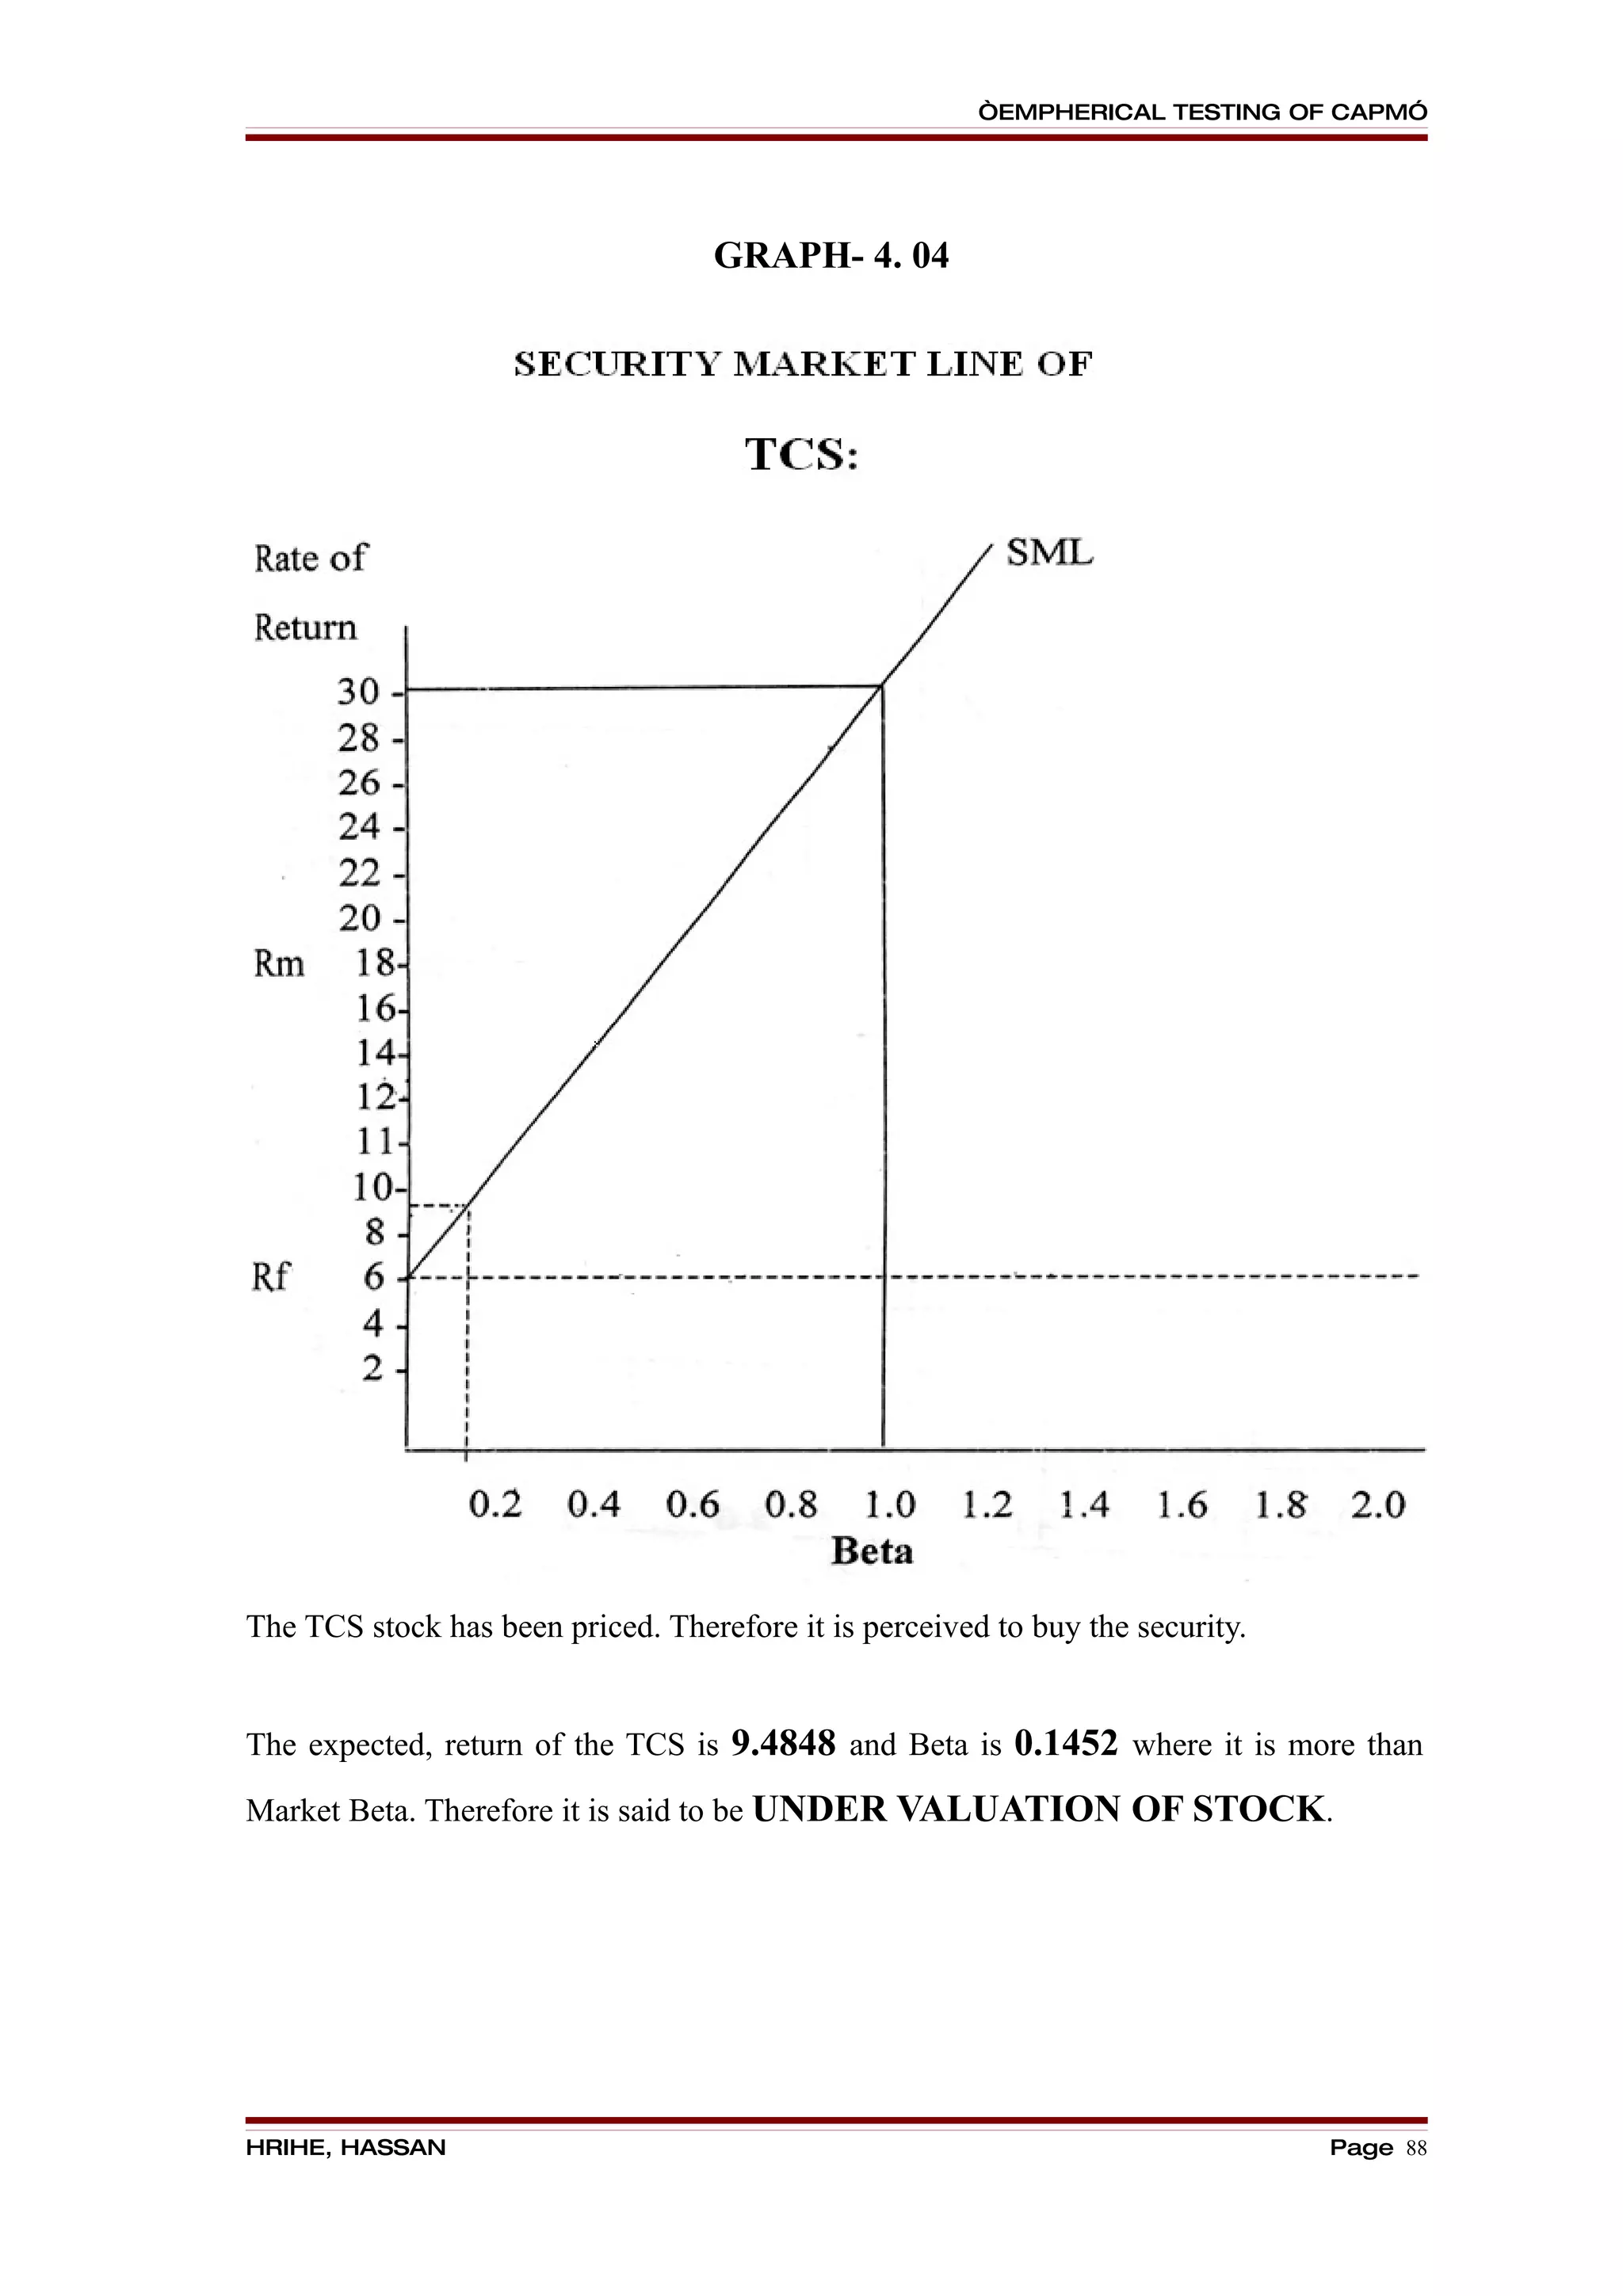
The TCS stock has been priced. Therefore it is perceived by the security. The
expected return of the TCS is 9.4848 and the beta is 0.1452 , where it is more than the
market beta, therefore it is said to be “ UNDER VALUATION OF STOCK”.
FINDINGS:
FORMULA USED FOR CALCUTIONS
CALCULATION OF EXPECTED RETURN:
Rj = Rf + β ∗ [E(Rm) - Rf]
CALCULATION OF BETA
COV (RJ ∗ RM)
β= _______________
σM2
Beta is calculated by using SPSS Software
Firms Expected Return Beta
Wipro Technologies ltd 16.4424 0.4351
Infosys Technologies ltd 19.5072 0.5628
HCL Technologies ltd 18.672 0.5289
TCS 9.4848 0.1452
AGGRESSIVE COMPANY DEFENSIVE COMPANY
HRIHE, HASSAN Page 91](https://image.slidesharecdn.com/astudyonemphericaltestingofcapitalassetpricingmodel-100924143213-phpapp02/75/A-study-on-empherical-testing-of-capital-asset-pricing-model-91-2048.jpg)


This document is a project report submitted to the University of Mysore in partial fulfillment of an MBA degree. It examines the empirical testing of the Capital Asset Pricing Model (CAPM) conducted at Asit C. Mehta Investment Intermediates Ltd in Hassan, India between 2008-2010. The report includes an introduction to the topic, literature review, company and industry profiles, data collection and interpretation, findings, suggestions and conclusions. The student conducted the research under the guidance of their project guide.