Downloaded 170 times
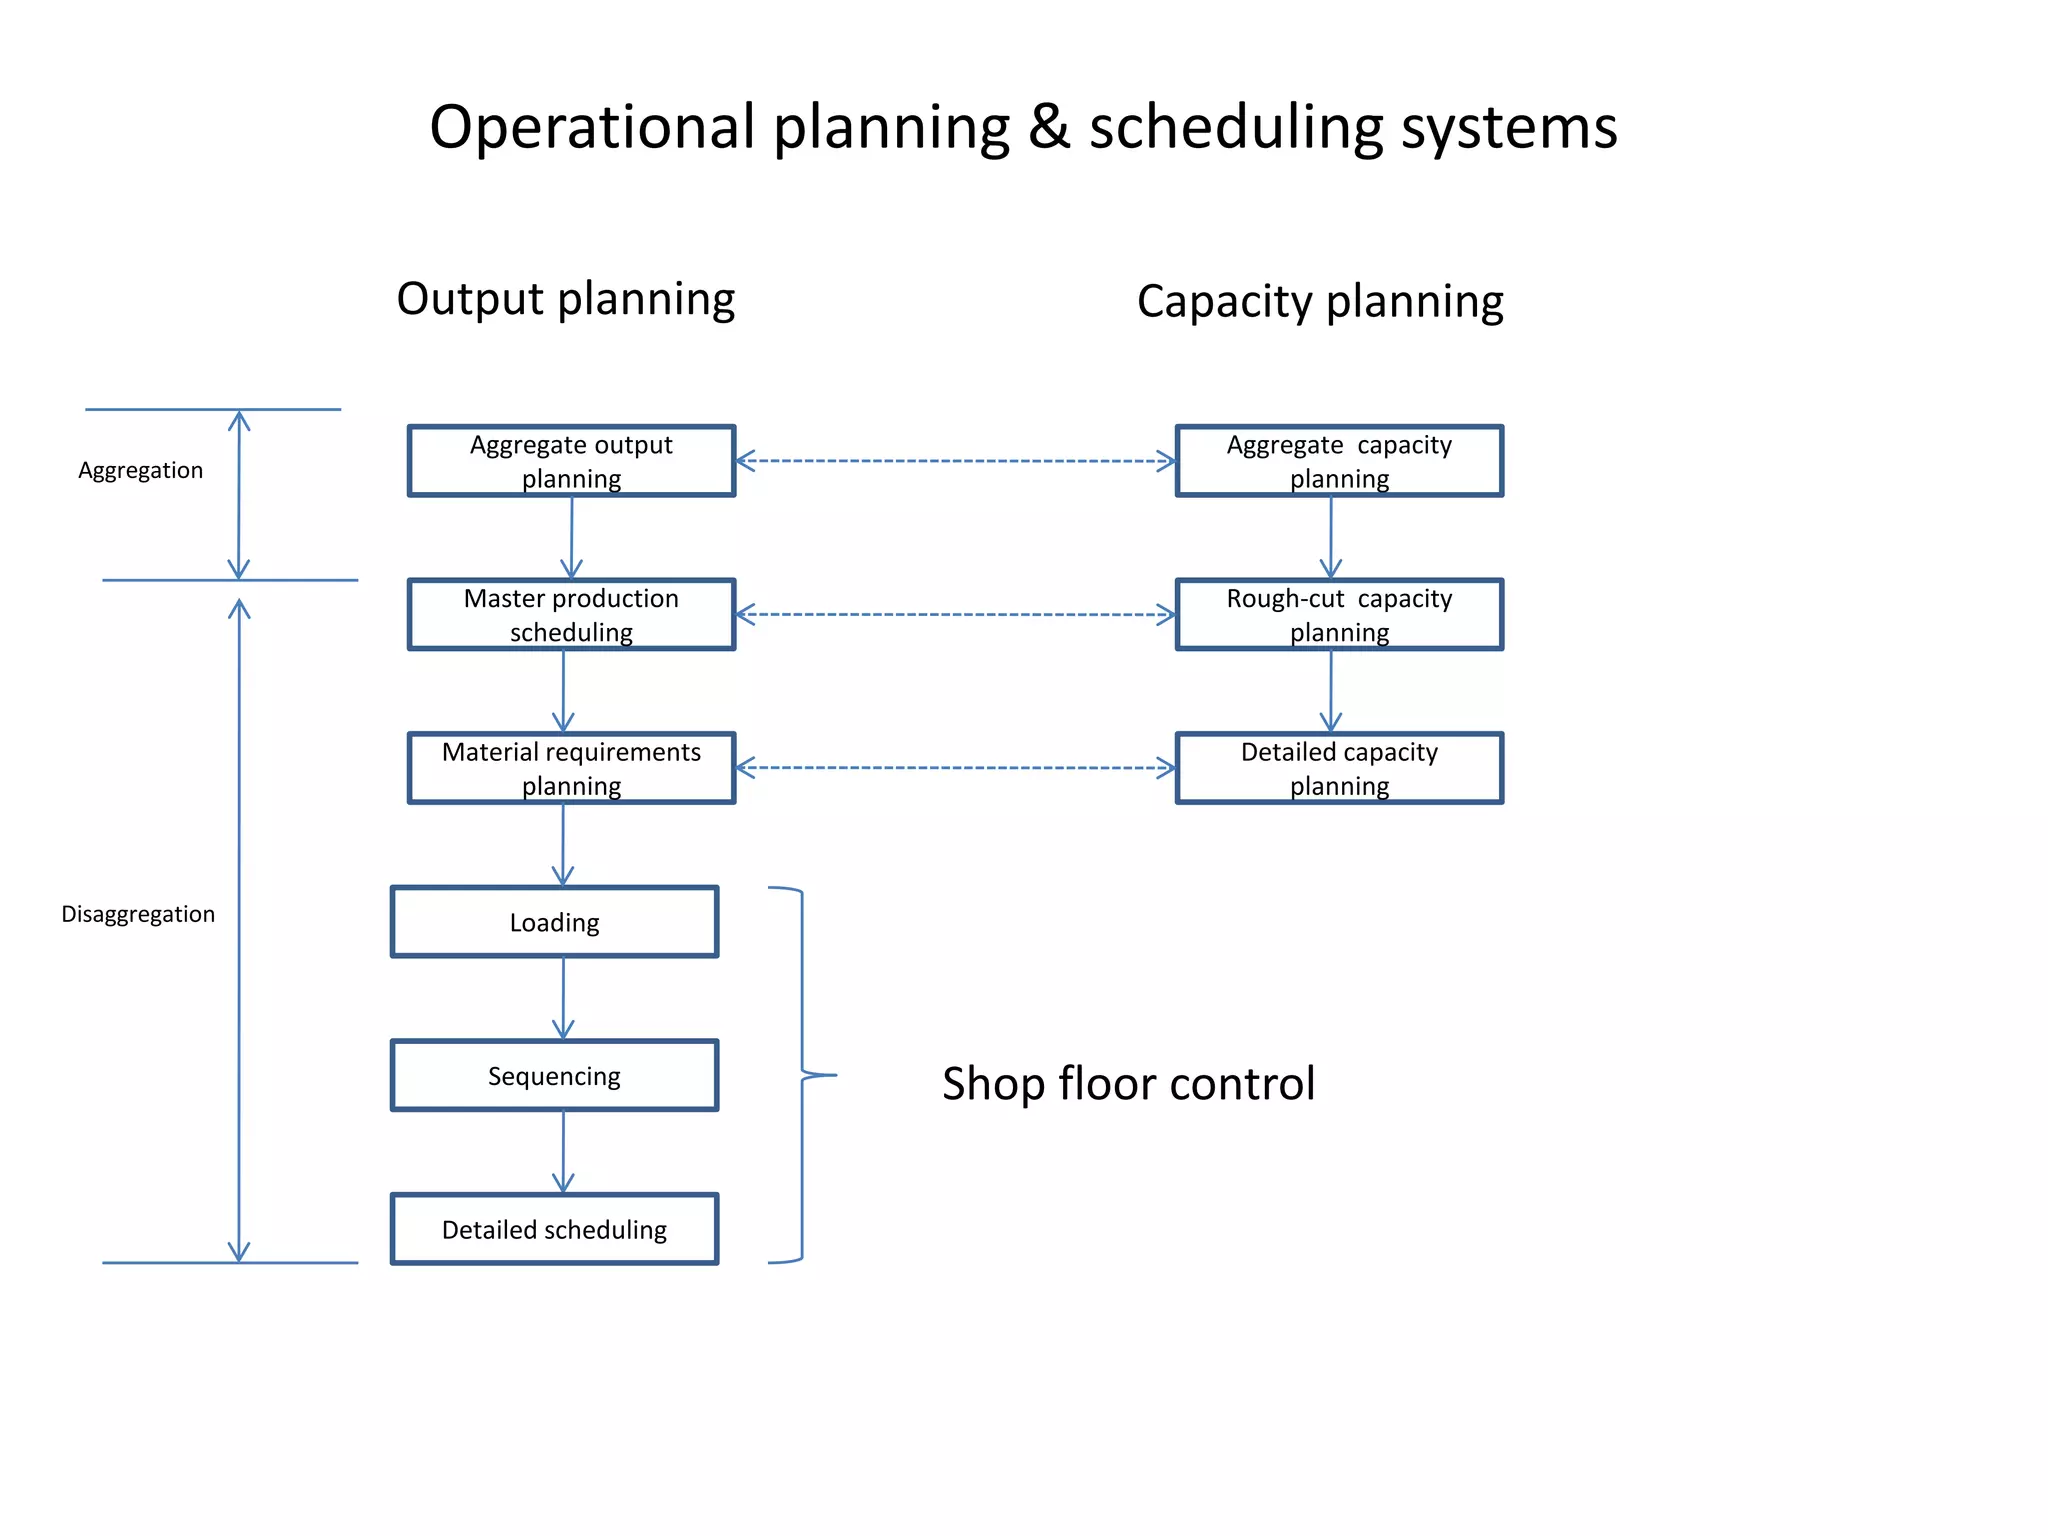
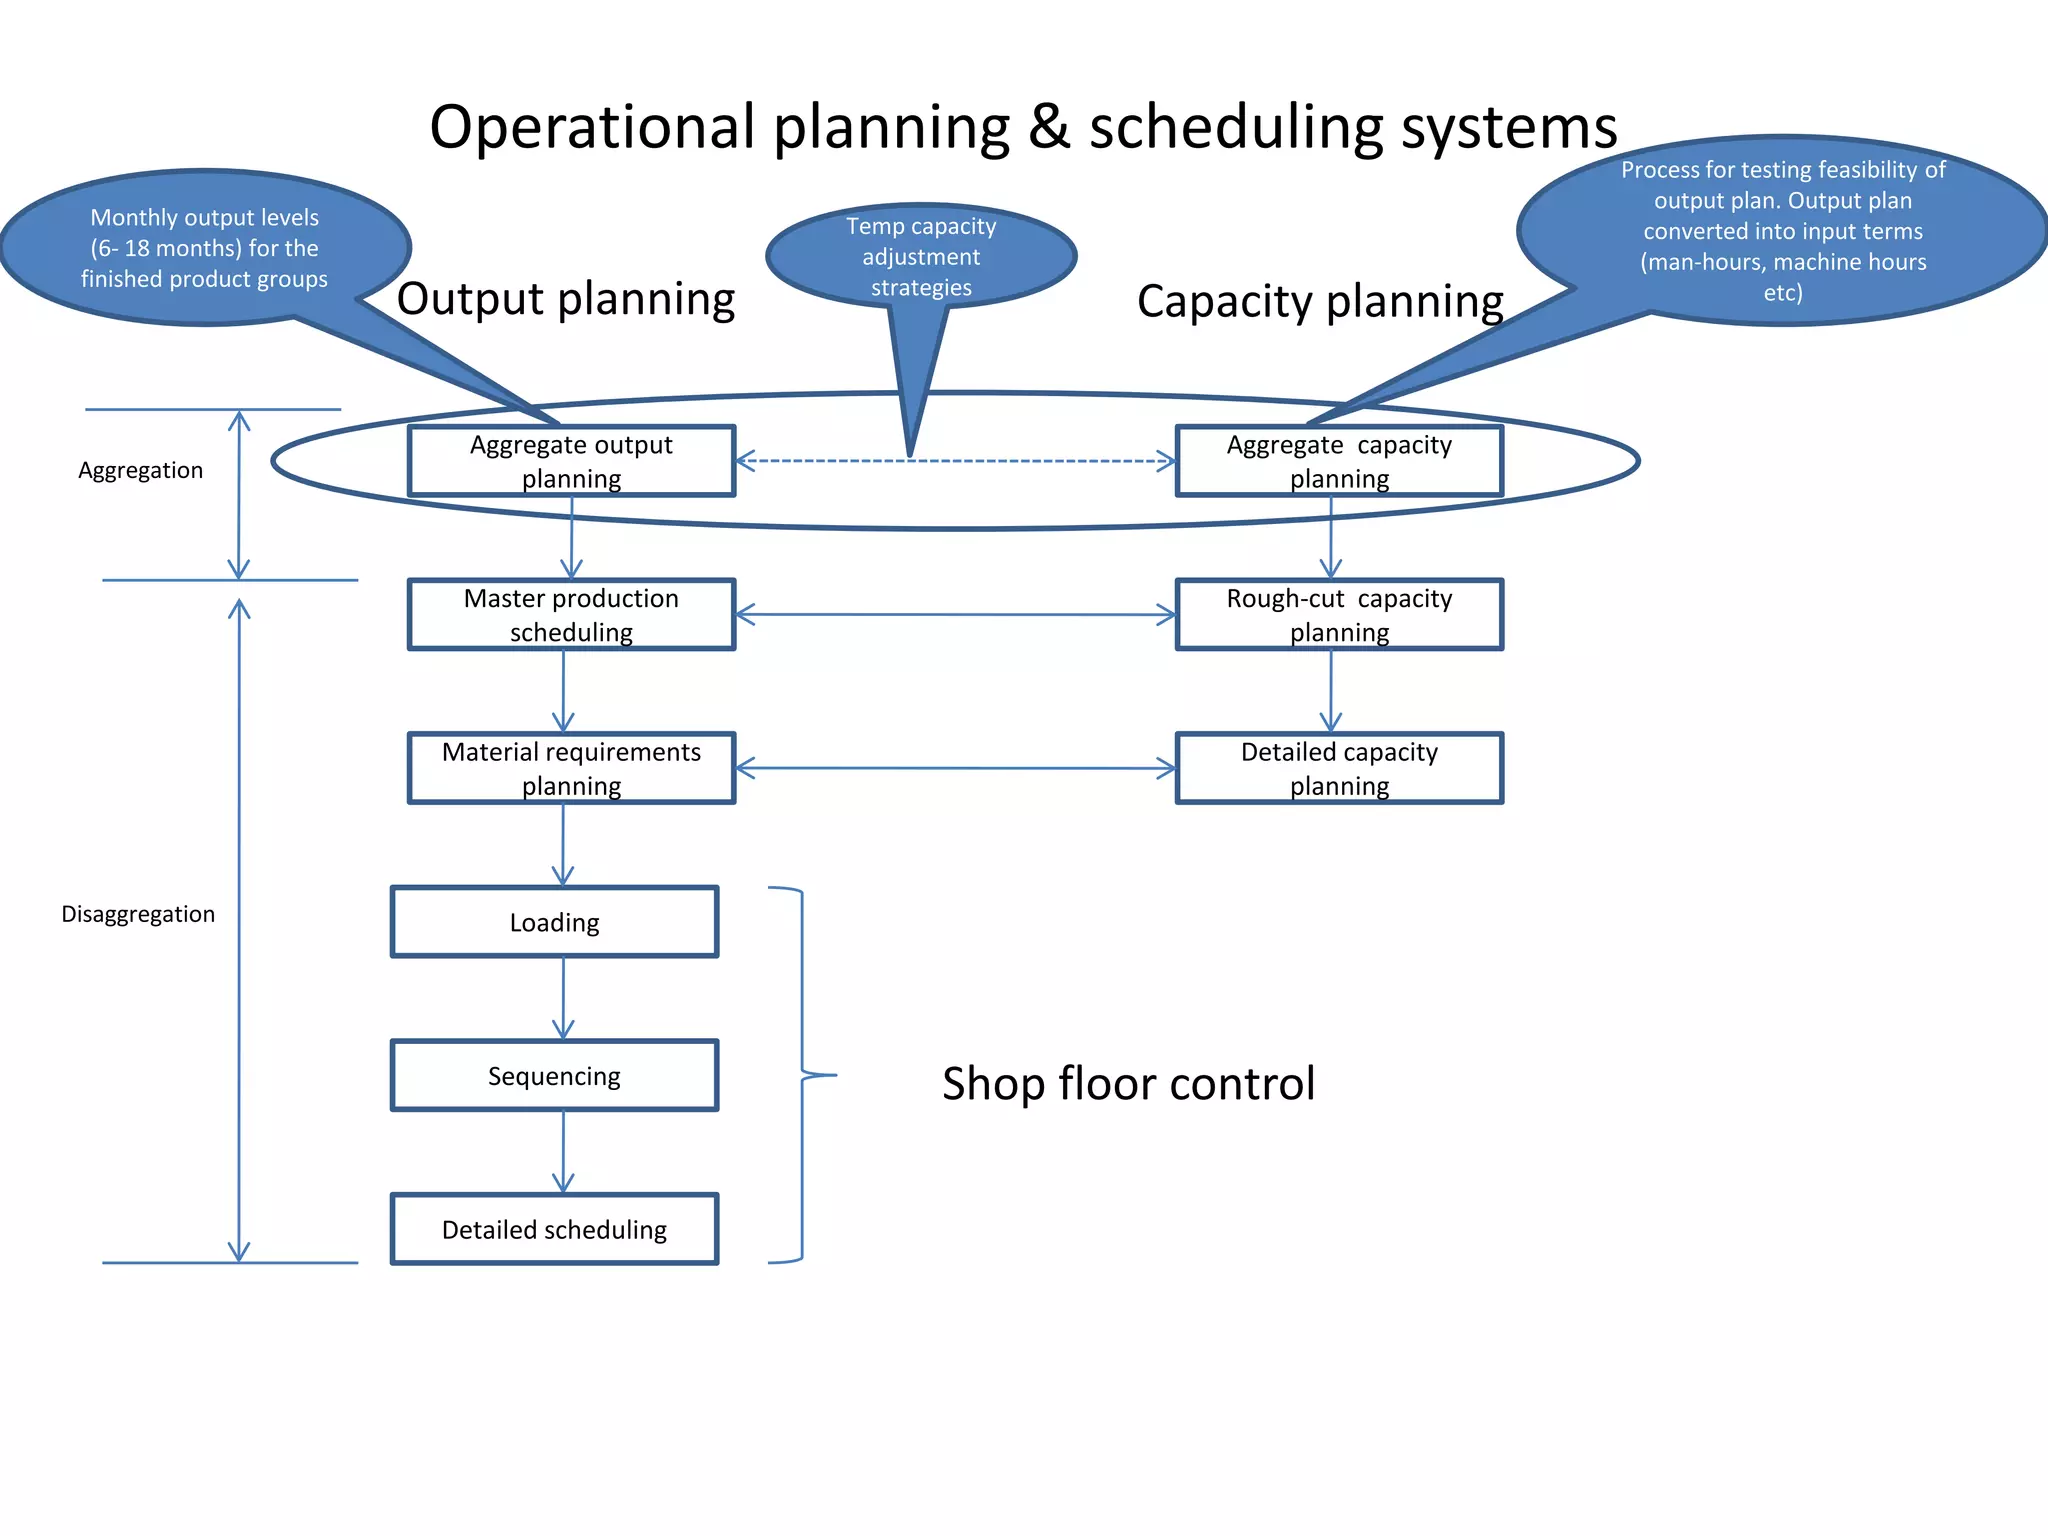
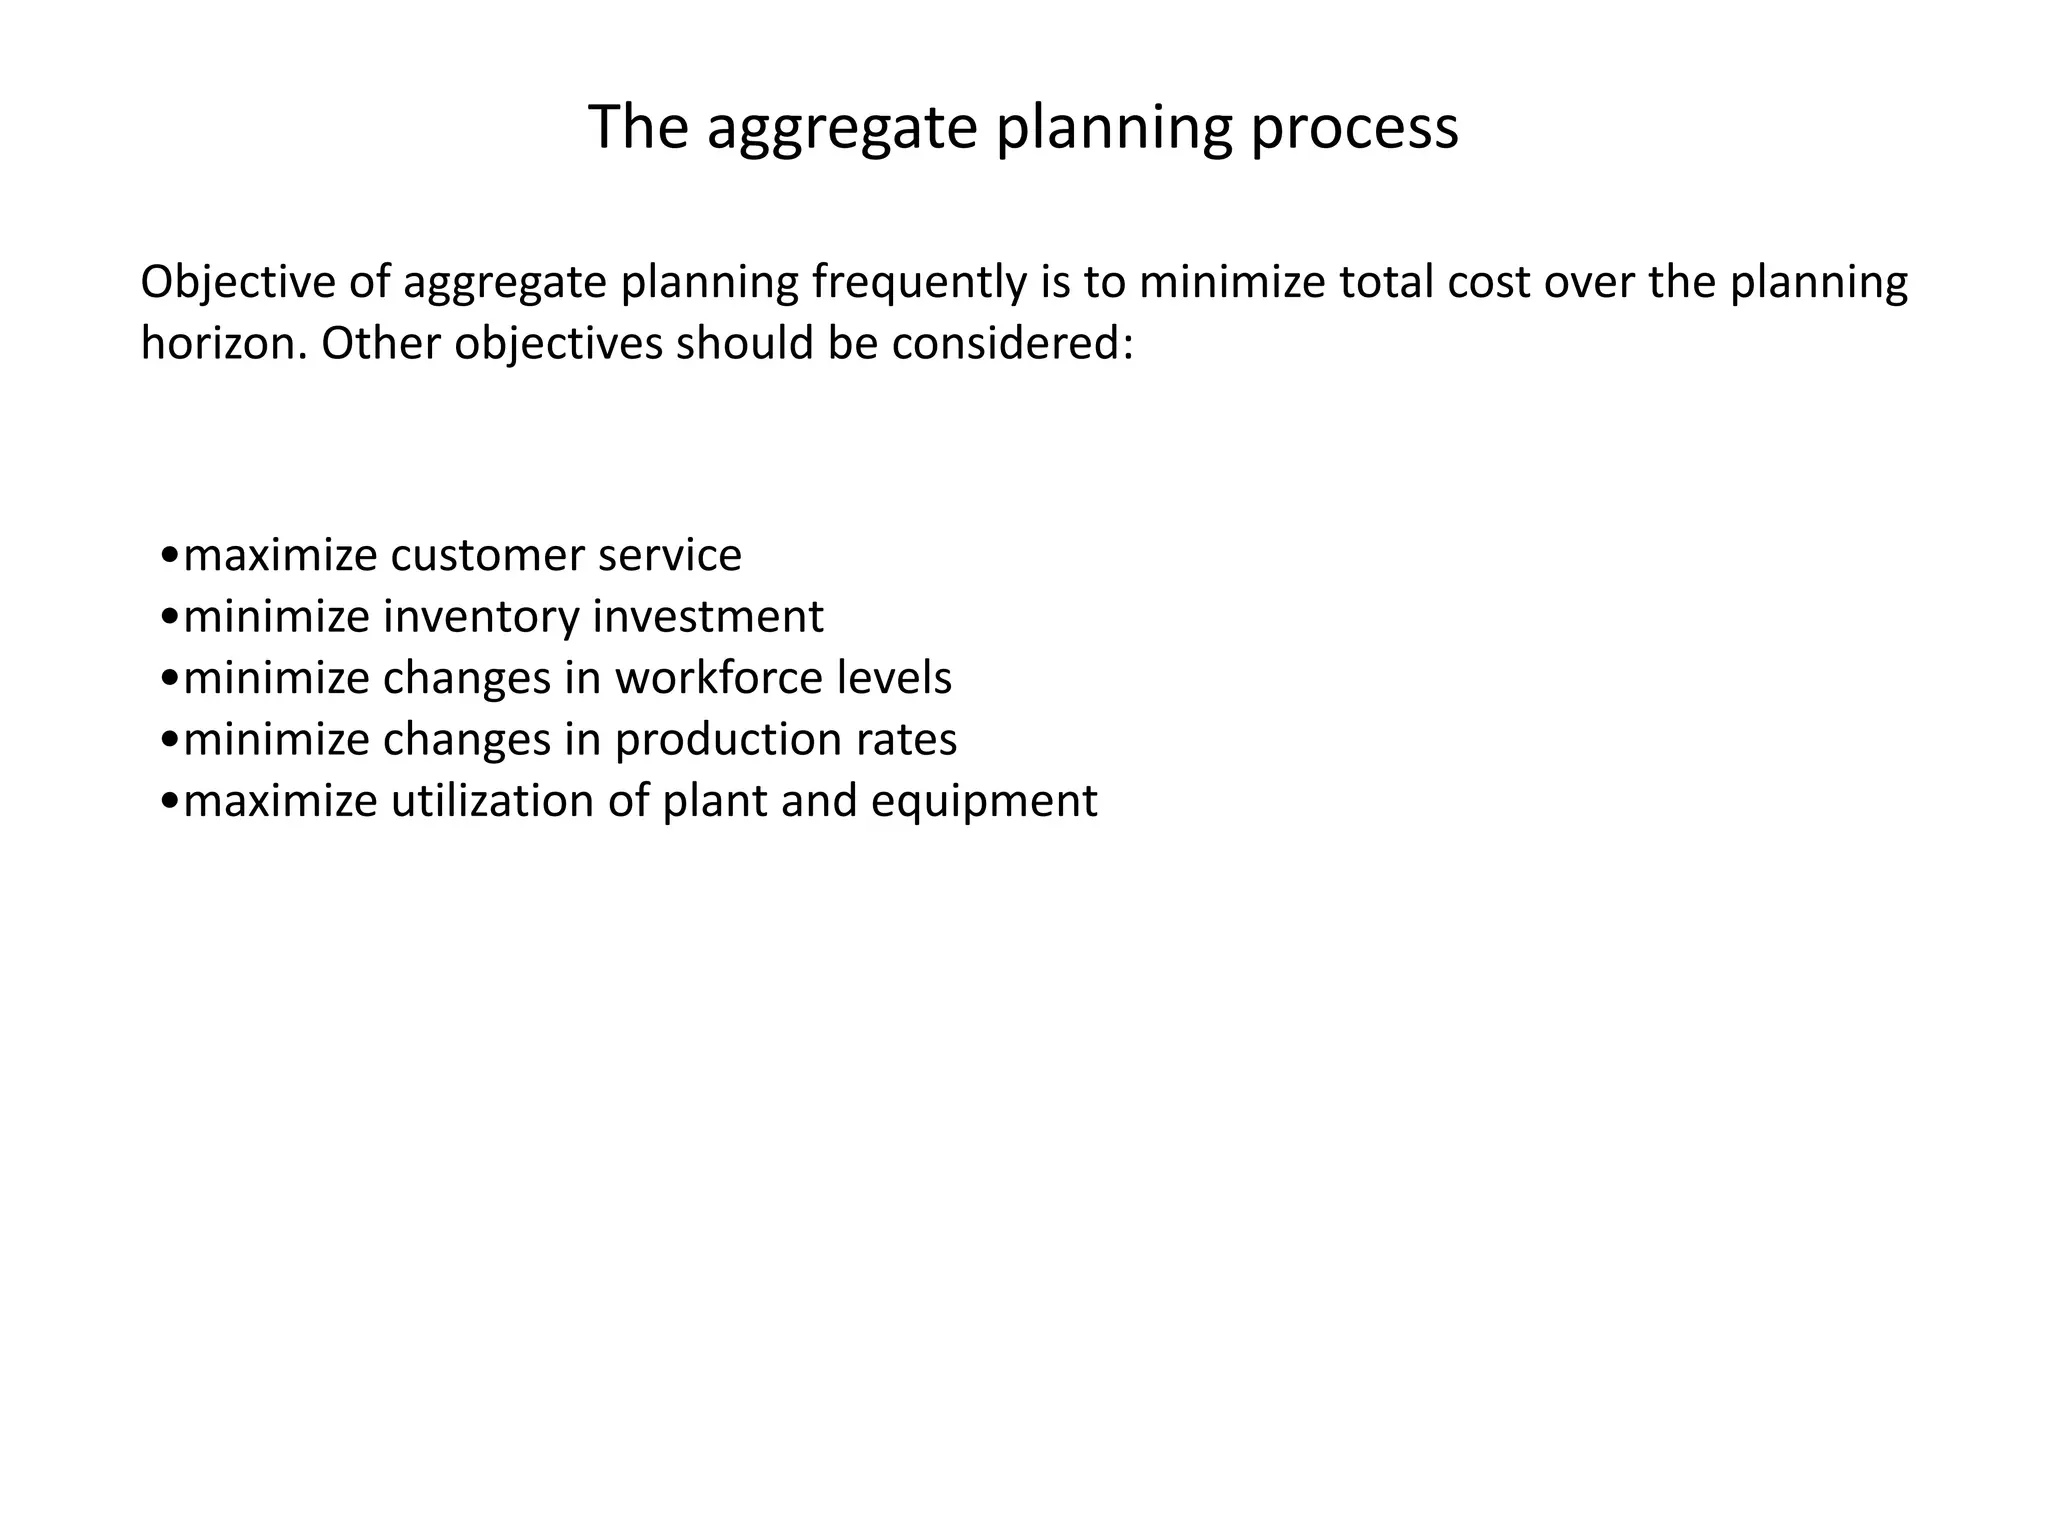
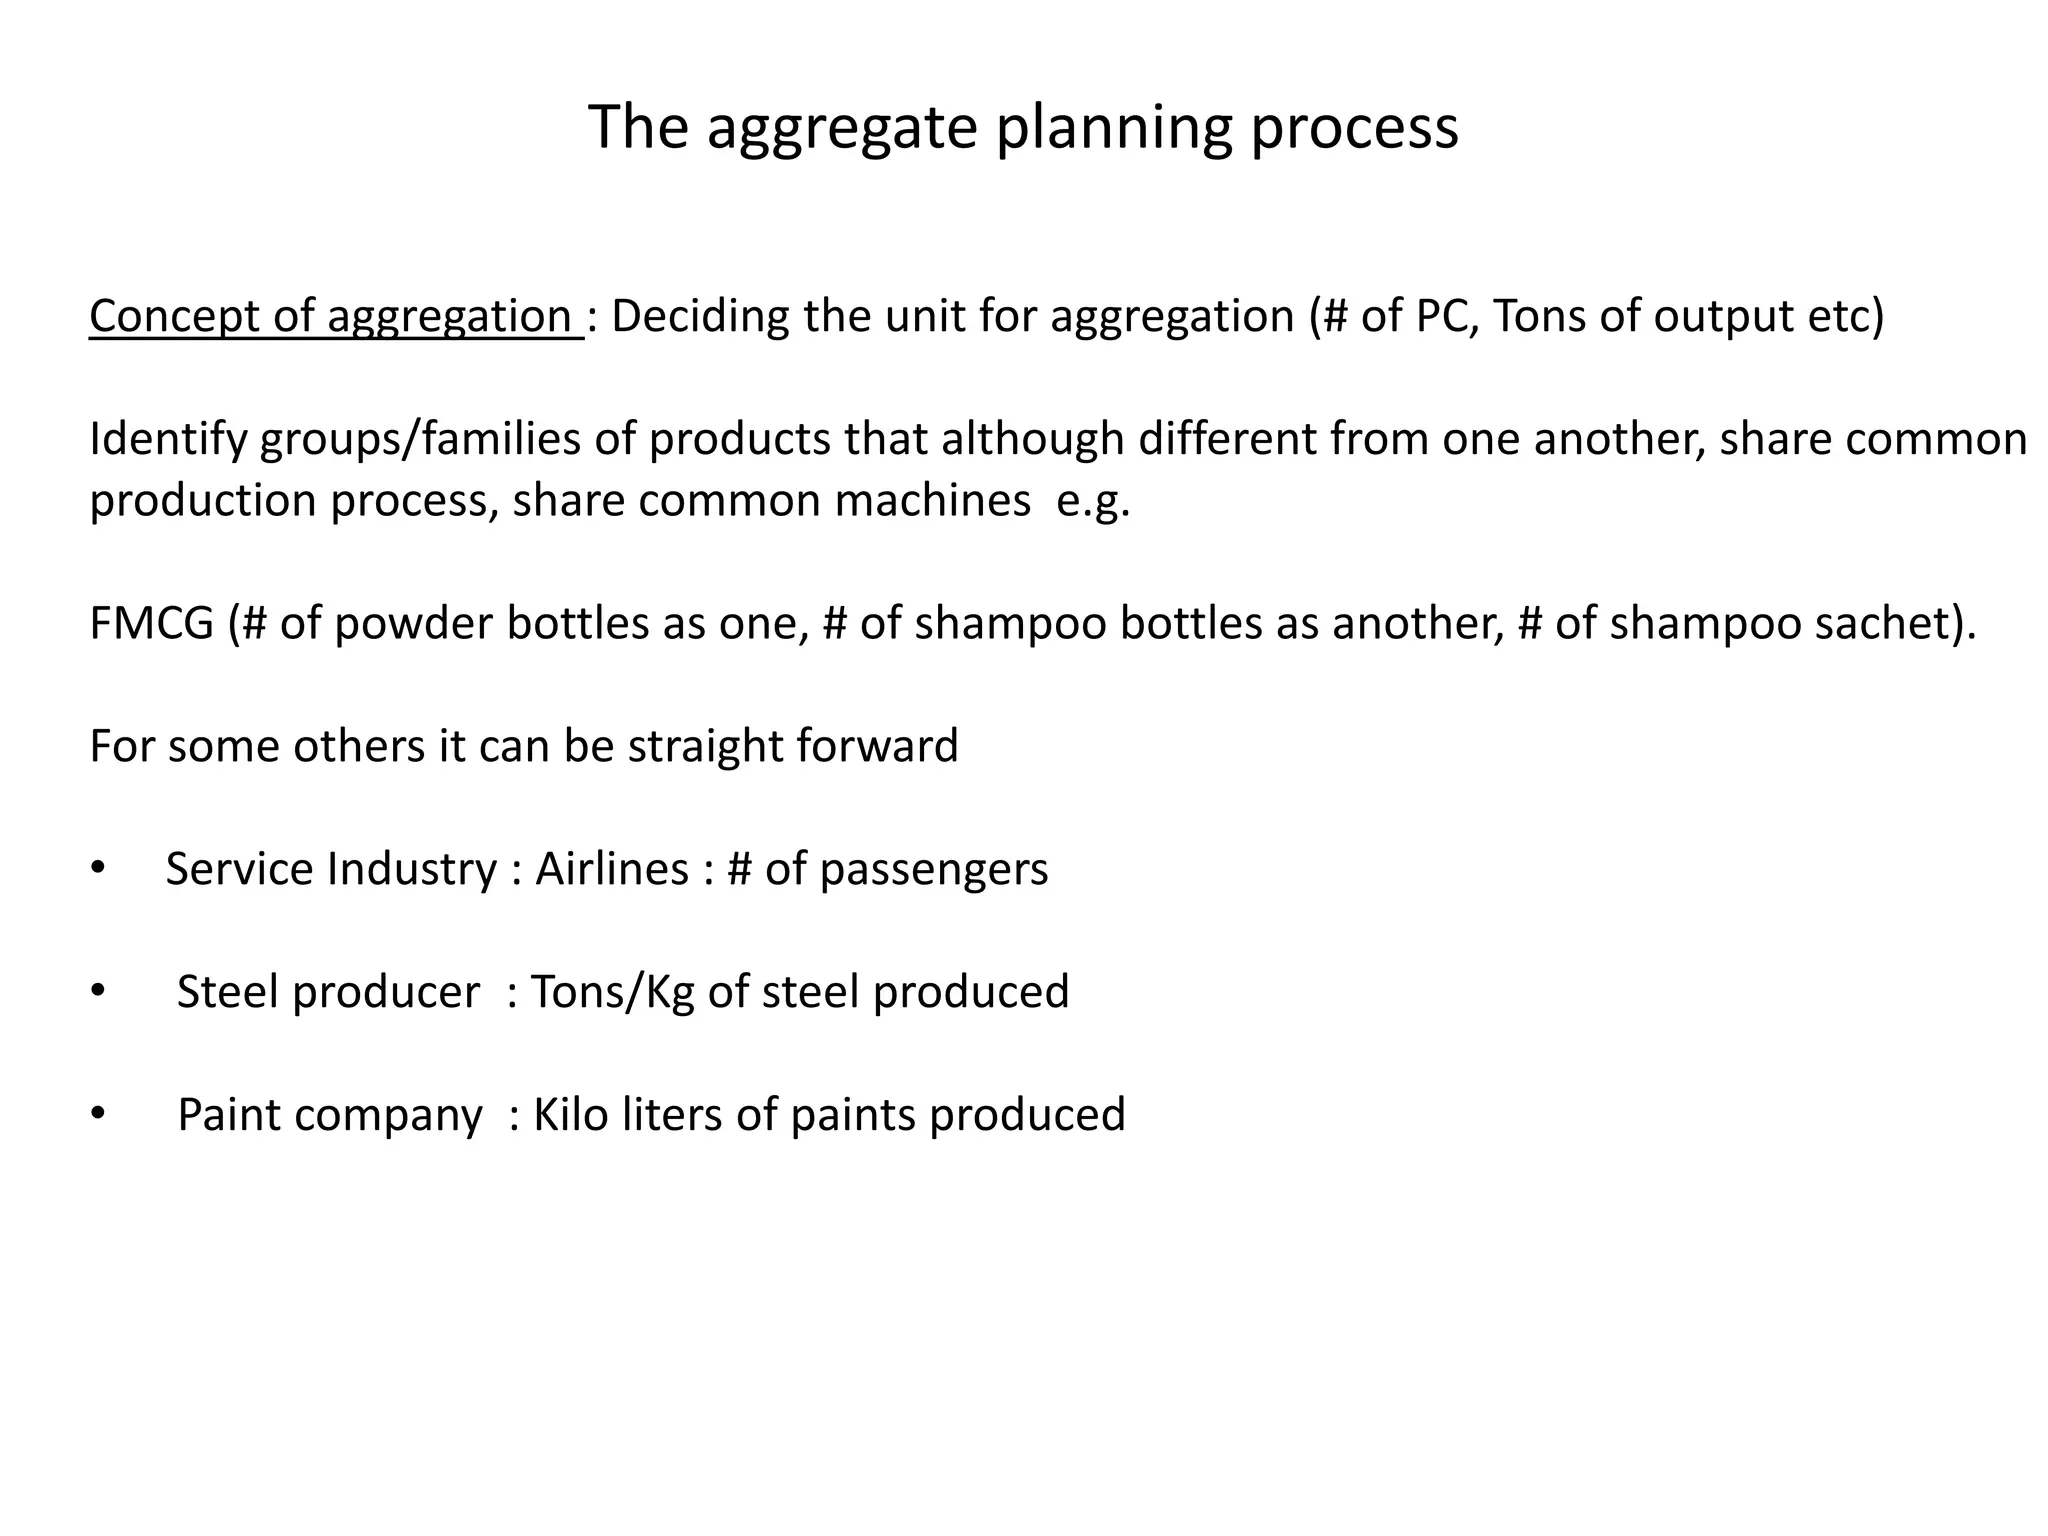
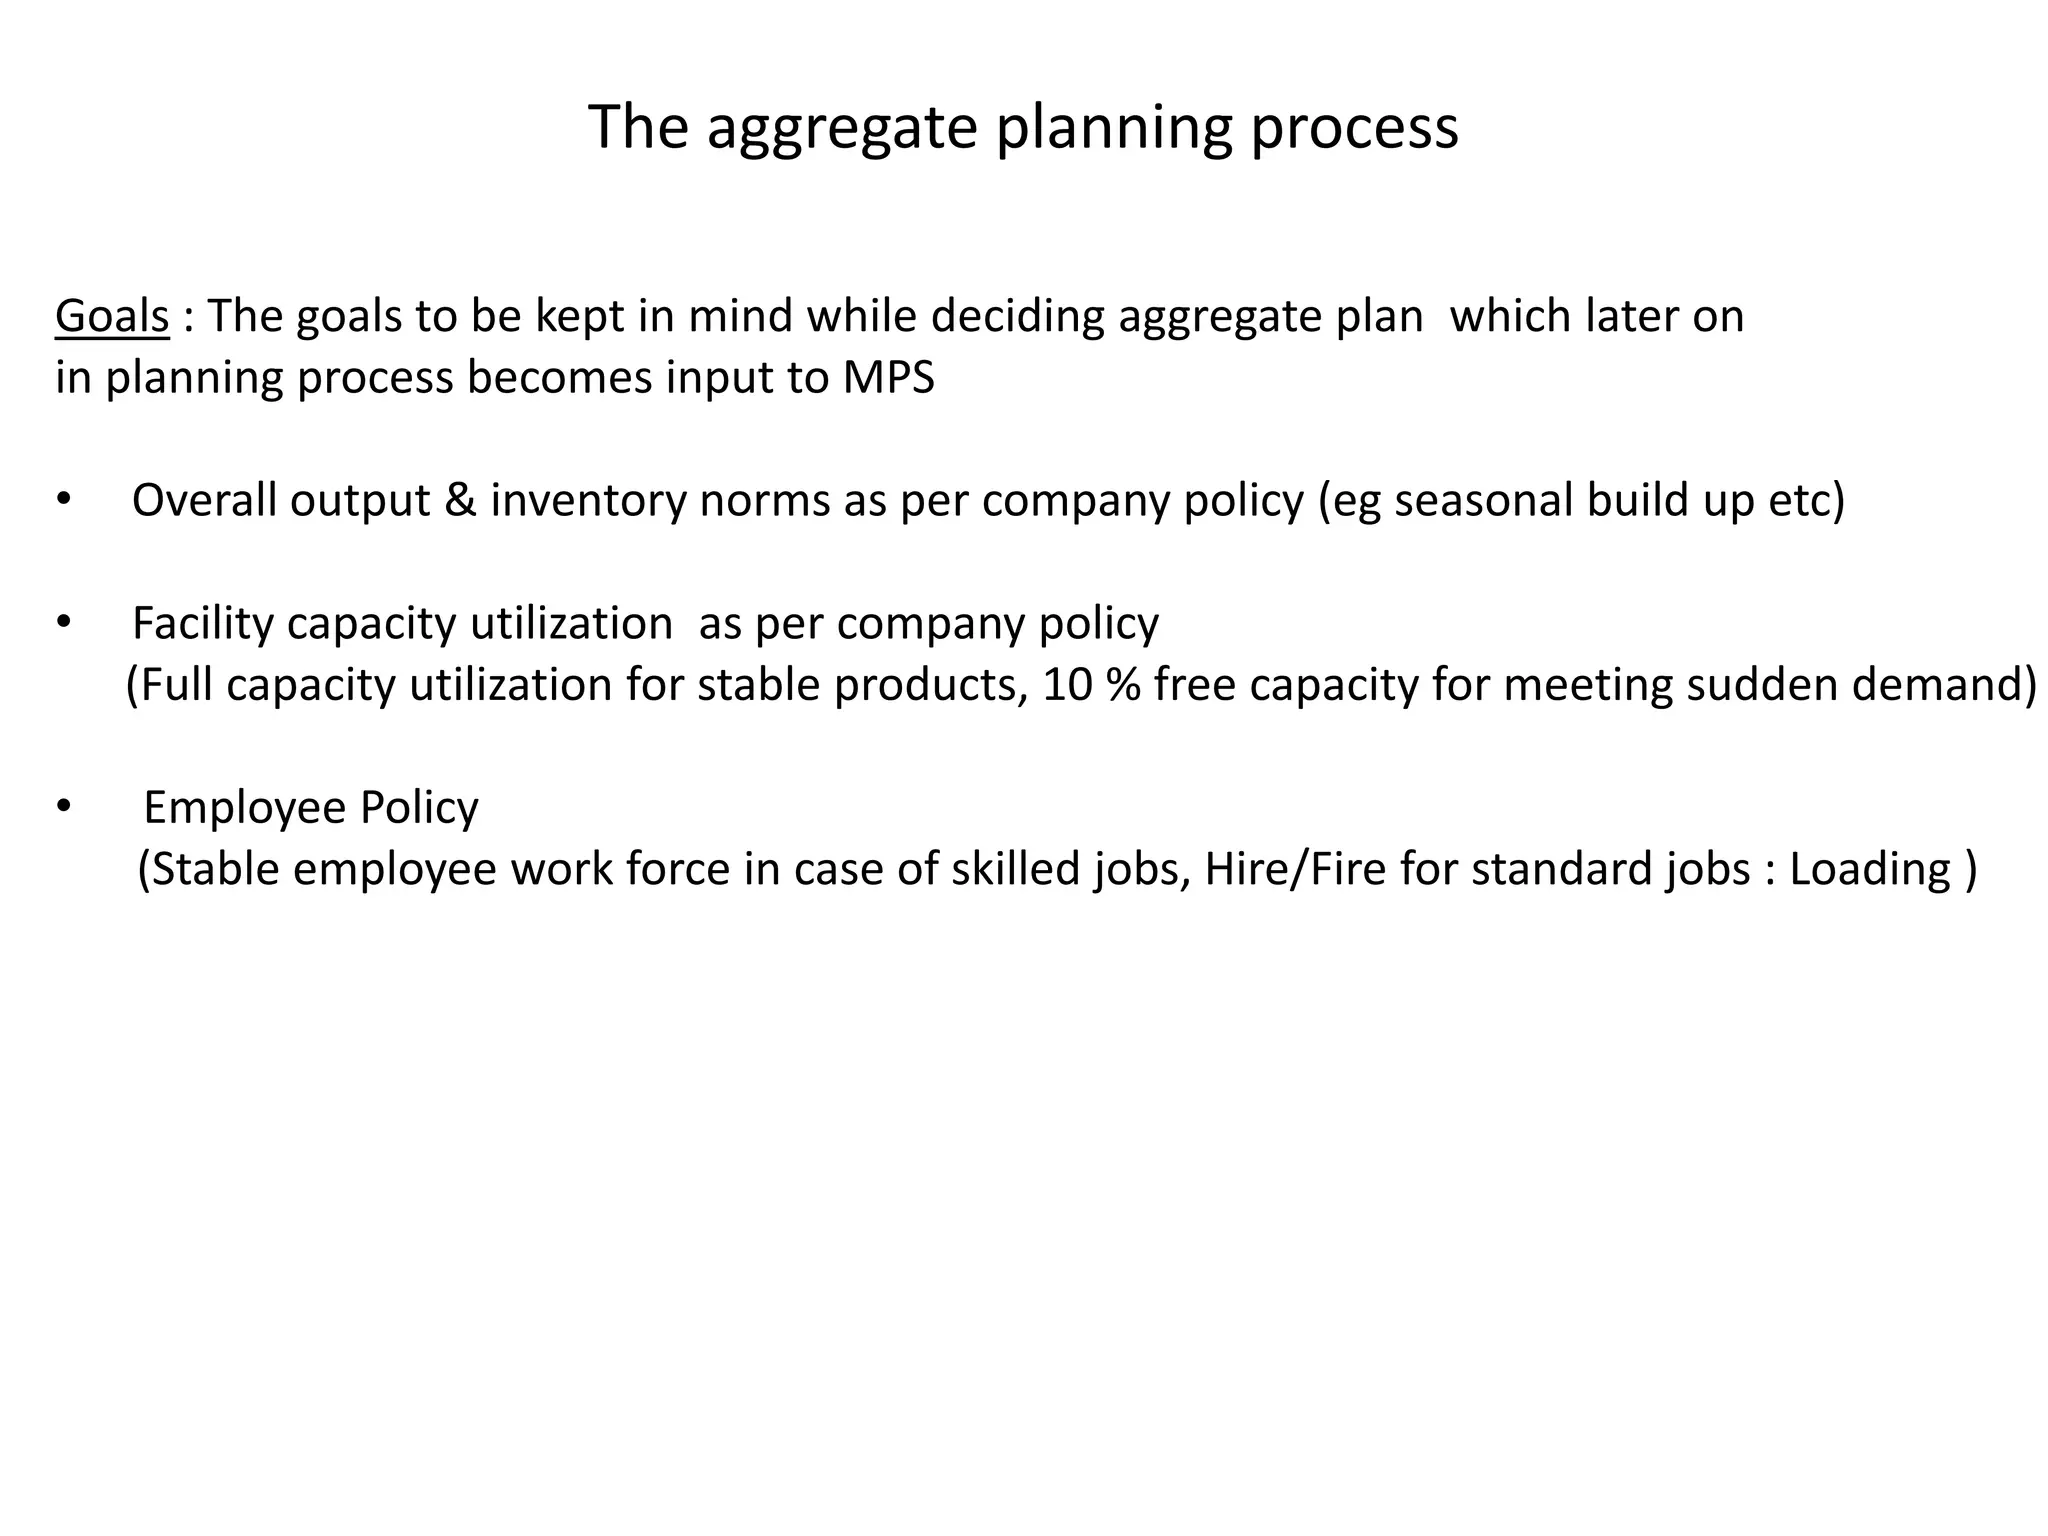
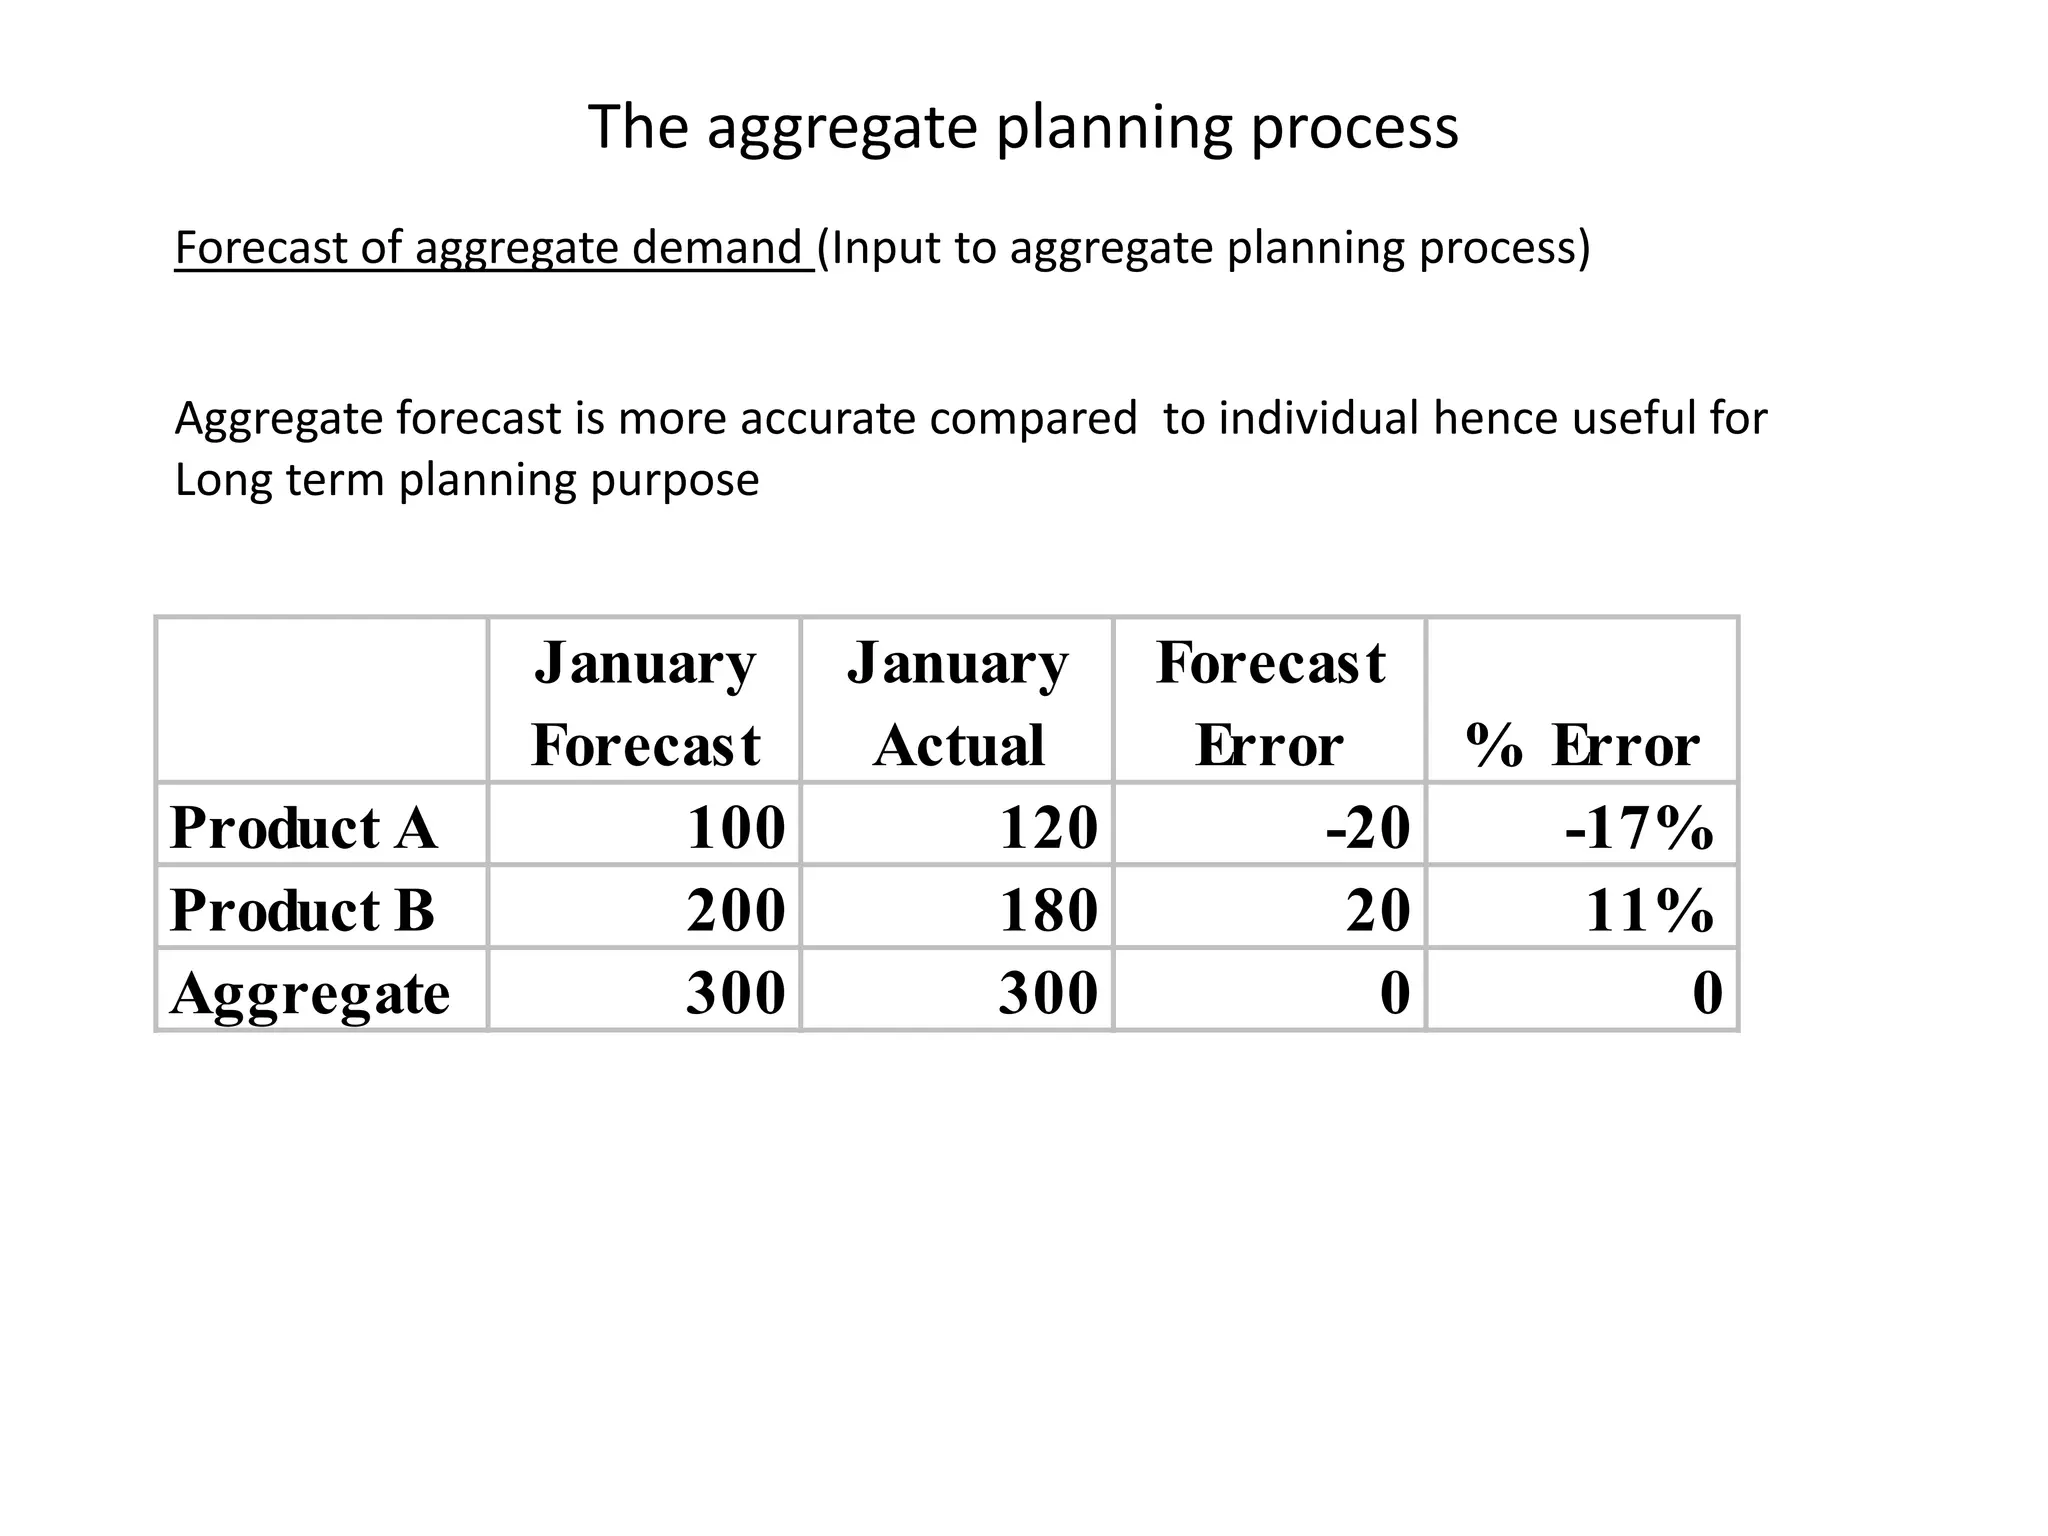
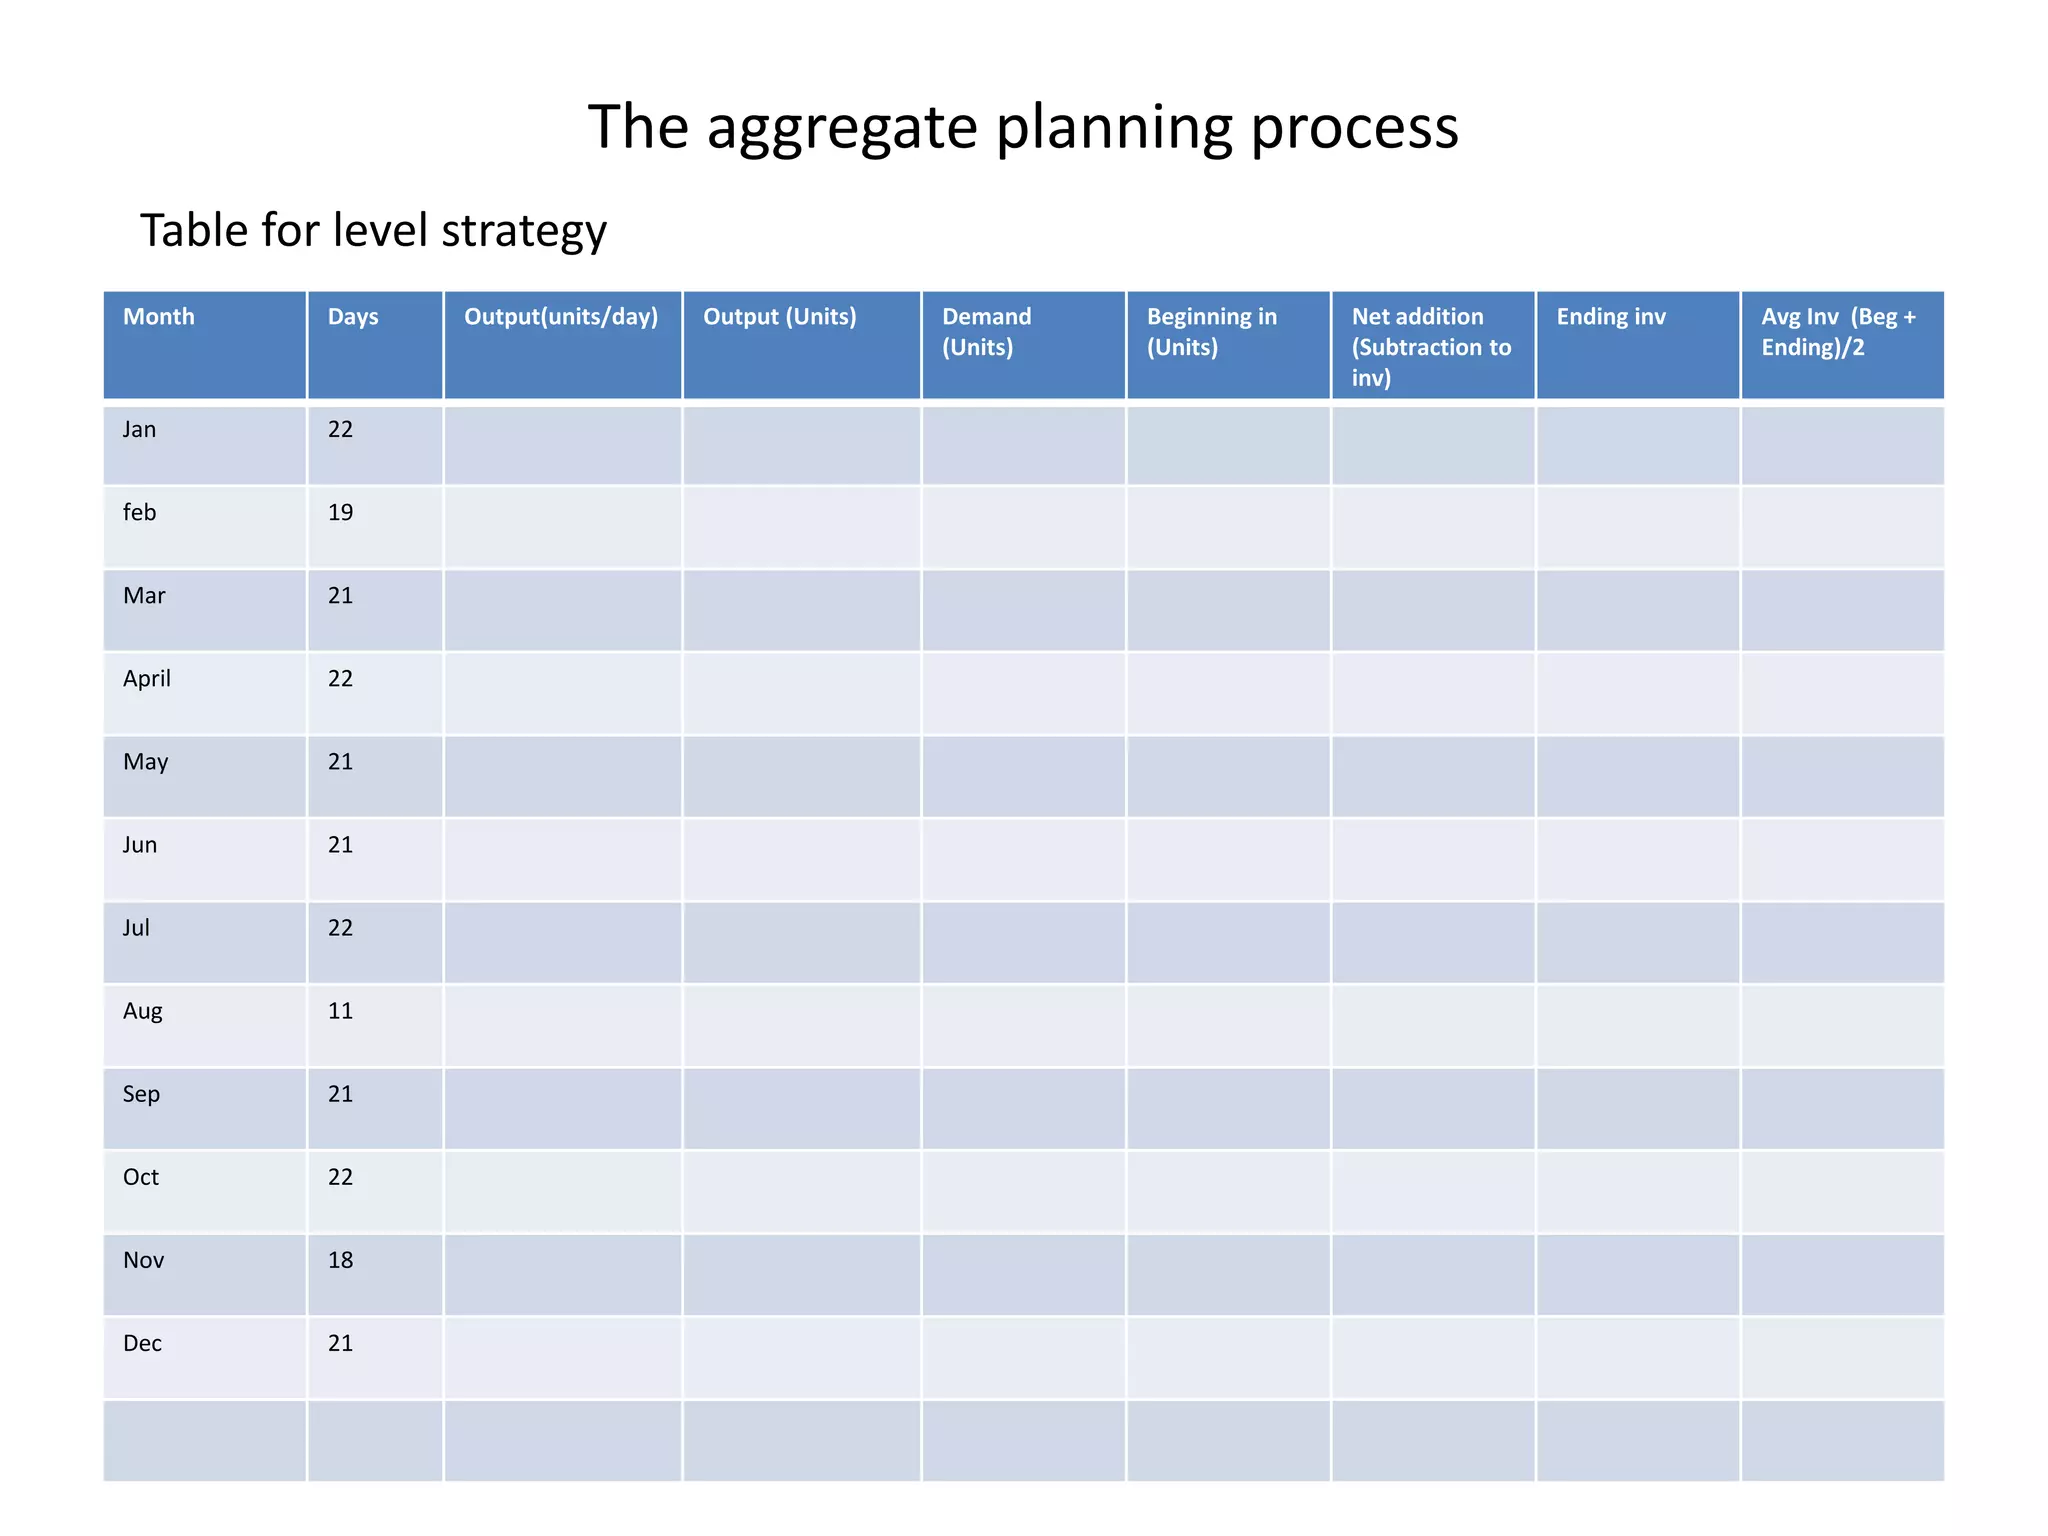
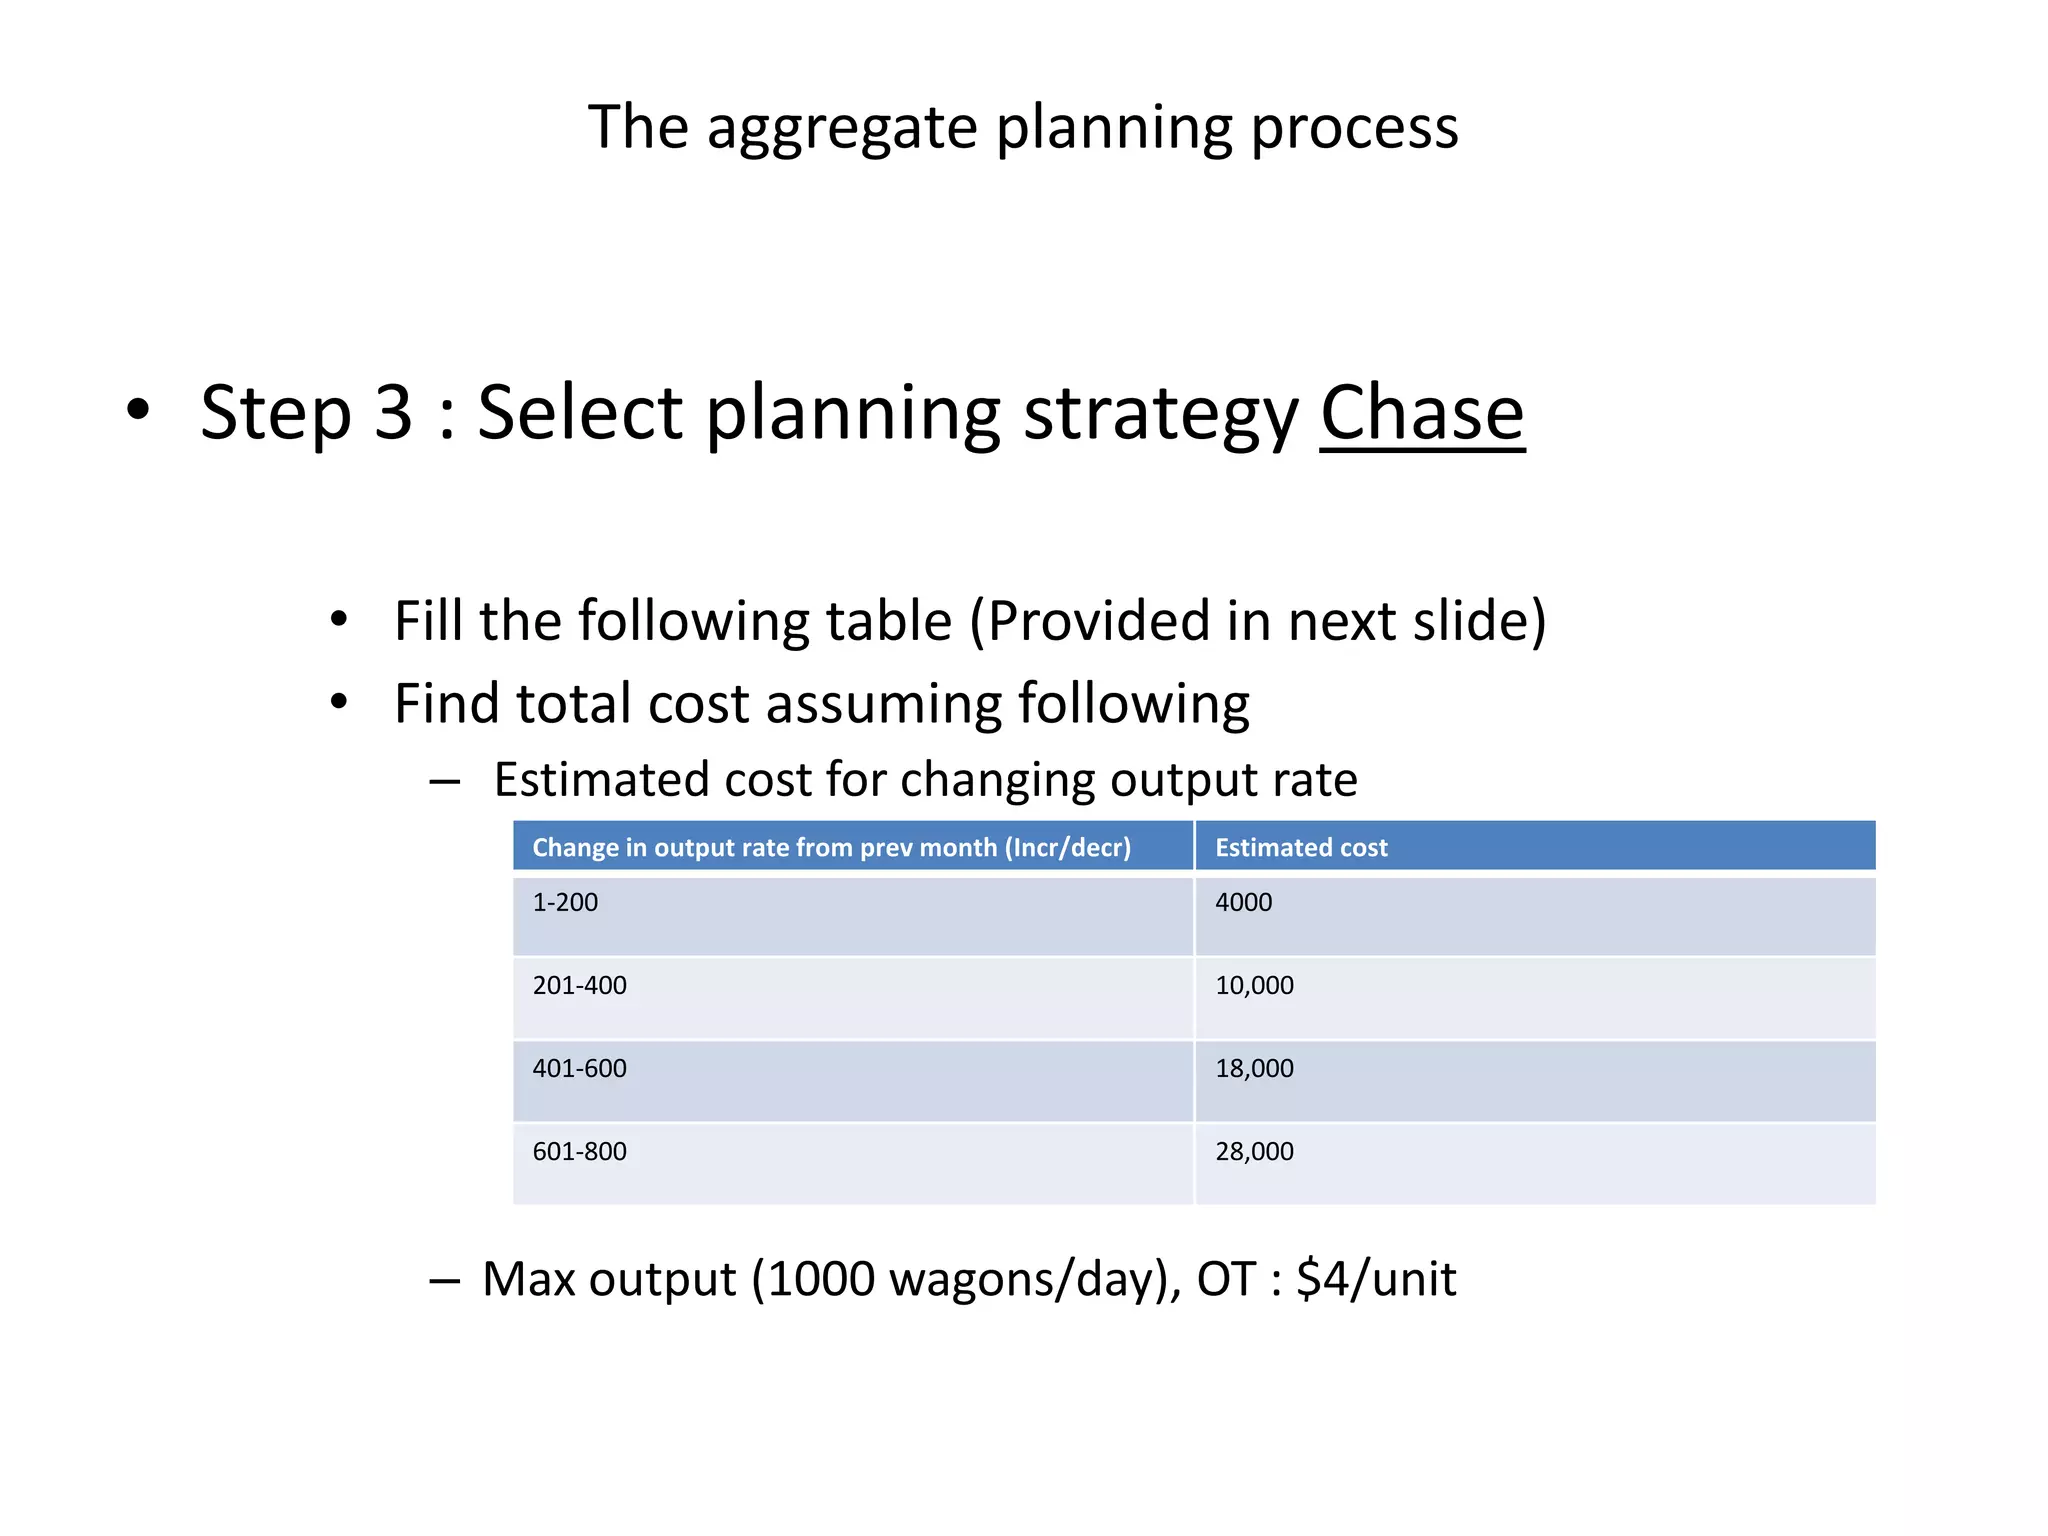
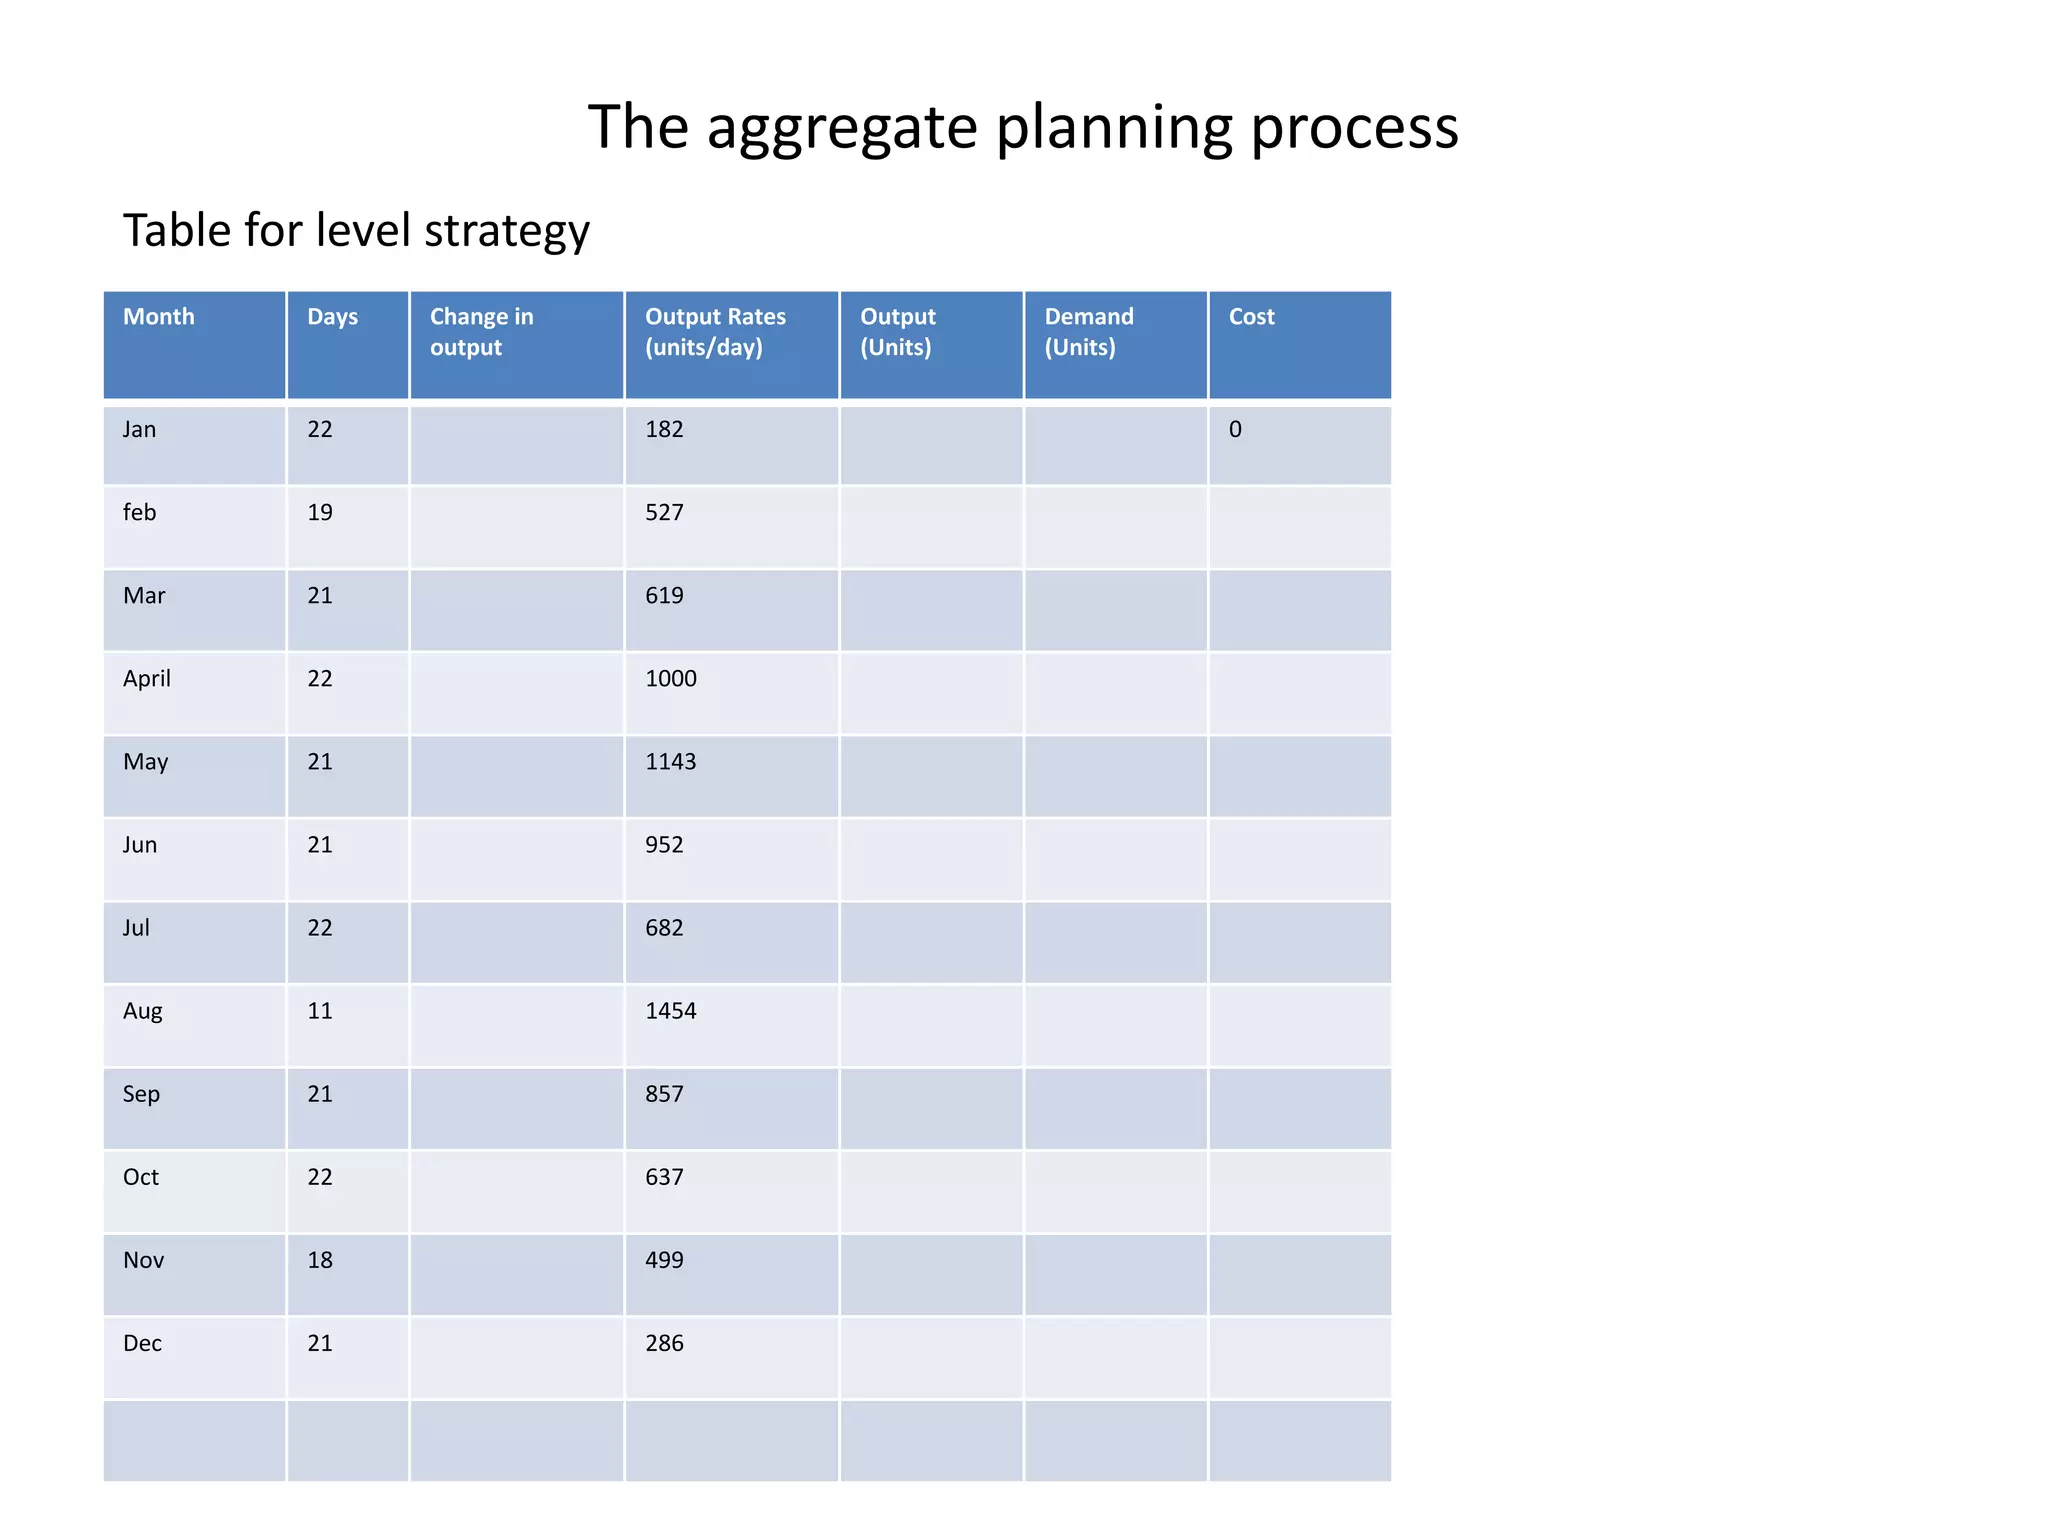
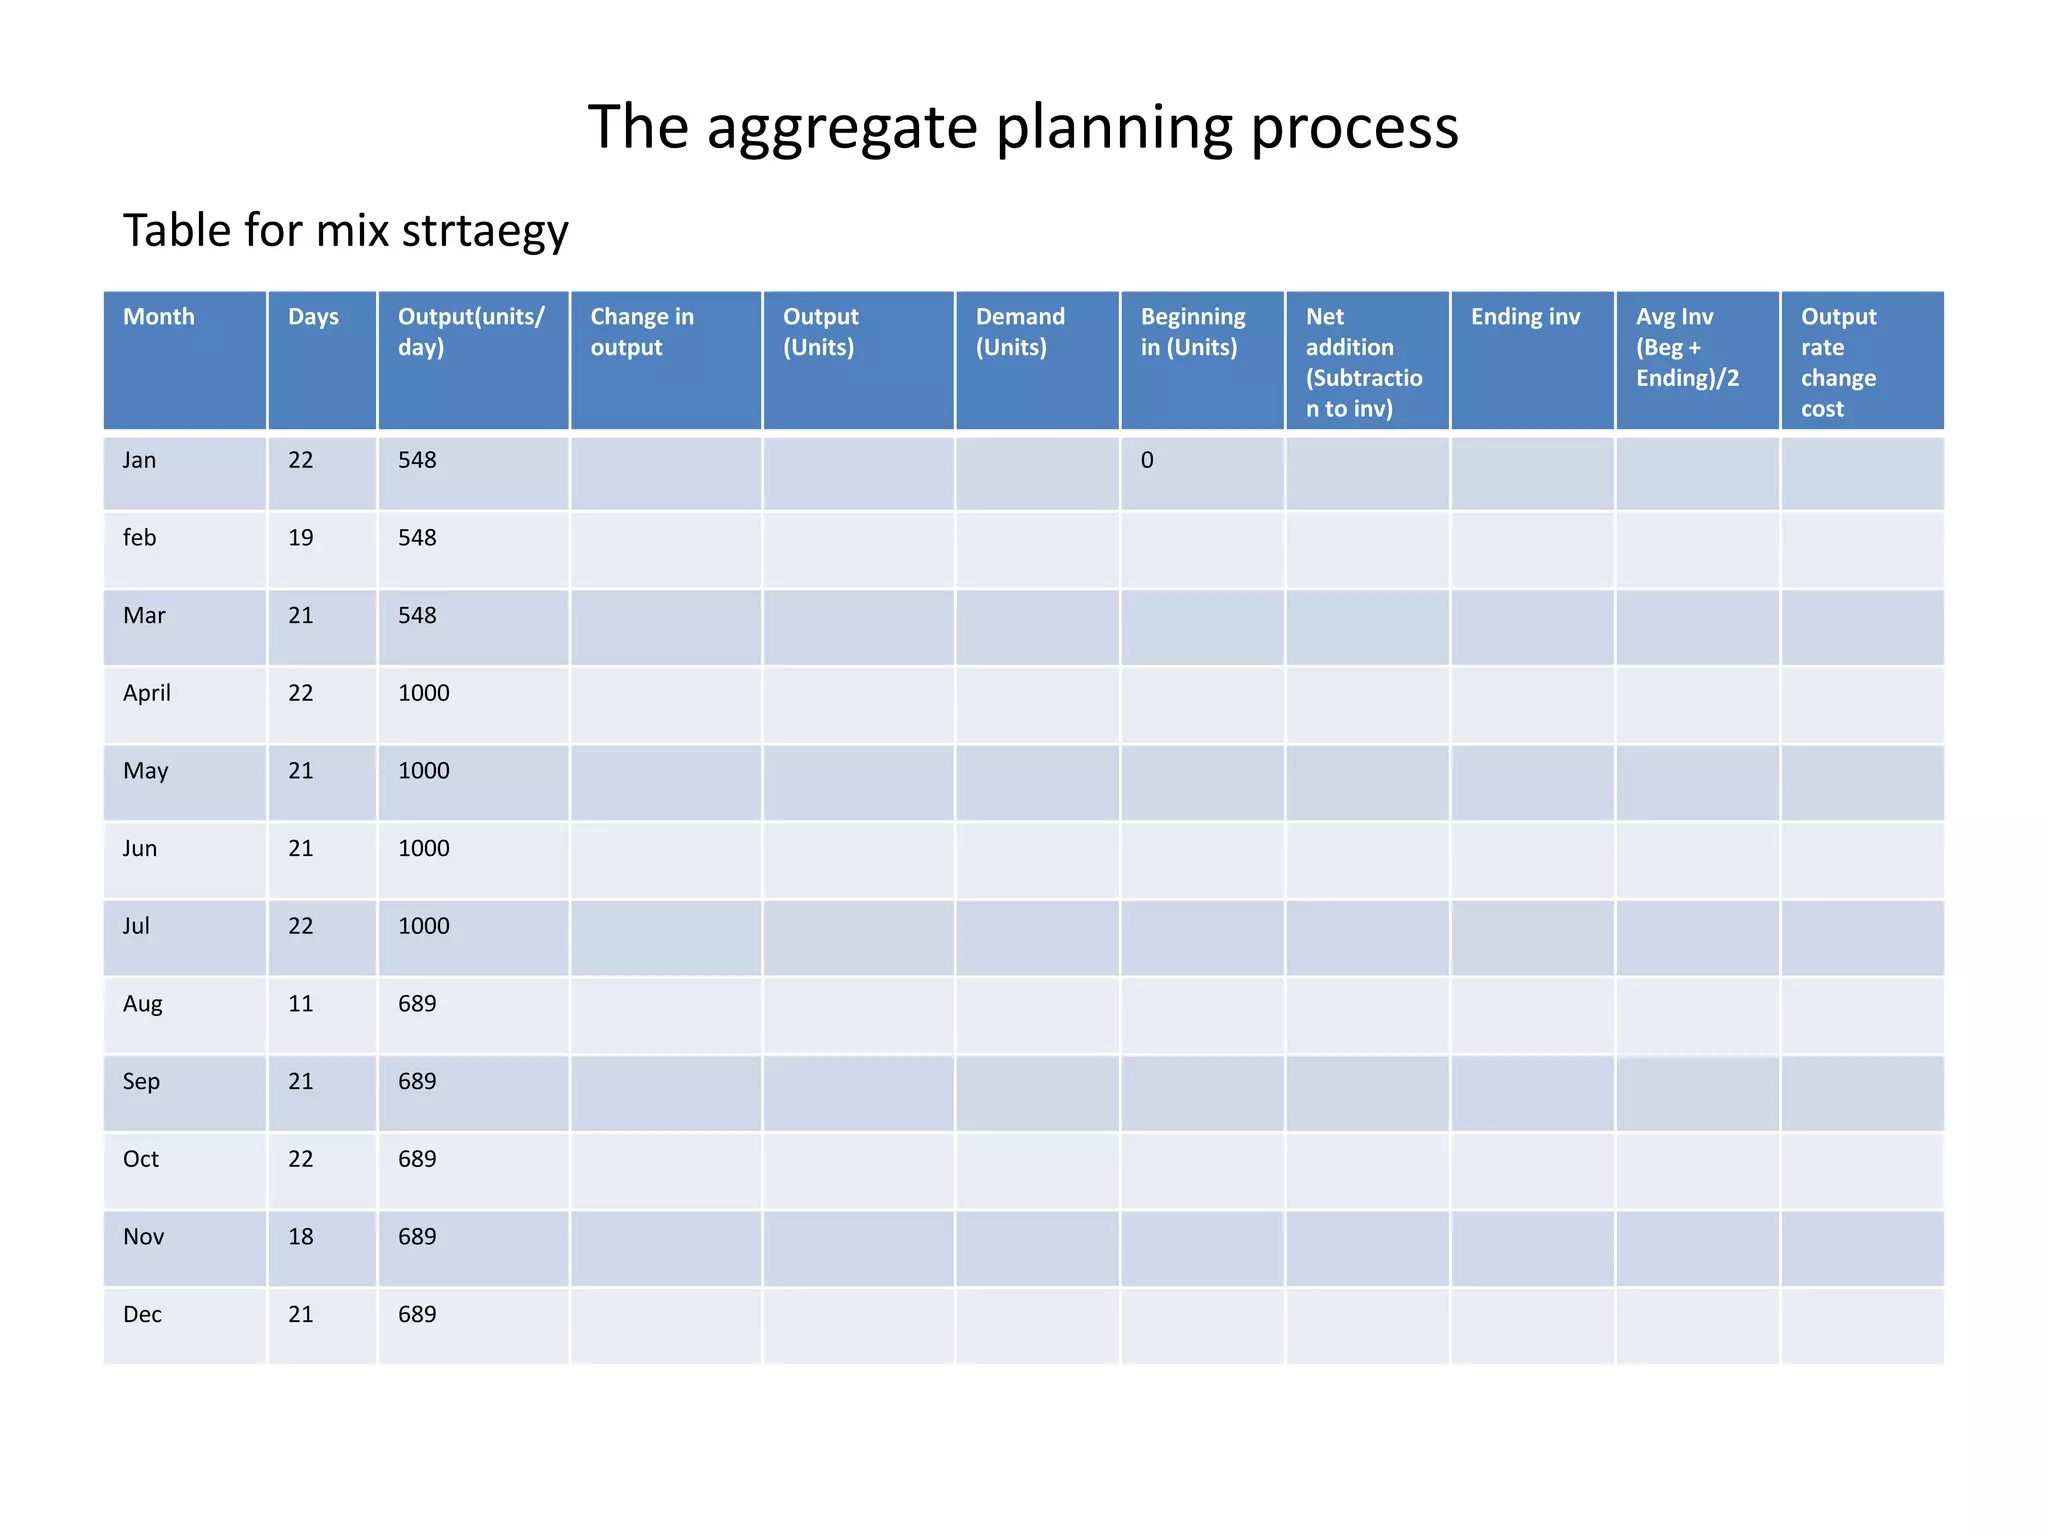
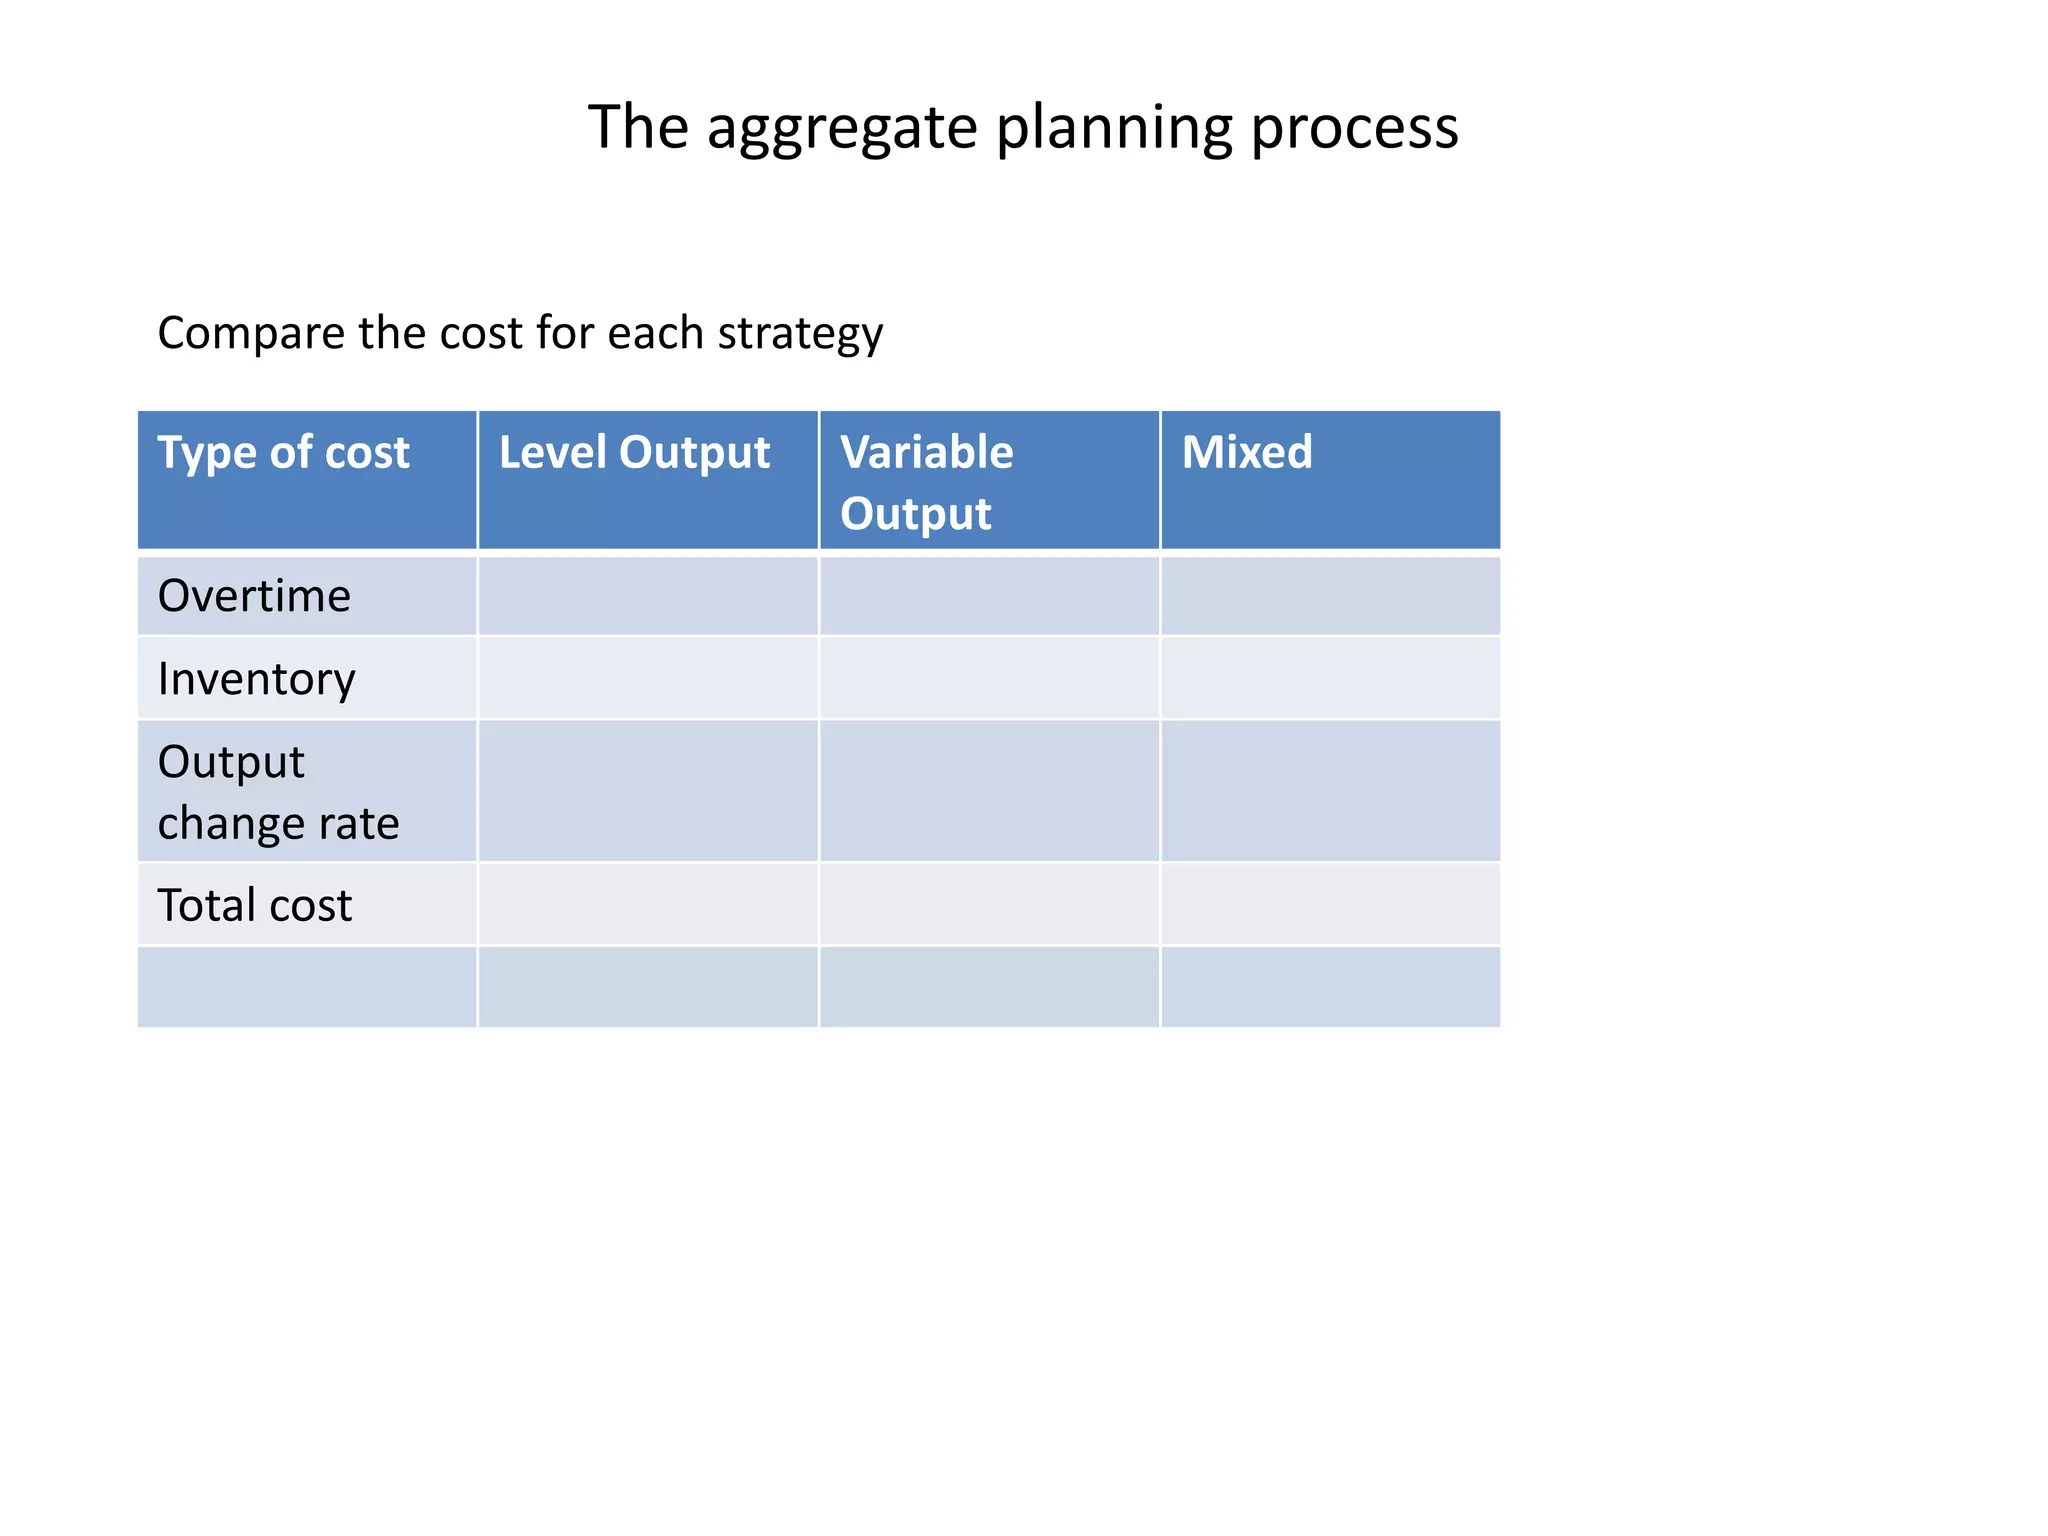

The document discusses aggregate planning, which involves determining production levels over a planning horizon to meet demand while minimizing costs. It describes different aggregate planning strategies such as level output, chase strategy, and a mixed approach. The level strategy maintains a constant production rate, chase strategy varies production to match demand, and mixed uses both approaches. An example problem demonstrates calculating costs for each strategy using data on demand forecast and production parameters. The optimal strategy balances meeting demand with minimizing total costs of inventory, overtime, and production rate changes.


