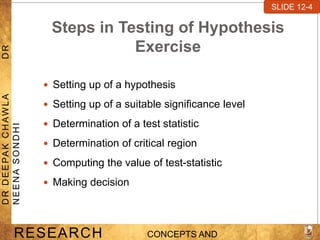
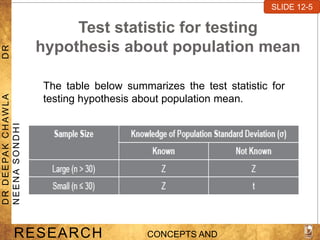
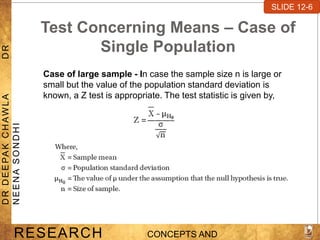
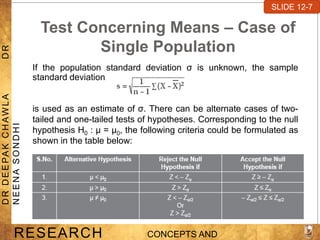
Download to read offline


The document discusses hypothesis testing and various statistical tests. It defines key concepts in hypothesis testing such as the null hypothesis, alternative hypothesis, one-tailed and two-tailed tests, and Type I and Type II errors. It then describes different statistical tests for comparing means and proportions, including z-tests, t-tests, and tests for comparing two populations. The appropriate test depends on factors like sample size and whether the population variance is known. Steps in hypothesis testing are also outlined, such as setting up the hypotheses, determining the test statistic, critical region, and making a decision to accept or reject the null hypothesis.


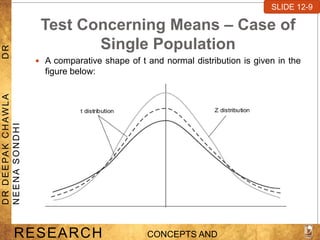
![[EN].CleverGroup Vietnam Profile 20251202](https://cdn.slidesharecdn.com/ss_thumbnails/en-260120091417-fe6f88ec-thumbnail.jpg?width=640&height=640&fit=bounds)


