![Radio Link Analysis for 4G TD- LTE Technology at 2.3 GHz Frequency
23
Published By:
Blue Eyes Intelligence Engineering
& Sciences Publication Pvt. Ltd.
XII. CONCLUSION
We have captured the result for 128 Kbps, 256 Kbps and 512
Kbps for TDD Mode 1 Configuration and TDD Mode 2.
From the results we can conclude the if we use 128 Kbps of
cell Target throughput then a city be planned for minimum no
of cell sites and for 512 Kbps cell Target throughput then we
can plan the maximum cell sites.The choice of cell throughput
depend on the operator what is cell throughput they want
which is directly impact the quality of network which come
with some cost. While making a choice of the Cell target
throughput the keep in mind Cost of network as well as the
quality of the services. If we decide the 512 Kbps cell Target
throughput then we need more cell cite which increase
COPEX and well as OPEX for the network. But when we use
128 Kbps Target Cell Edge throughput then we need less
number of cell sites, but the quality of the network will be less.
So there is a trade-off between the network service quality and
network Cost. Then we have a one more choice where we
have change scarifies some money and increase the network
quality up to some extent, the choice is 256 Kbps in which is
lies between both 128 Kbps and 512 Kbps which provides
moderate service quality and moderate Network Cost. So
network Operator can choose 256 Kbps Cell Target
Throughput. Now we have other choice of choosing the TDD
mode configuration which can be decided based on the types
of services. If a network Operator want to deploy service like
VOIP which have need same data rates in both direction i.e.
uplink and downlink. So it will better that one can choose a
TDD mode configuration which have same percentage of
uplink and downlink time and TDD mode will provide this
facility which is 50 % downlink and 50 % uplink timing. But
in Country like India where most of the services are heavy
download where most of the people do movie download song
download. If an operator choose TDD mode 1 for heavy
download service type network the uplink resources will be
wasted. So better to choose the TDD mode 2 which provide
more downlink sub frame 60% percentage. If we compare the
TDD mode 1 and TDD mode 2 Configuration Cell count for
256 Kbps Cell Target throughput , need more cell sites in
TDD mode 2 to cover the same area because the cell radius
will be less in TDD mode 2 as compare two TDD mode 1
configuration. So from all the result we can conclude that
TDD mode 2 is a better choice for a network operator in a
country like India if he want to provide the more download
services like web browsing, unlimited download types of
services. But this will cost an operator for some cost. An
operator can also think on TDD mode configuration 1 if his
service profile is symmetric for both uplink and downlink
traffic.
REFERENCES
[1] Lte - The Umts Long Term Evolution from Theory To Practice 2nd
Edition by Stefania Sesia , Issam Toufik, Matthew Baker
[2] 3GPP TS 36.300 “Evolved Universal Terrestrial Radio Access
(E-UTRA), Evolved Universal Terrestrial Radio Access Network
(E-UTRAN).
[3] LTE the Future of Mobile Broadband Technology by Verizon Wireless
[4] “Long Term Evolution (LTE): an introduction,” Ericsson White paper,
October 2007.
[5] Introduction to Graphical User Interface (GUI) MATLAB
“http://ewh.ieee.org/r8/uae/GUI.pdf”.
[6] Dimensioning of LTE Network, Description of Models and Tool,
Coverage and Capacity Estimation of 3GPP Long Term Evolution
radio interface by Abdul Basit, Syed. February, 2009
[7] 3GPP TS 24.302: “Access to the 3GPP Evolved Packet Core (EPC) via
Non-3GPP Access Networks”.
[8] 3GPP TS 36.331: “Evolved Universal Terrestrial Radio Access
(E-UTRAN); Radio Resource Control (RRC) Protocol Specification”
[9] 3GPP TS 36.401: “Evolved Universal Terrestrial Radio Access
Network (E-UTRAN); Architecture Description”
[10] LTE, The UMTS long Terms Evolution: From Theory to Practice
[11] “Long Term Evolution (LTE) Technical Overview’’, Motorola.
Retrieved July 3, 2010.
Author’s Biographies
Nisha Malik B.Tech in Electronics &
Communication Engineering from School of science
and Engineering Khanpur Kalan , BPS Mahila
University in 2012. She is pursing M.tech degree in
Electronics & Communication Engineering from
Bhagwan Parshuram College of
Engineering,Deenbandhu Chhotu Ram University of
Science & Technology Murthal University in 2014.
Rohit Khattar, B.Tech is Electronics and
Communication Engineering from KUK University
and M.tech from Deenbandhu Chhotu Ram
University of Science & Technology Murthal
University and Working as Assistant Professor in
Electronics & Communication Engineering
department at Bhagwan Parshuram College of
Engineering and research include next generation
telecommunication technologies.
Amit Vatsh M.Tech , B.Tech in Electronics &
Communication Engineering from School of
science and Engineering MDU Rohtak and
Working as Assistant Professor in Electronics and
Communications Depts. at Innovative Institute of
Technology and Management , Sonepat and
research in Wireless Field.
Sukhvinder Malik B.E. in Electronics and
Communication Engineering from MDU Rohtak in
2010 with Honours. Having more than 4 years of
experience in LTE development industry in
different fields i.e. Radio, Protocol testing, Quality
Assurance etc.](https://image.slidesharecdn.com/c1763084314-140814033801-phpapp01/85/Radio-Link-Analysis-for-4G-TD-LTE-Technology-at-2-3-GHz-Frequency-6-320.jpg)

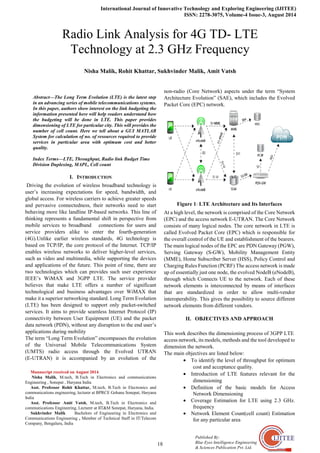
This paper discusses the Long Term Evolution (LTE) technology, focusing on link budgeting and network dimensioning for mobile telecommunications. It outlines the transition from previous generations to 4G, emphasizing LTE's advantages over WiMAX and detailing the architecture, core network components, and the tools developed using MATLAB for optimal resource allocation. Key features and benefits of LTE, such as increased speed, reduced latency, and flexible bandwidths, are highlighted to showcase its superiority in delivering enhanced mobile broadband services.