Download to read offline

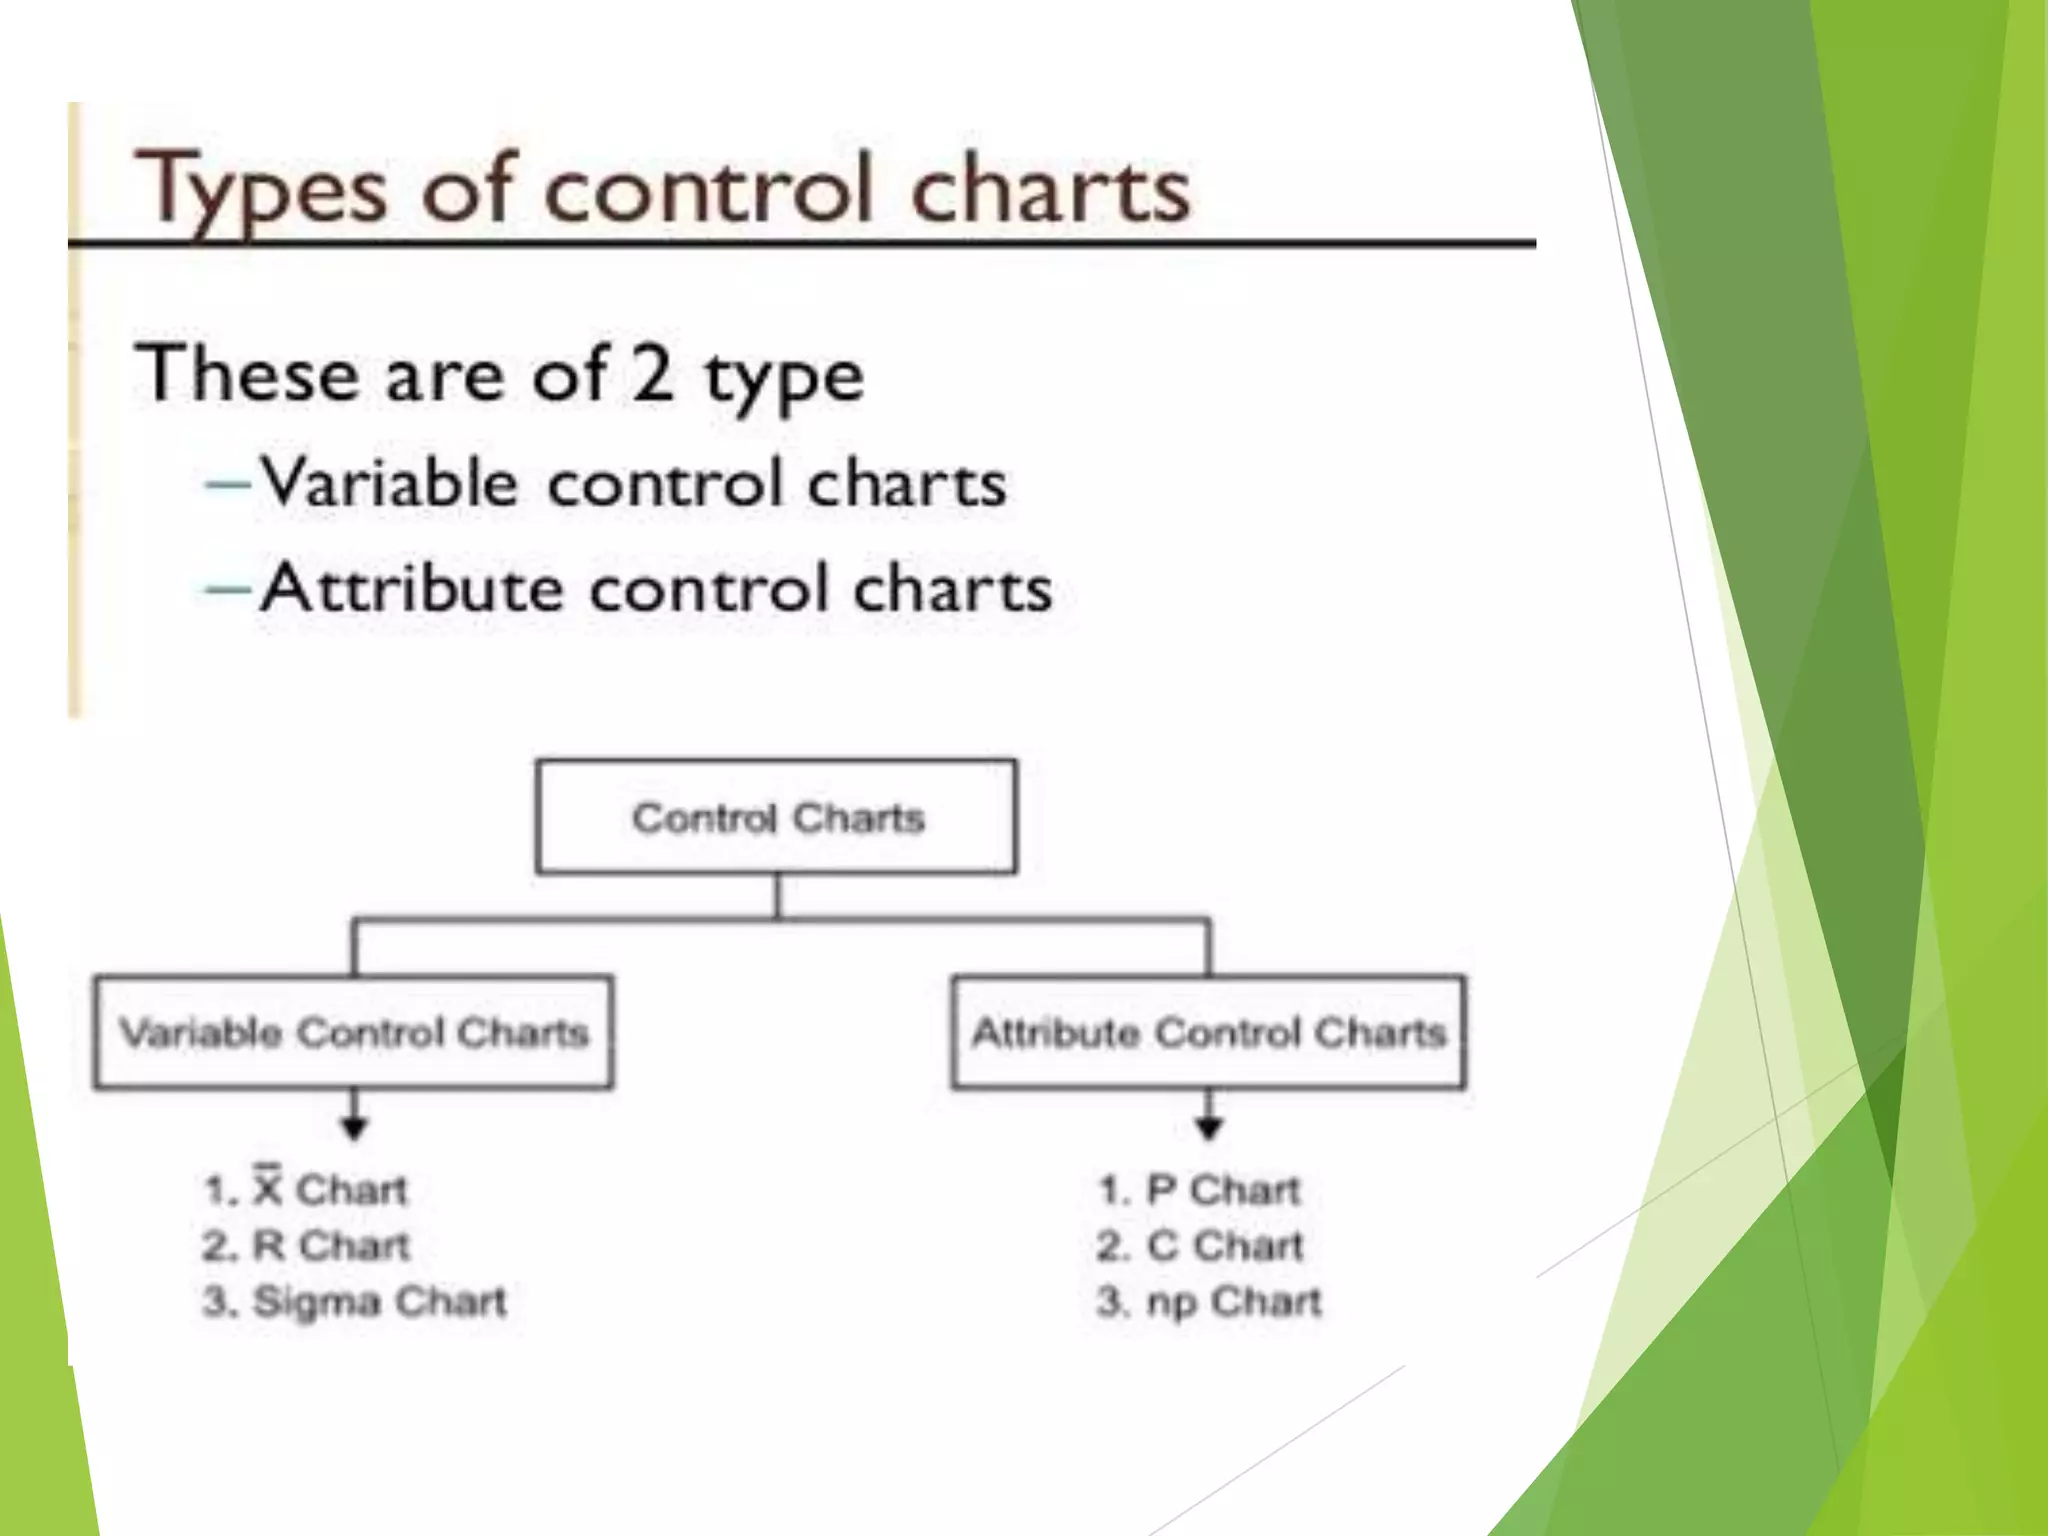
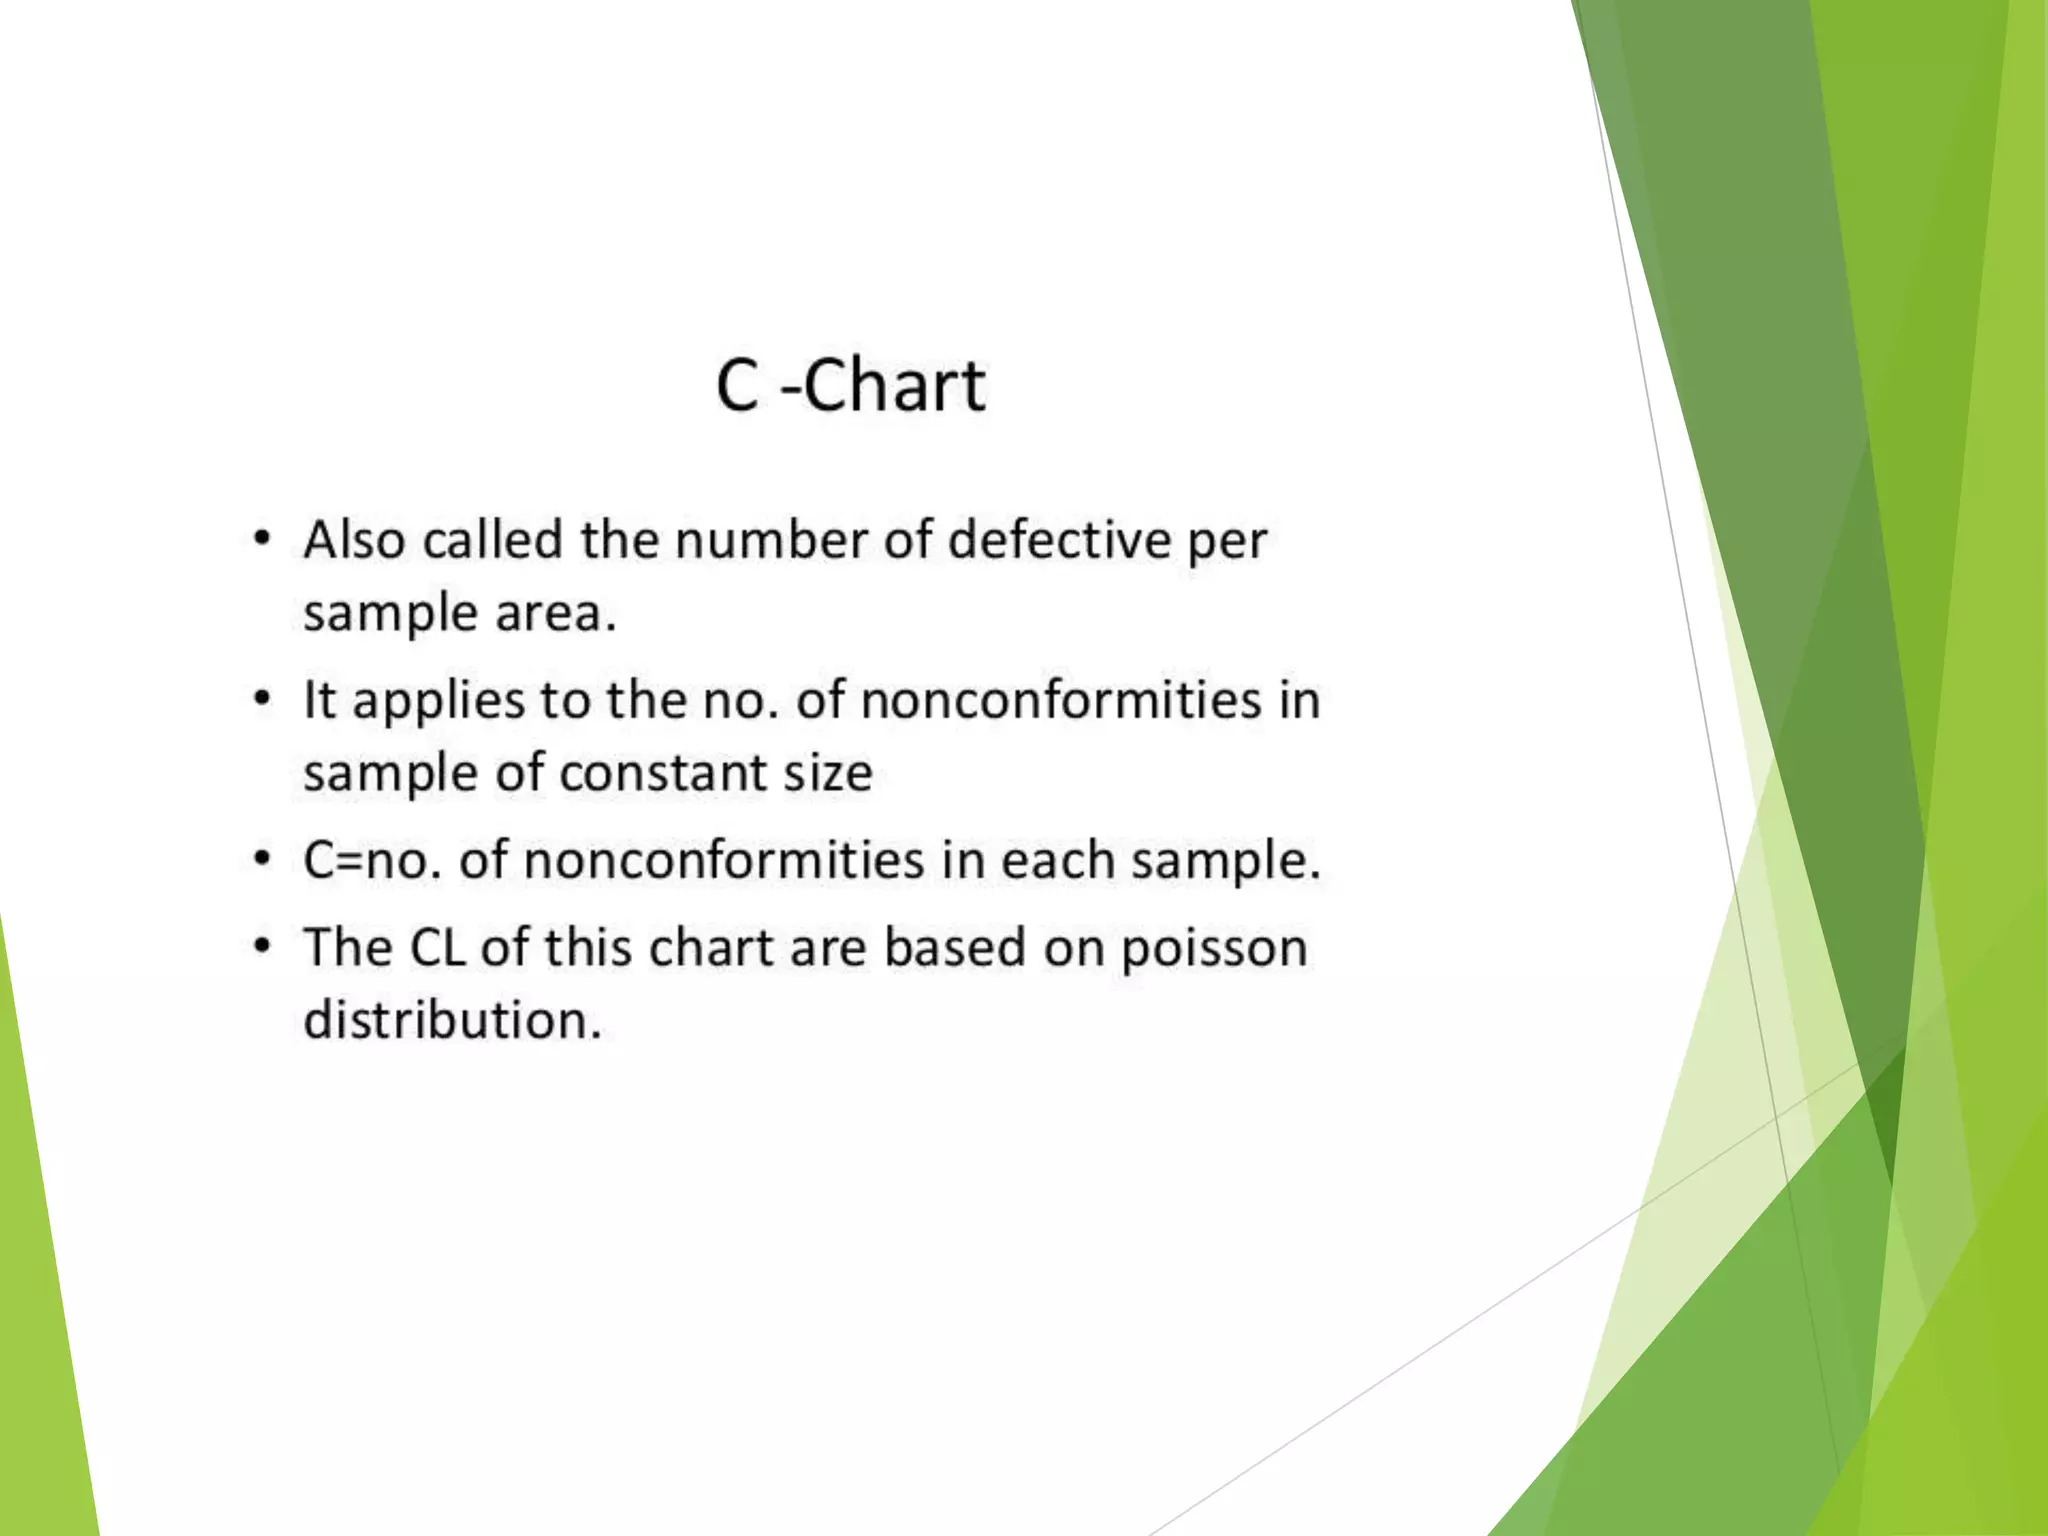
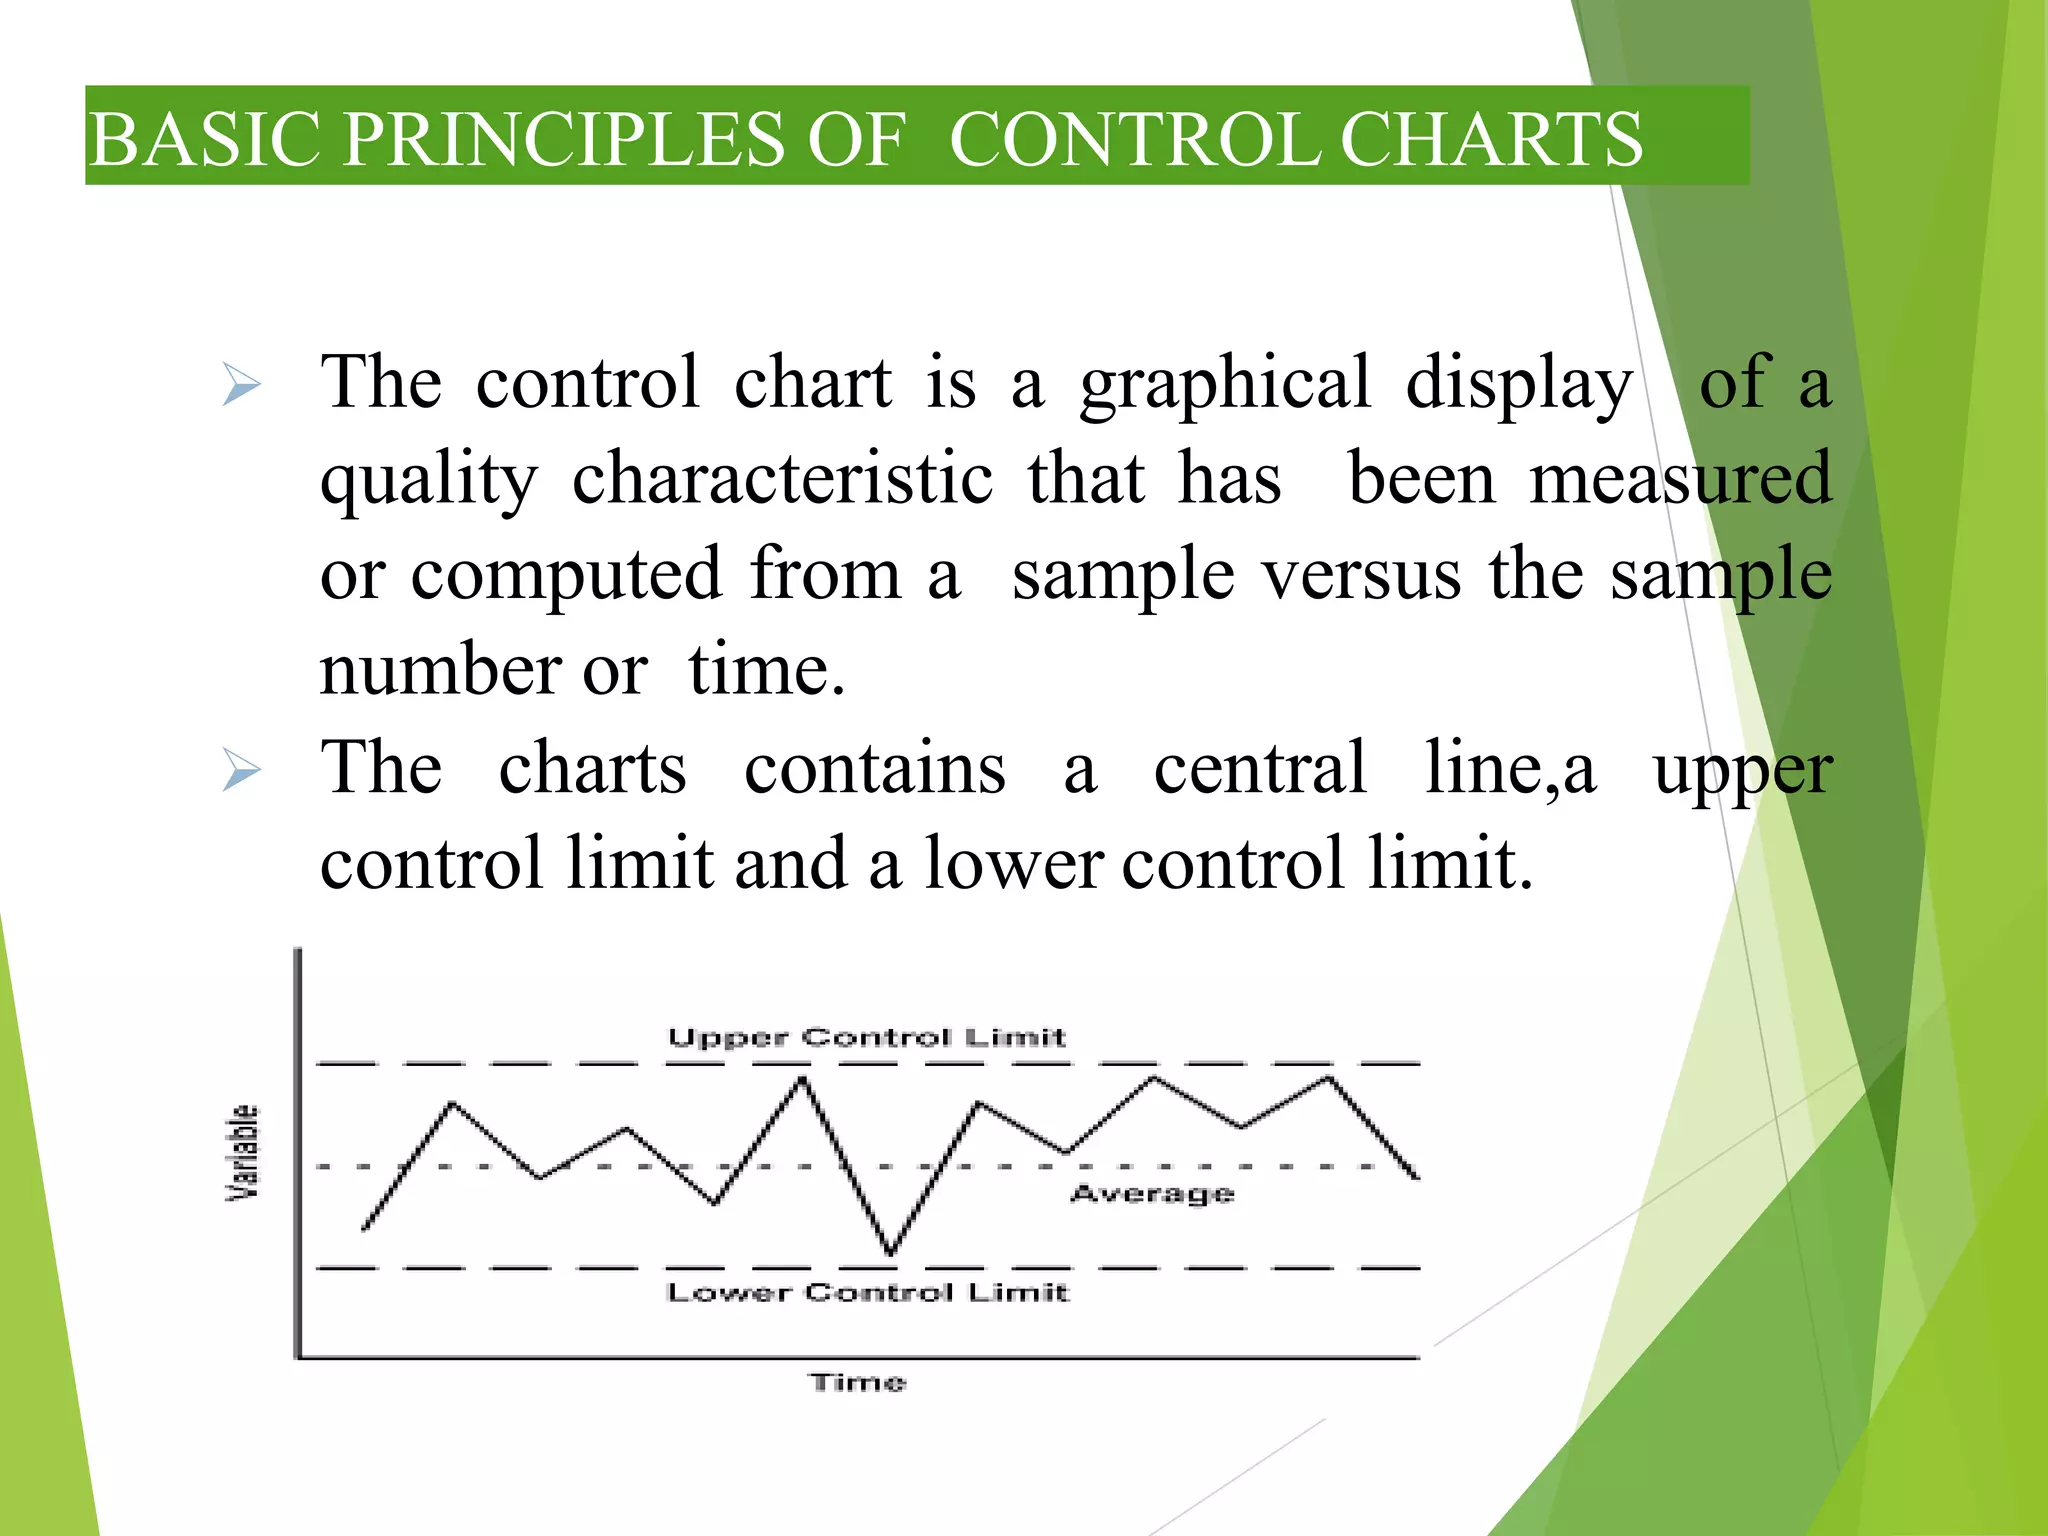
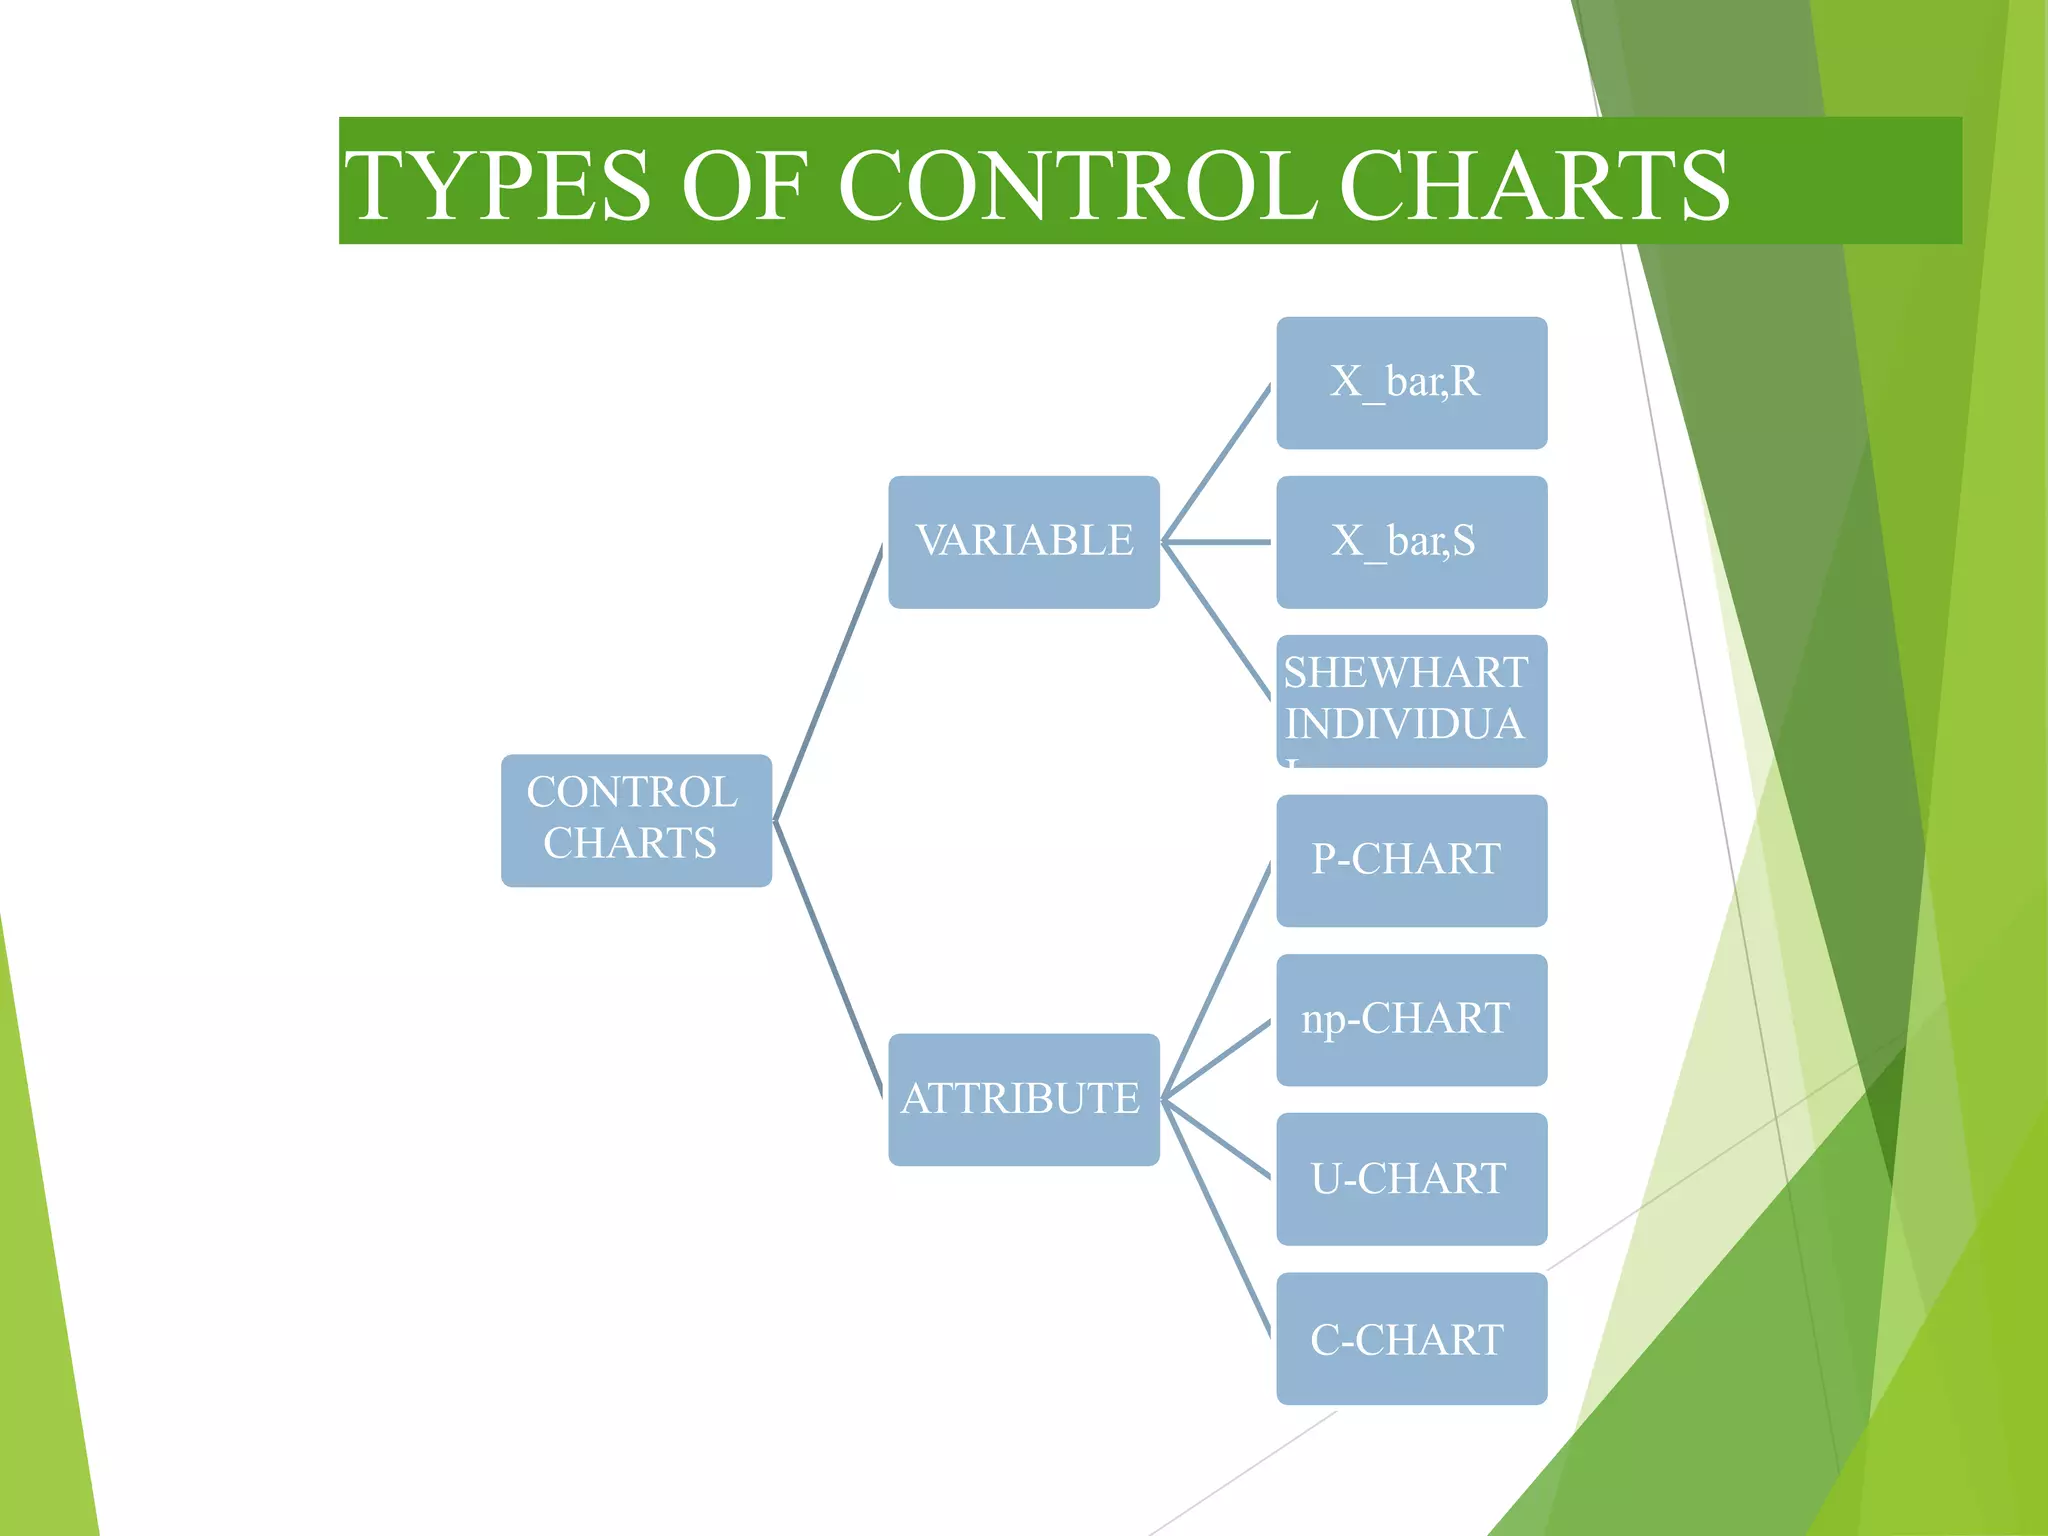
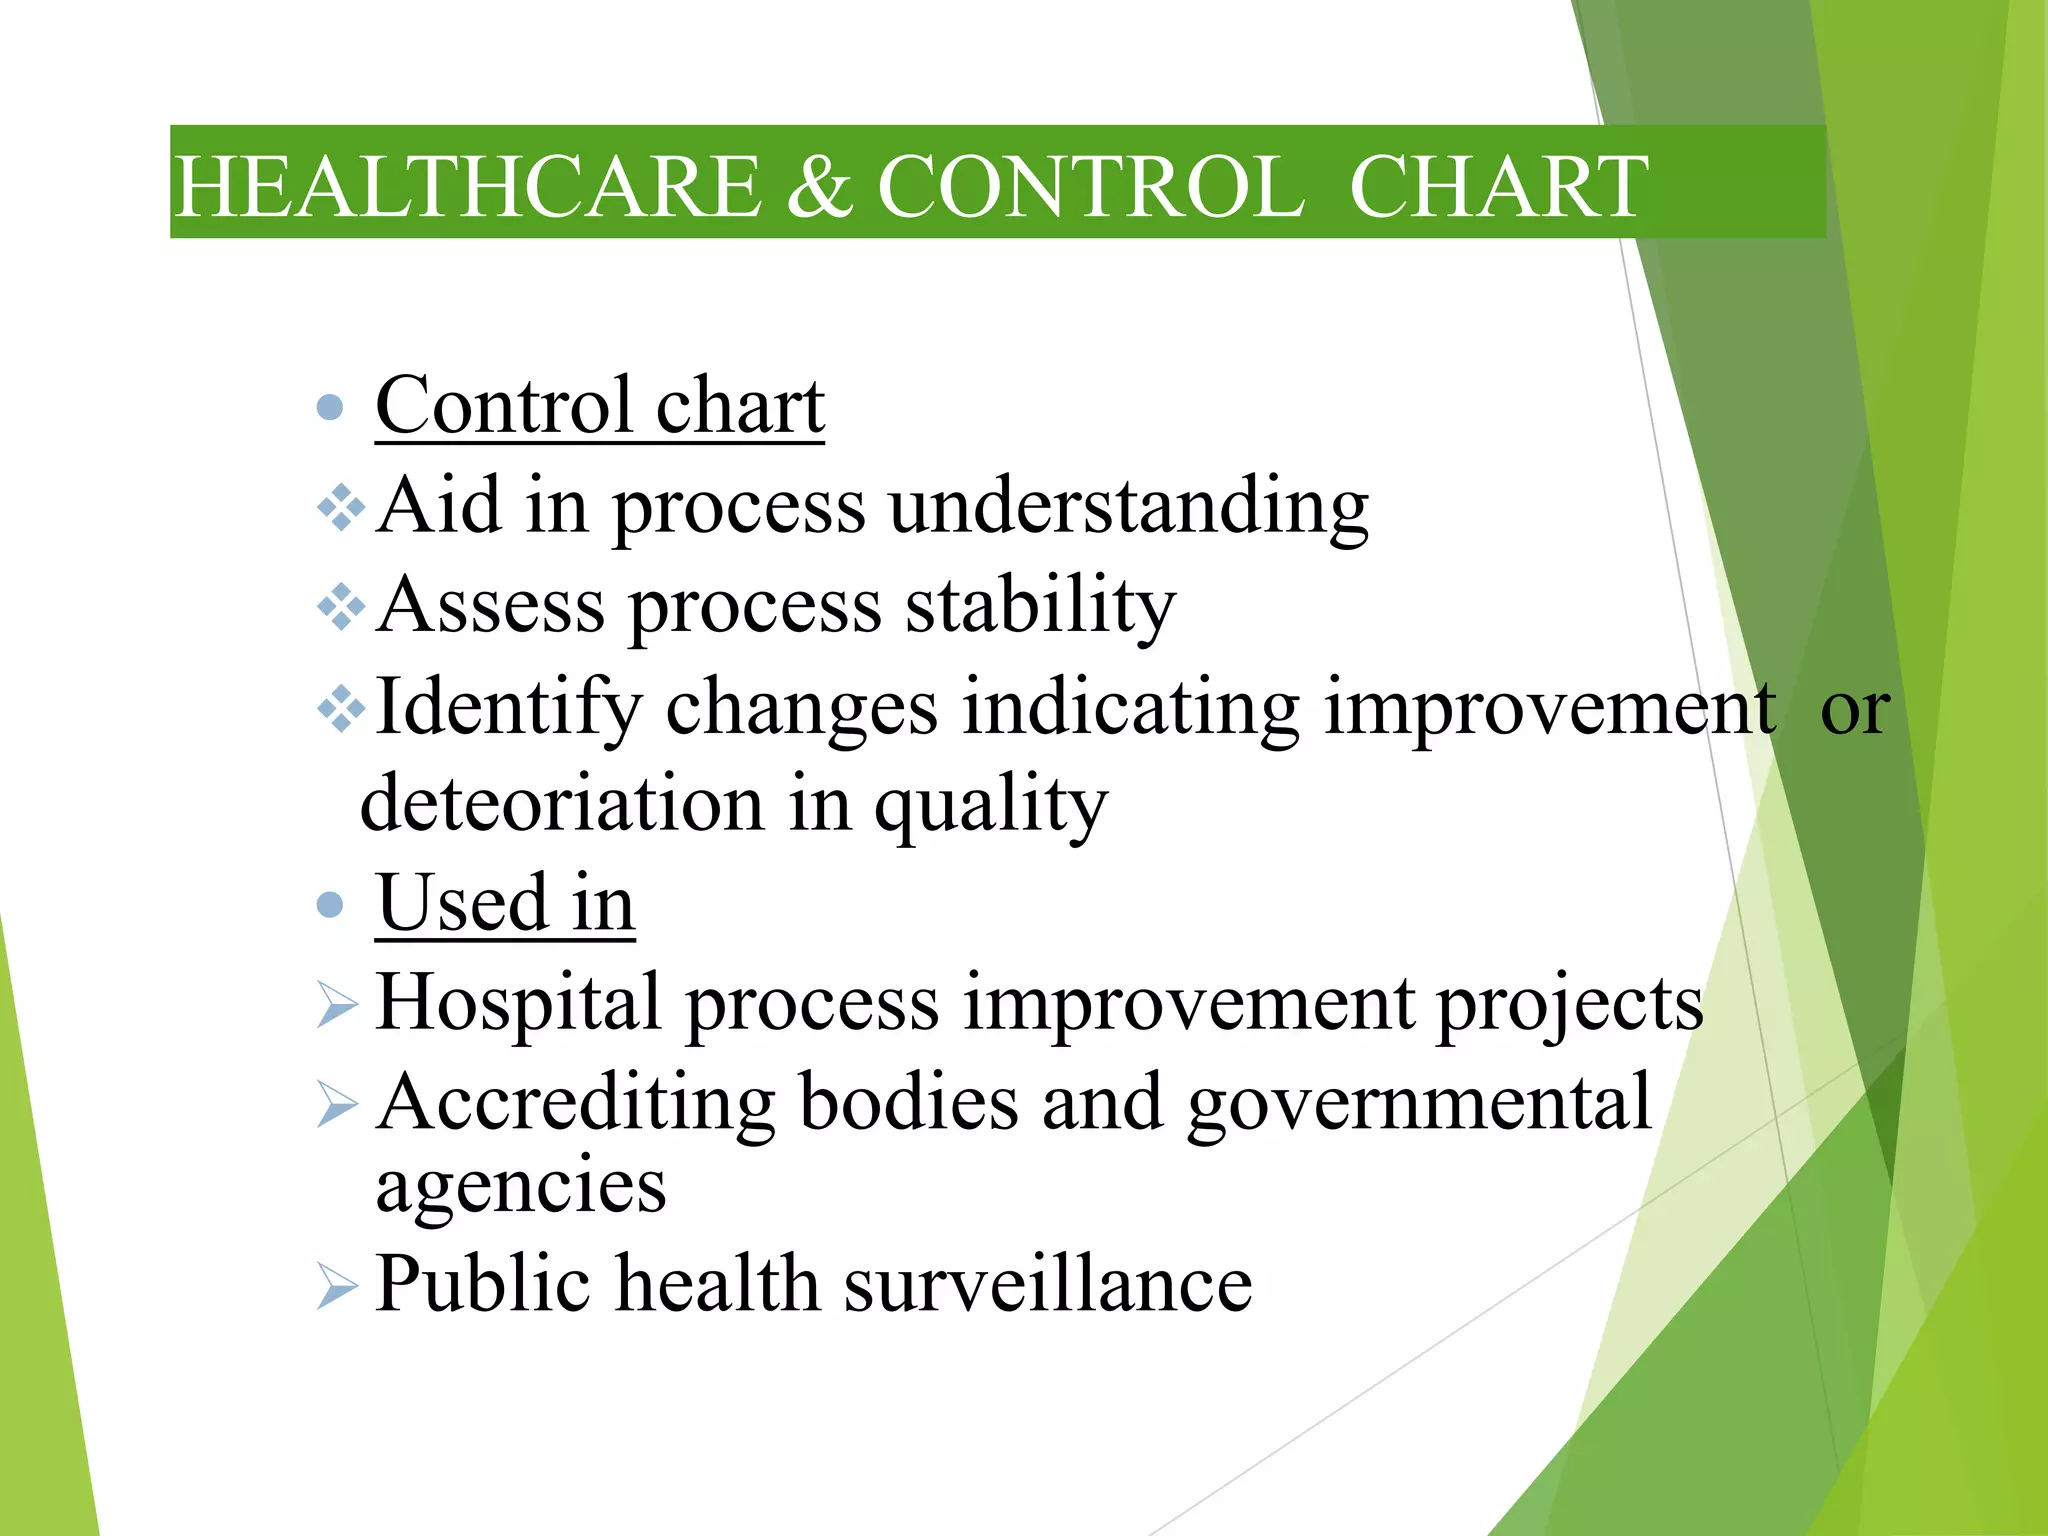
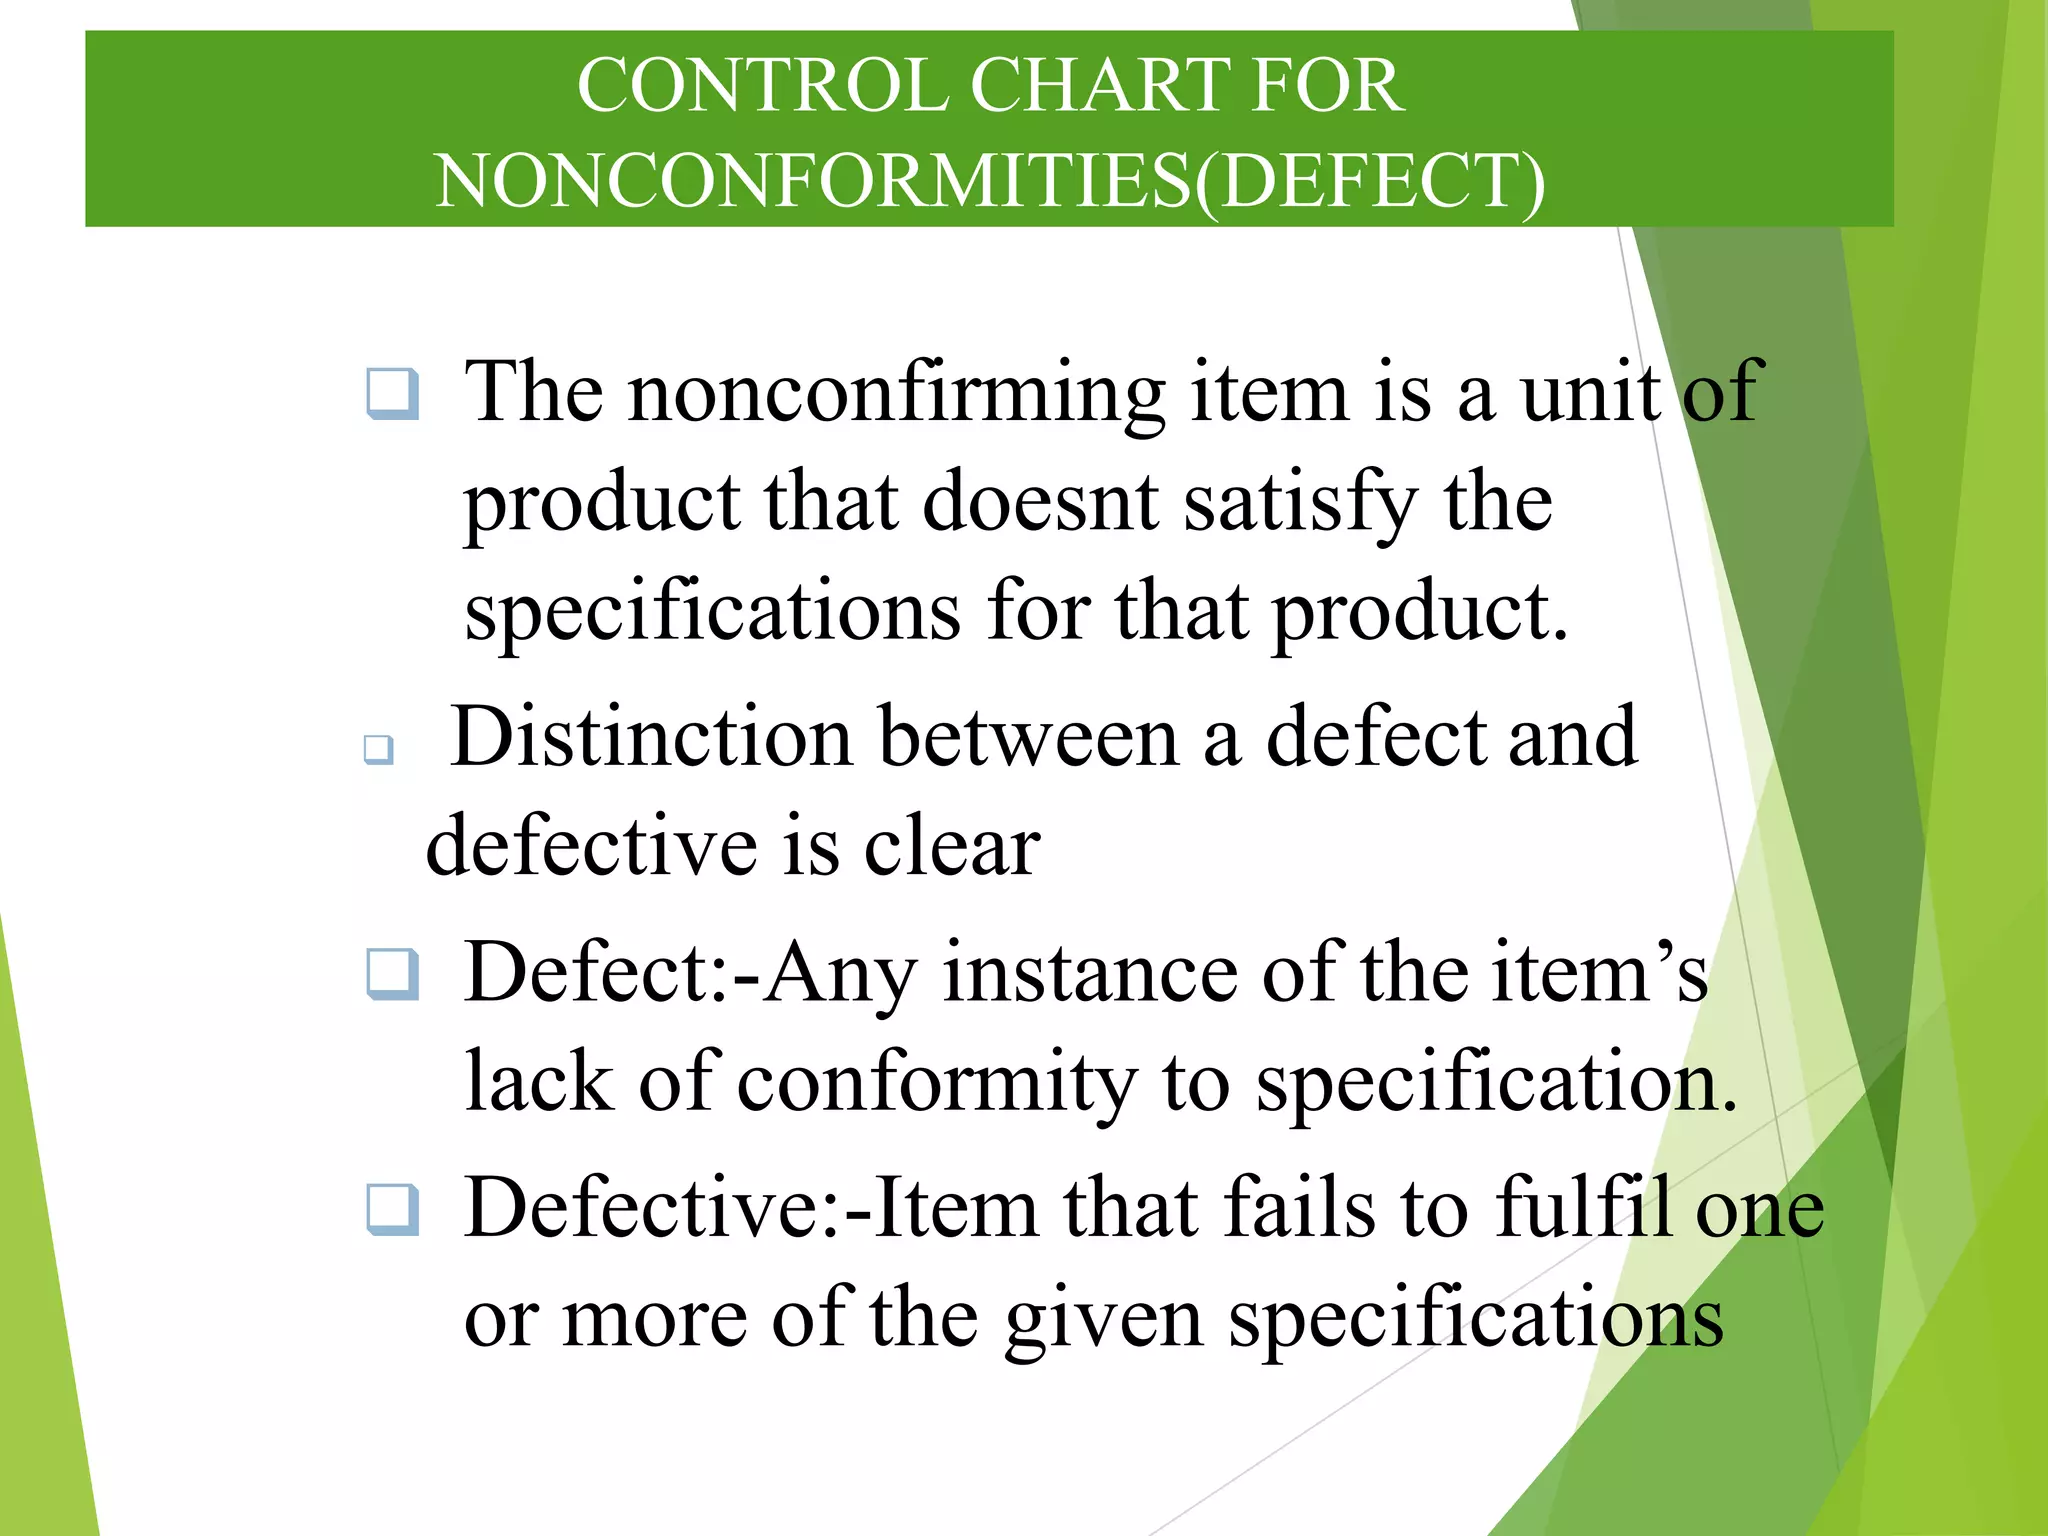
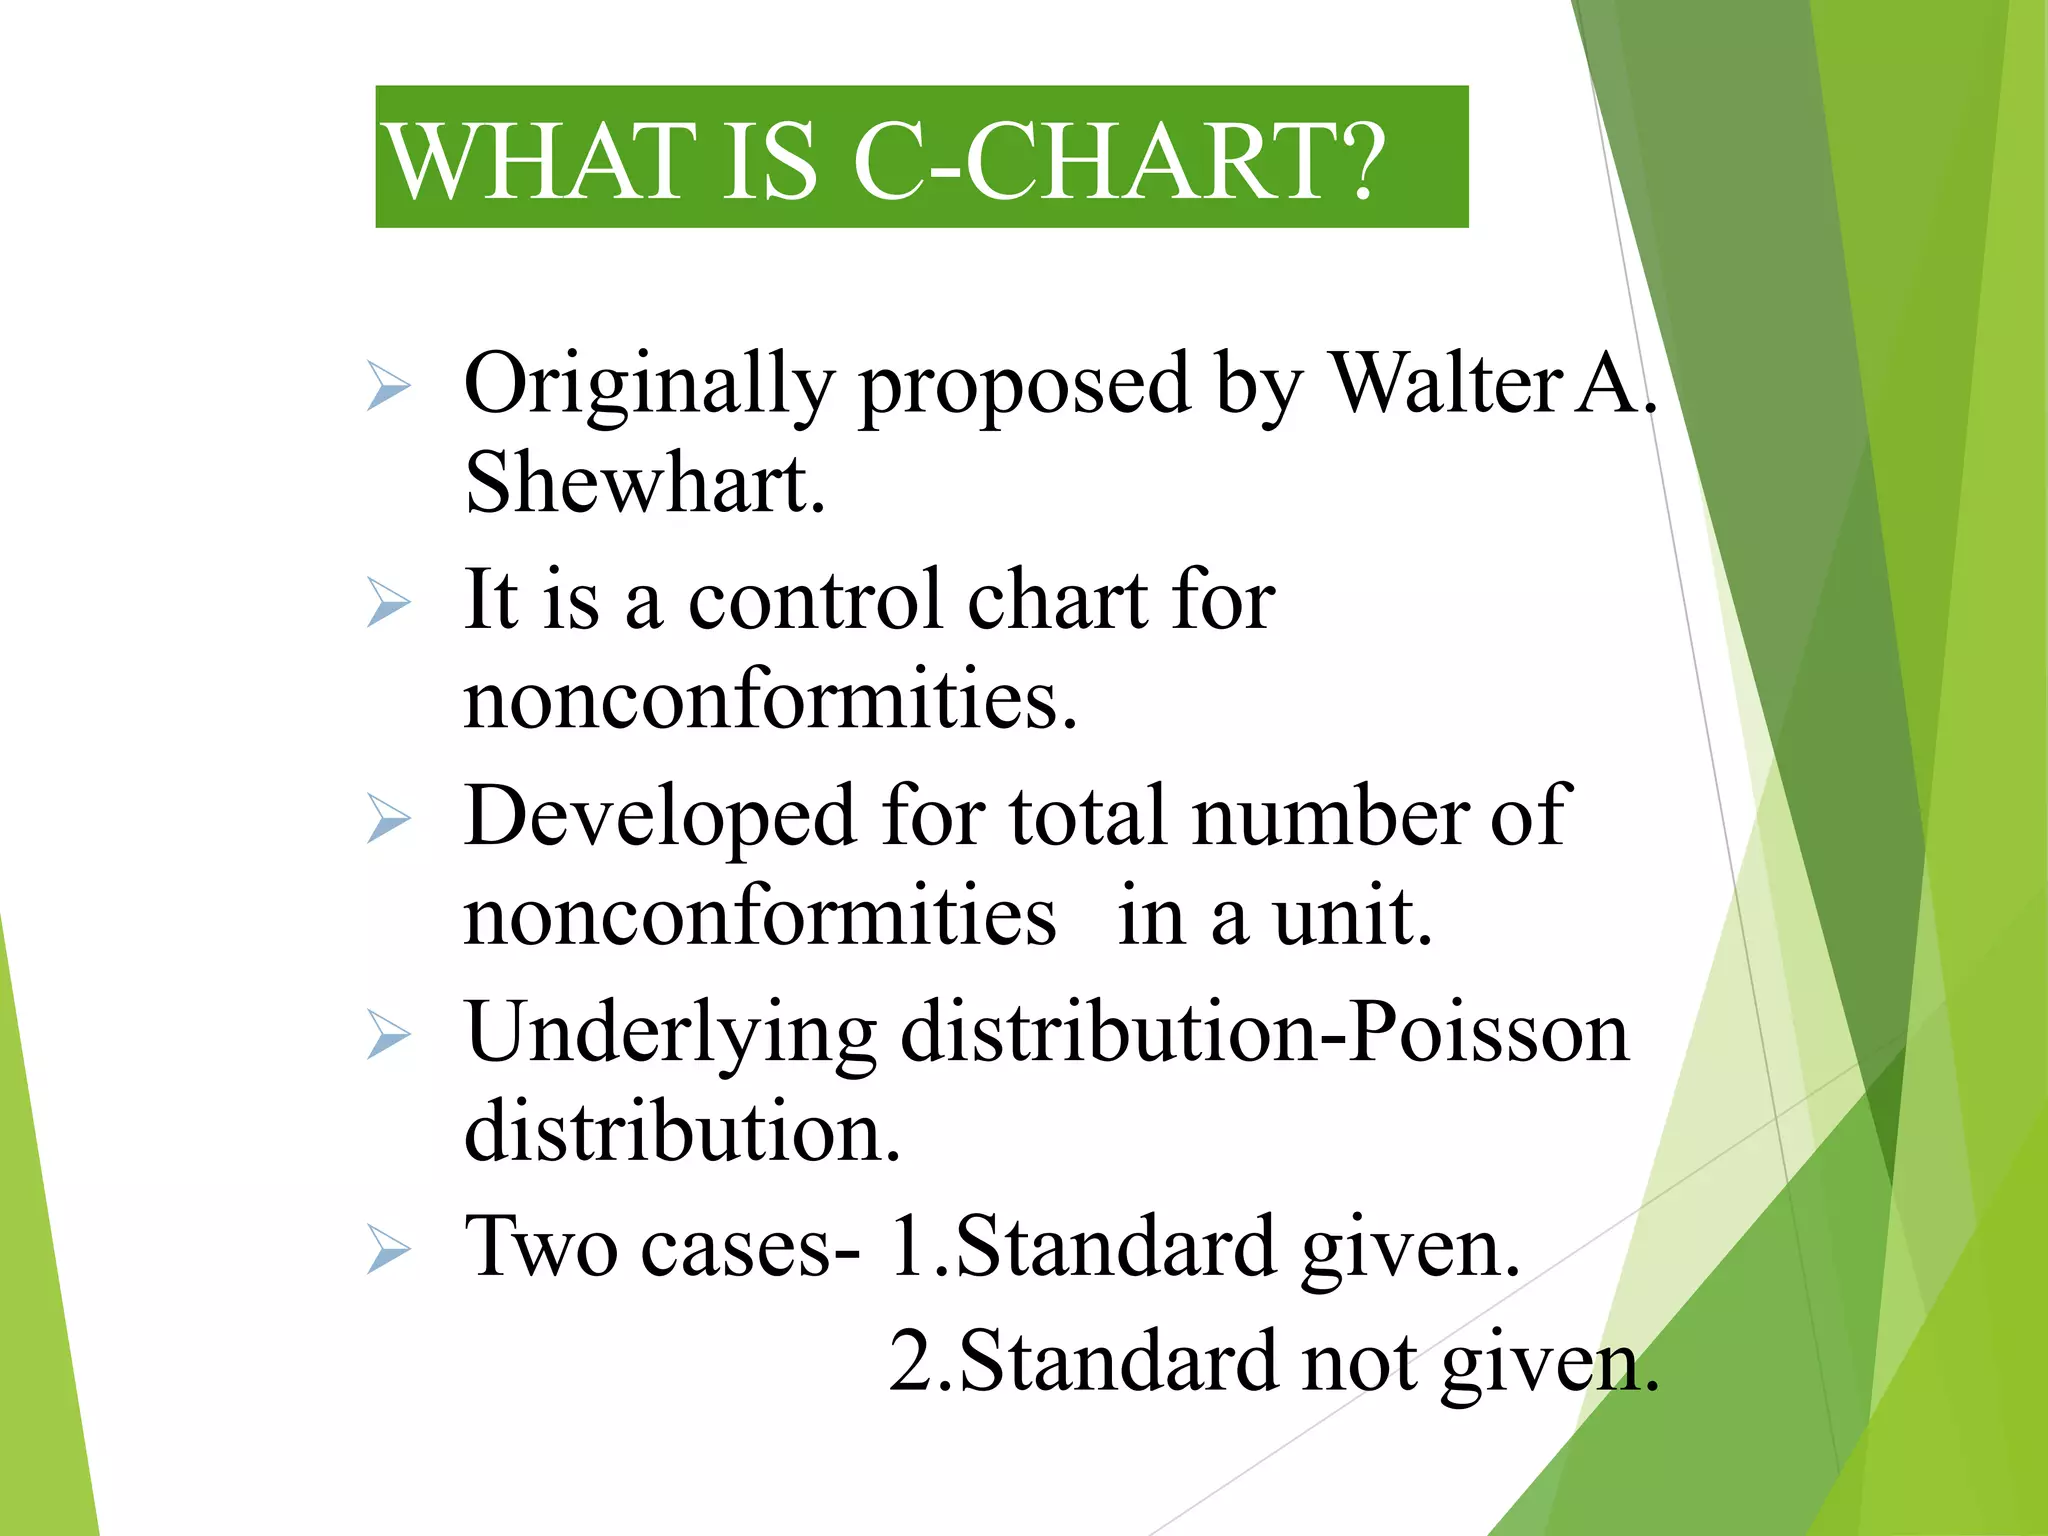
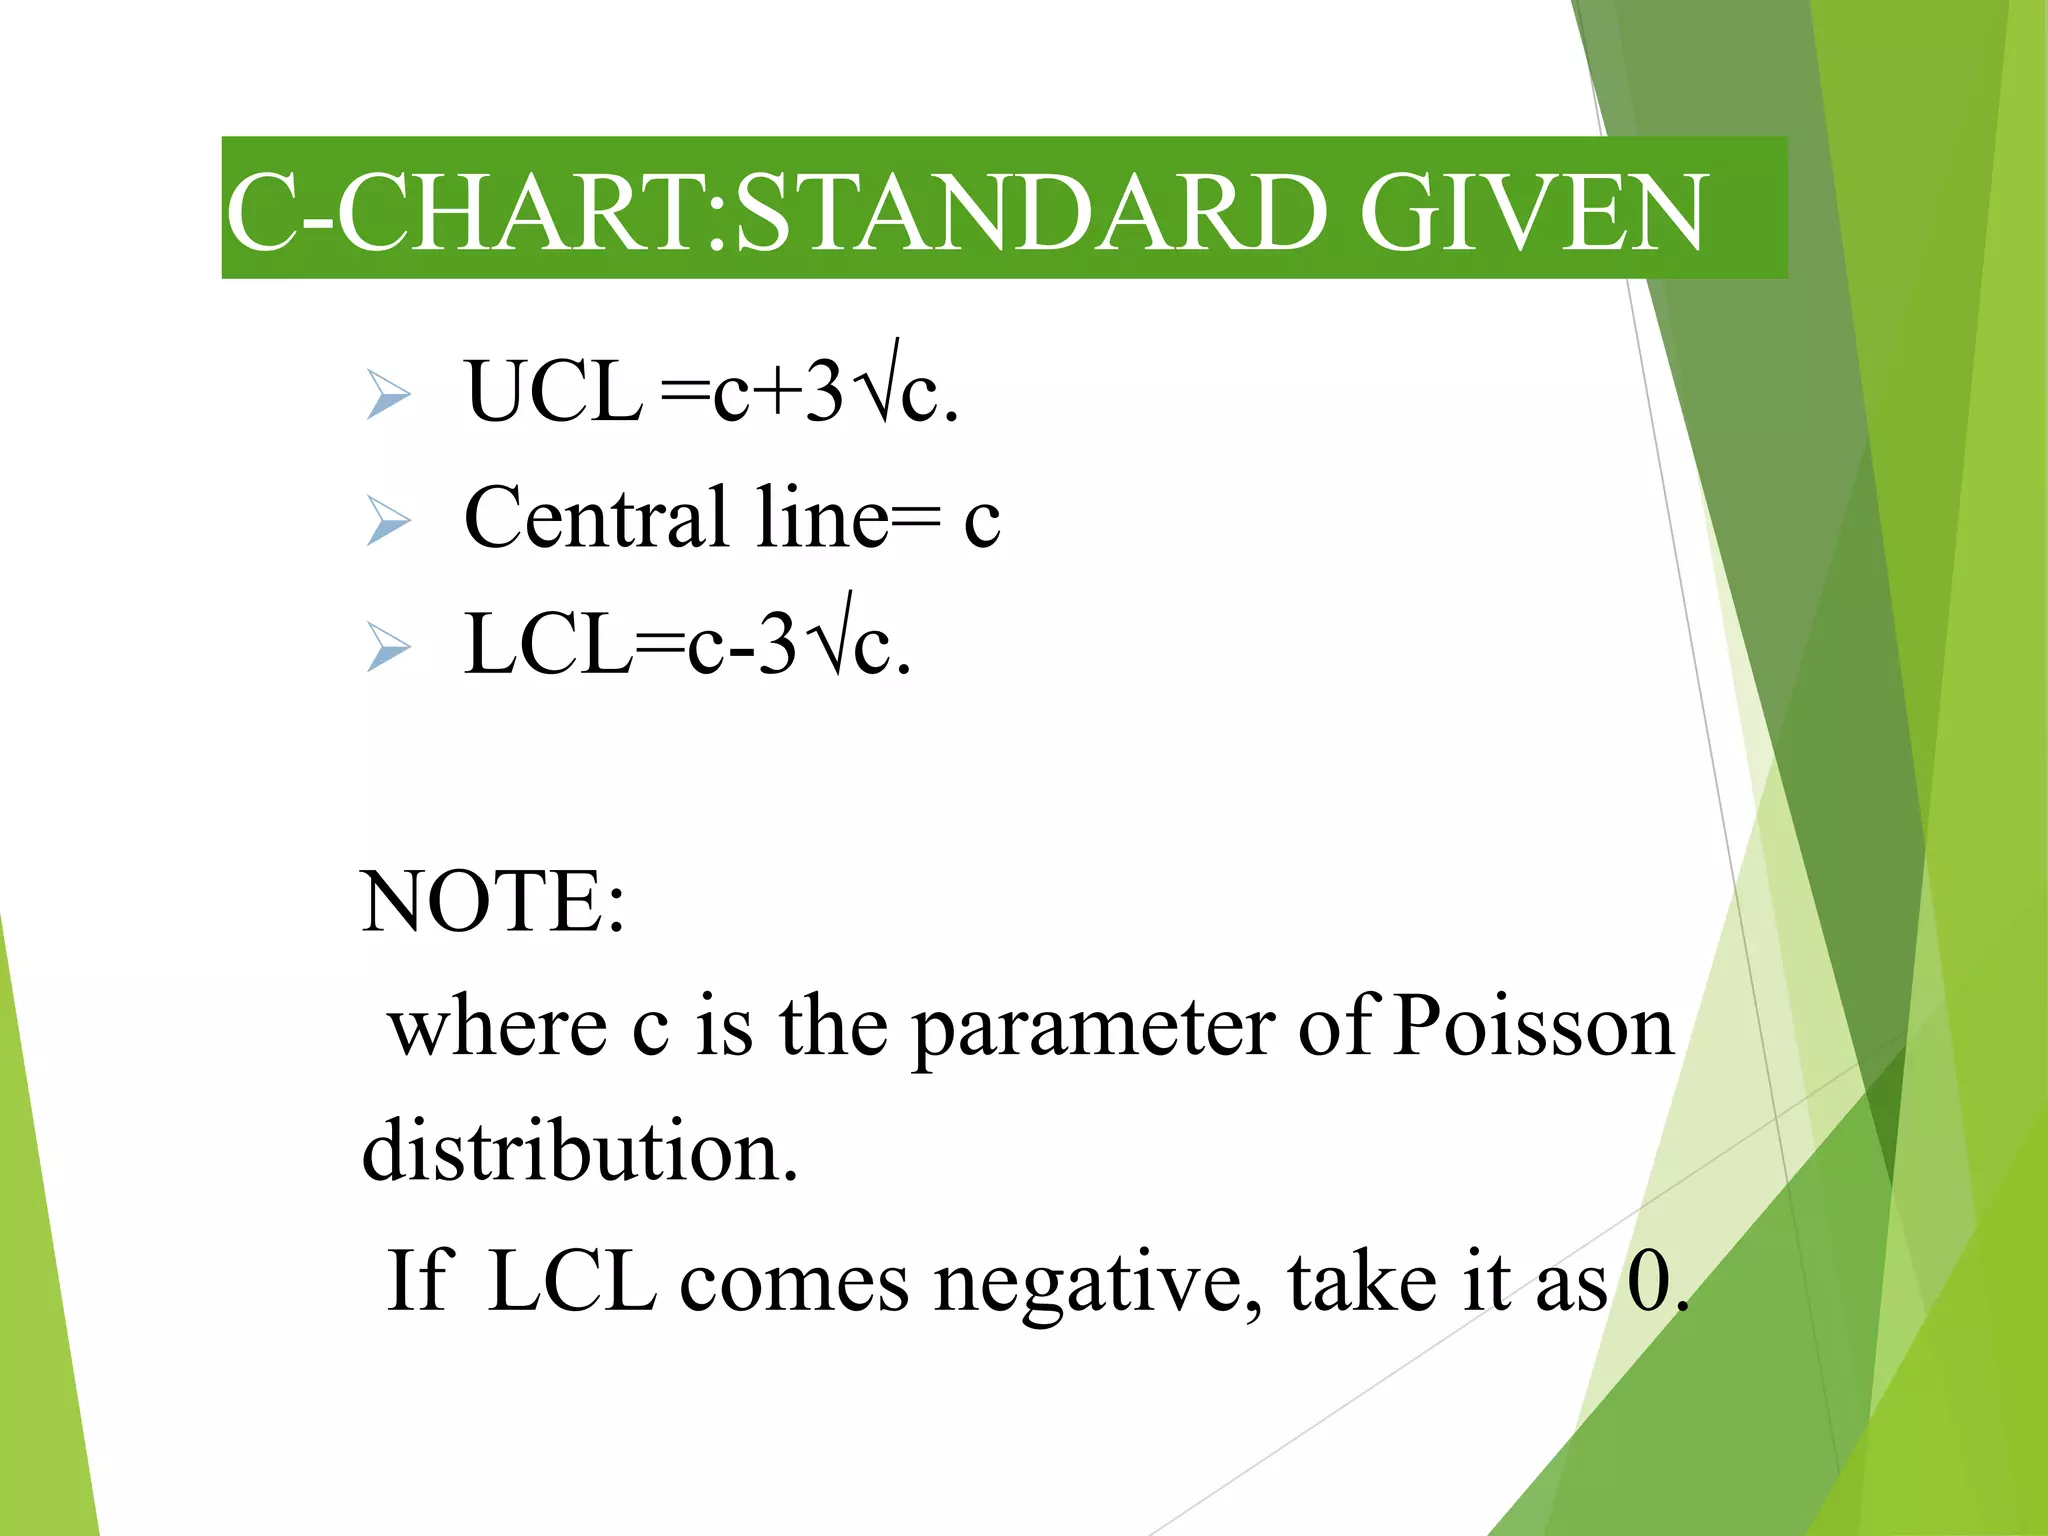
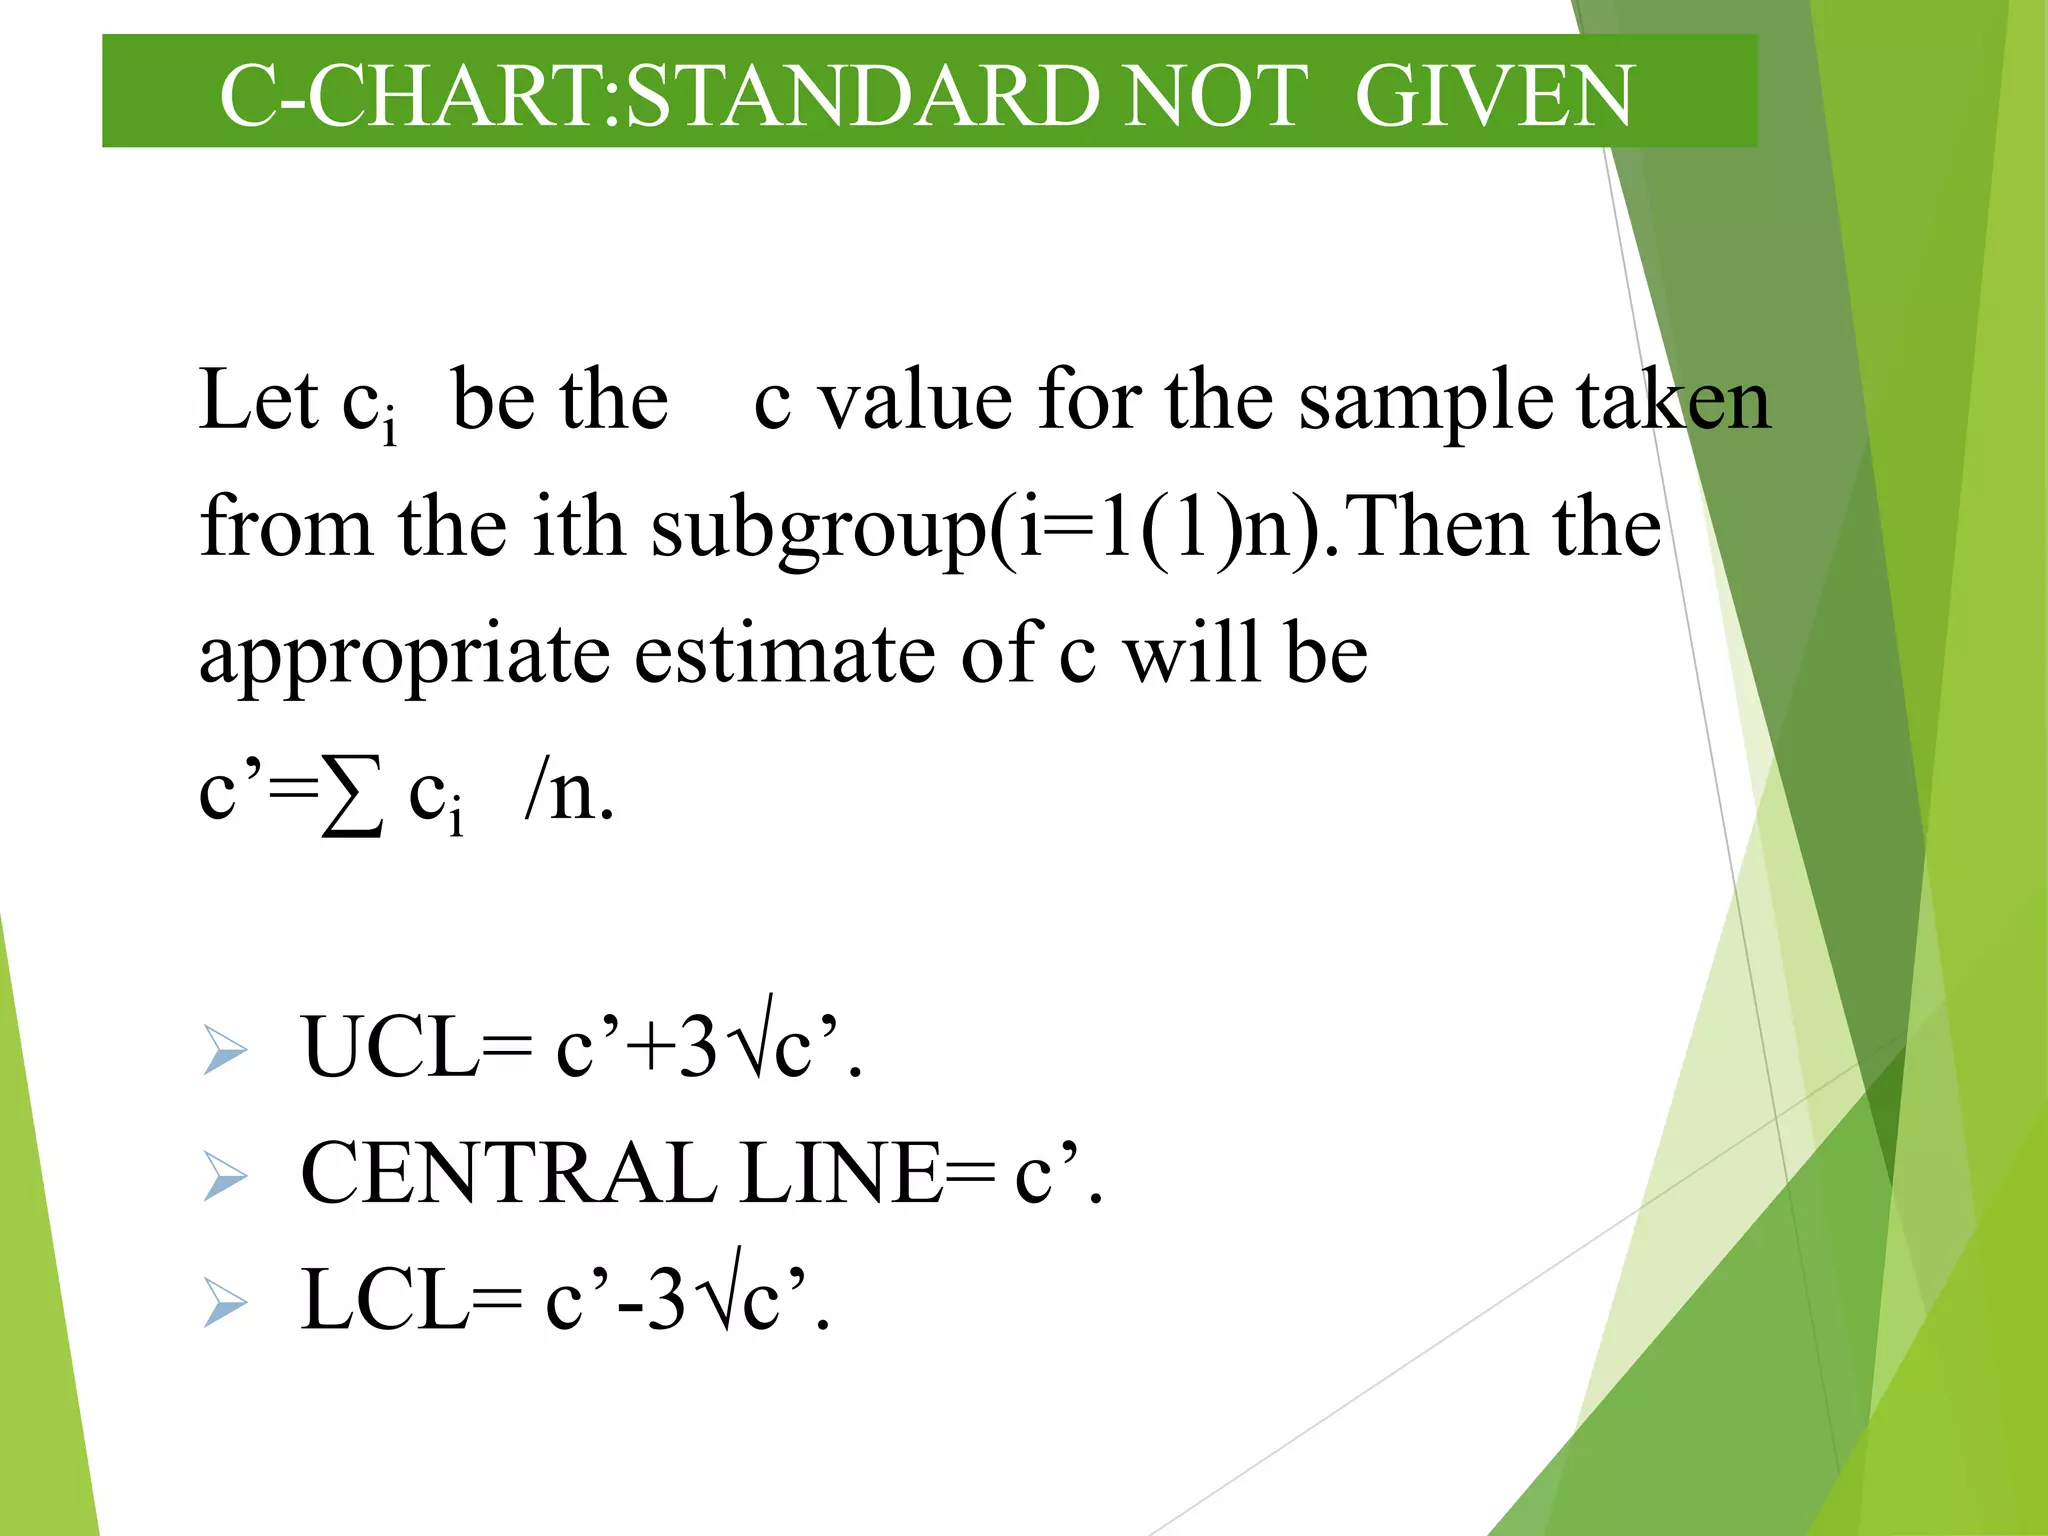
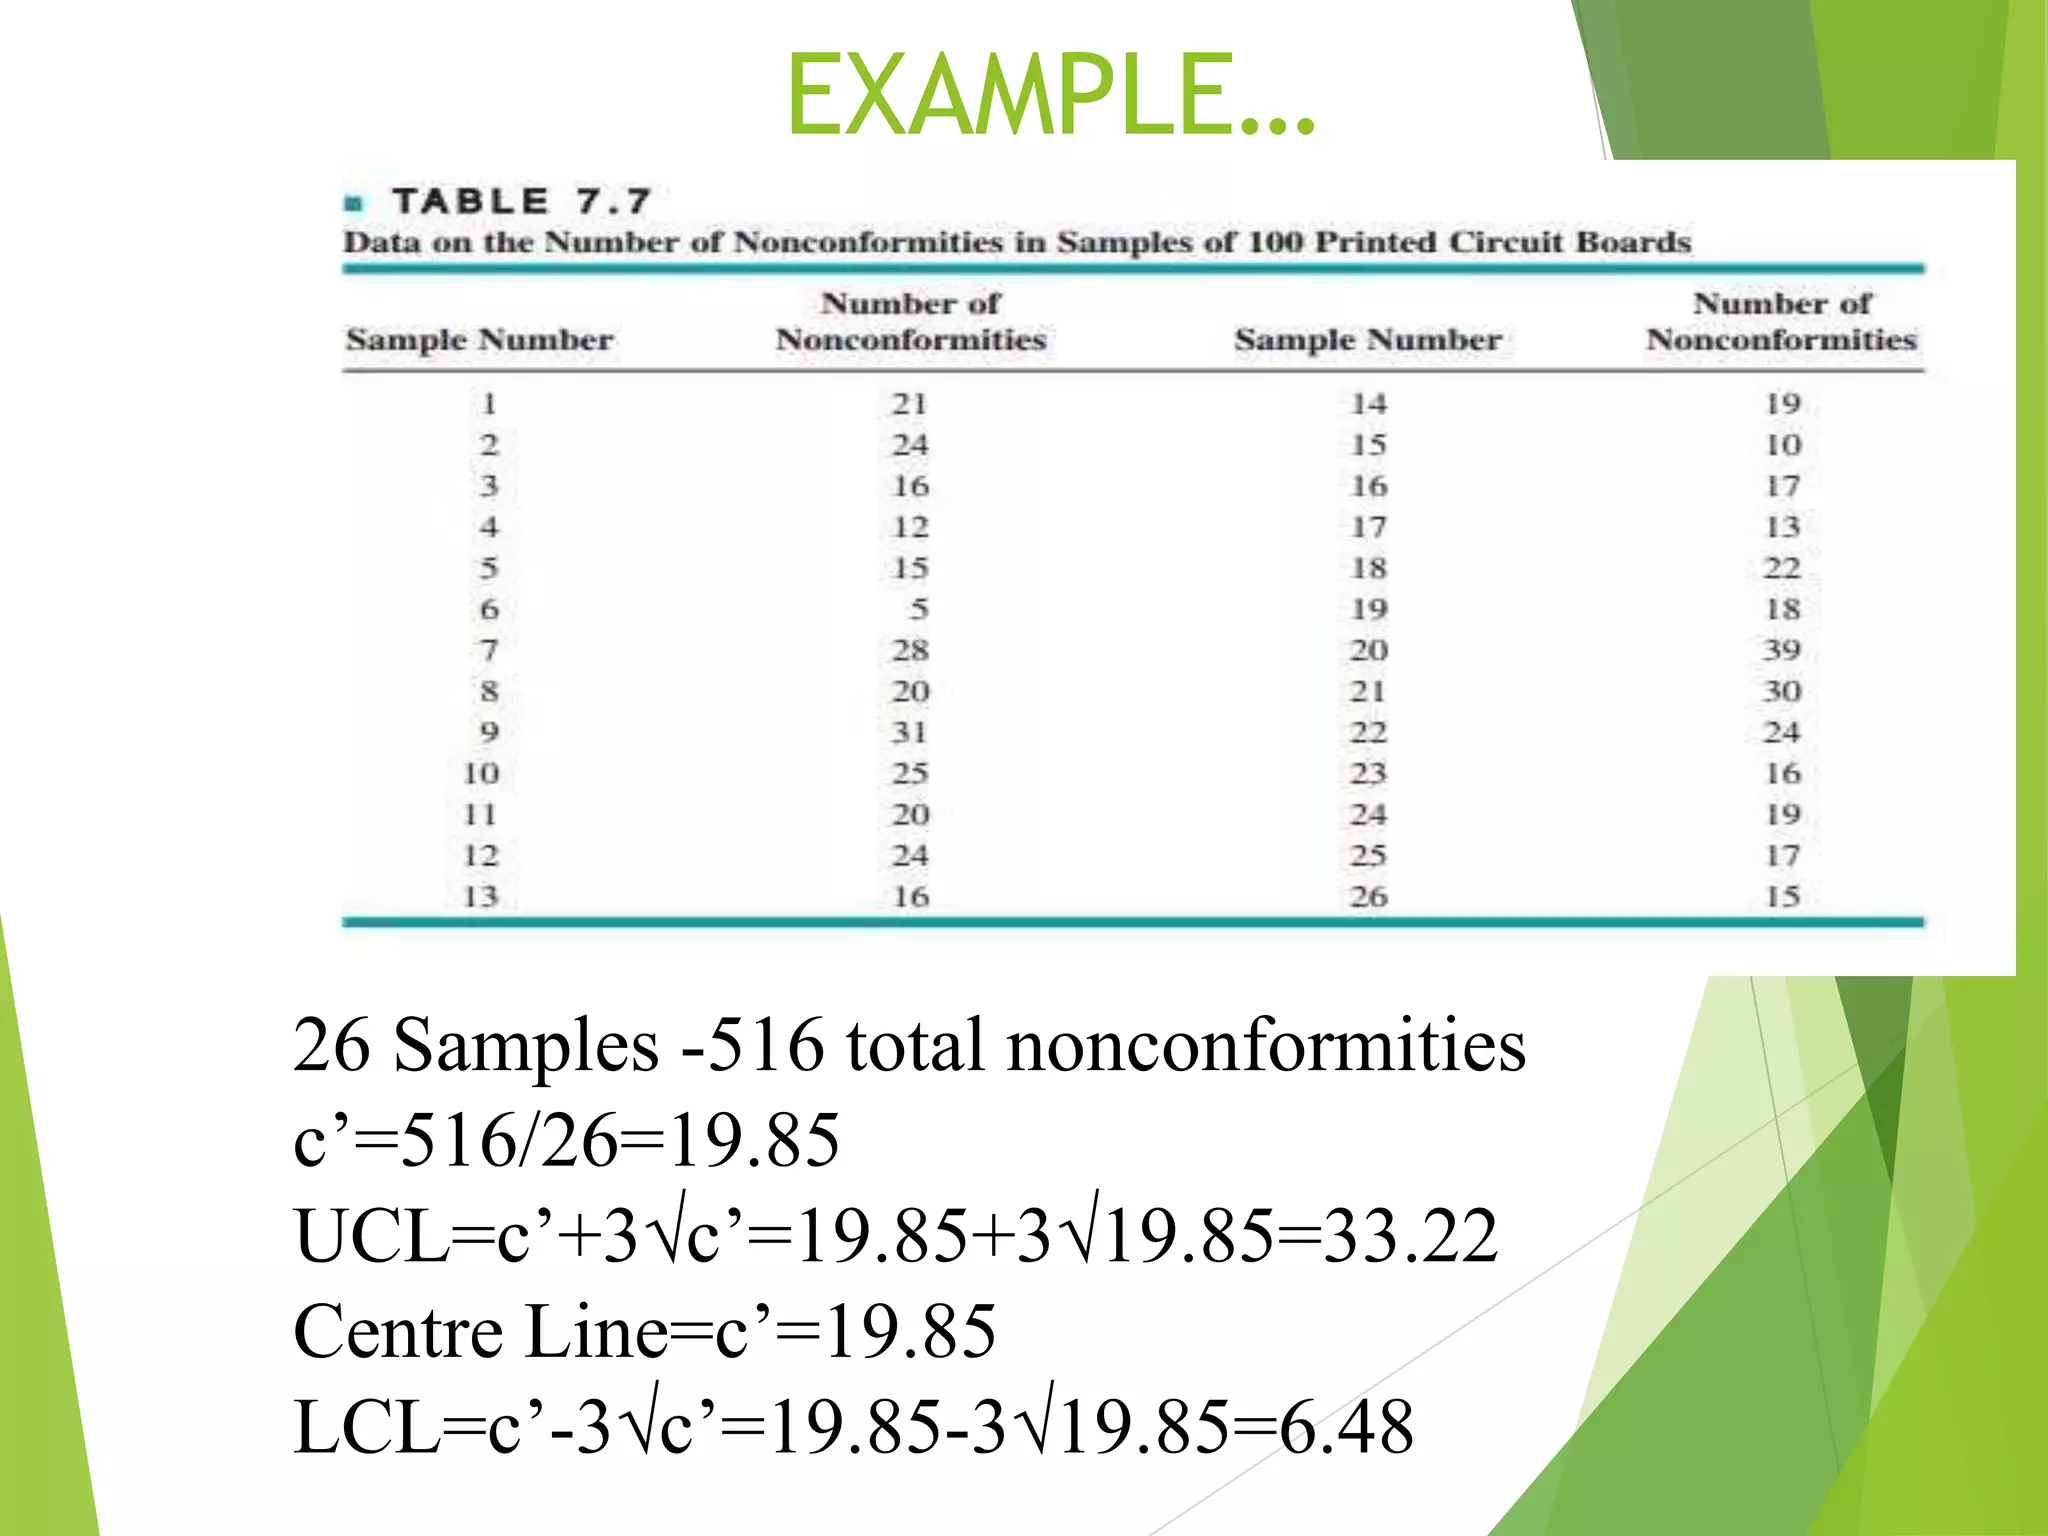
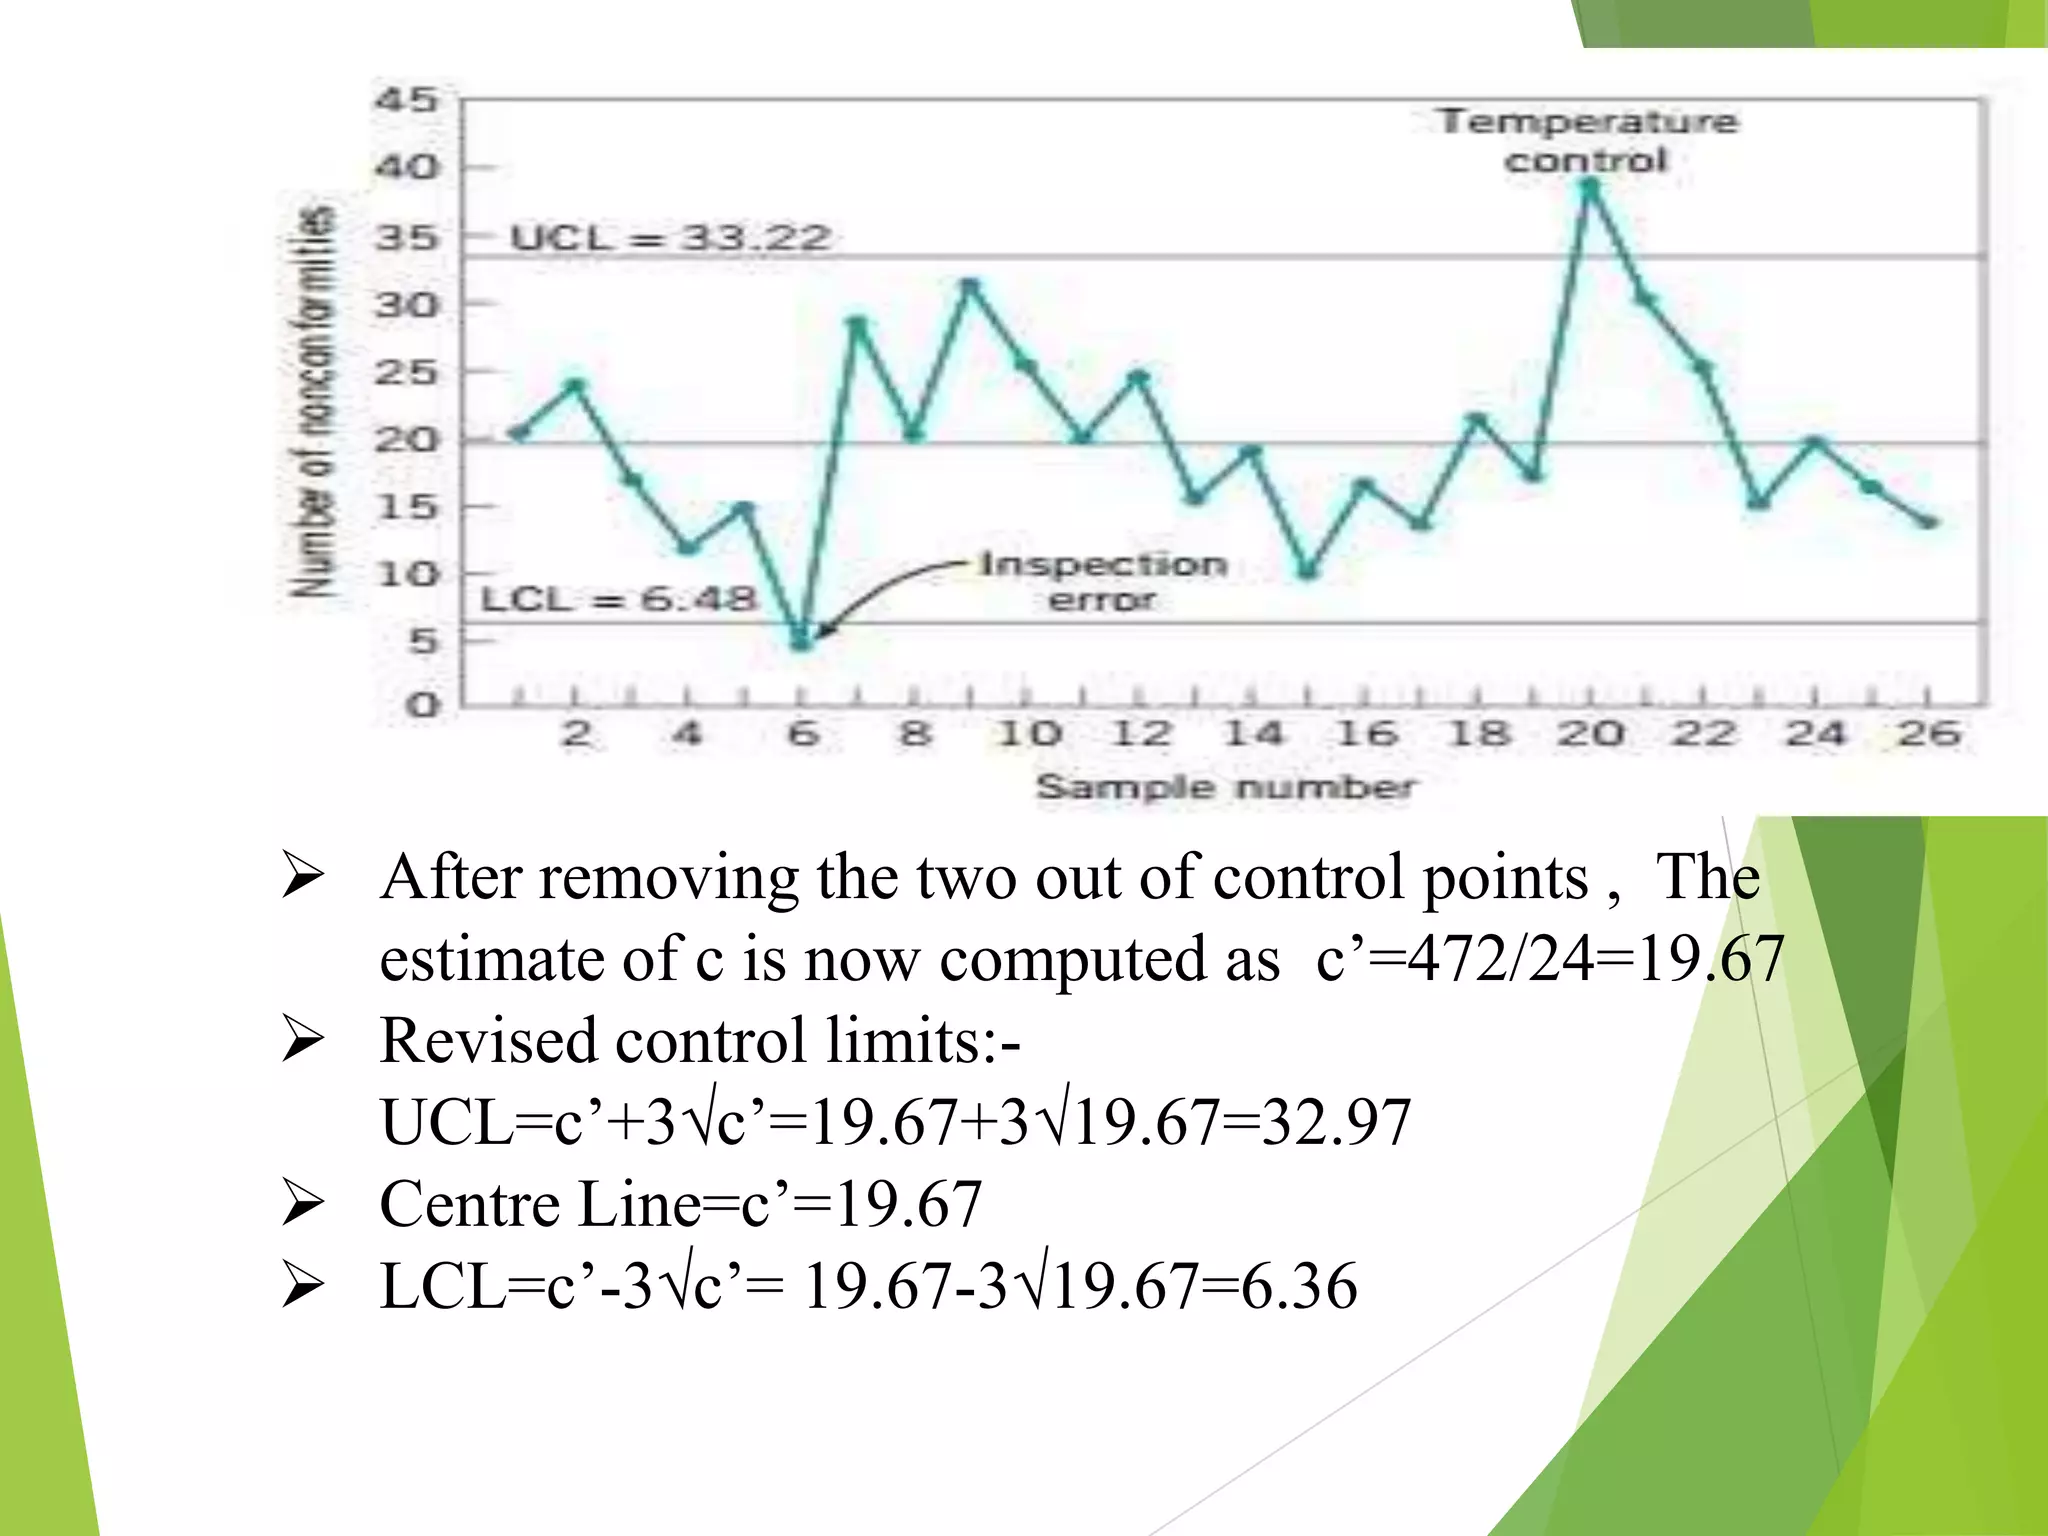
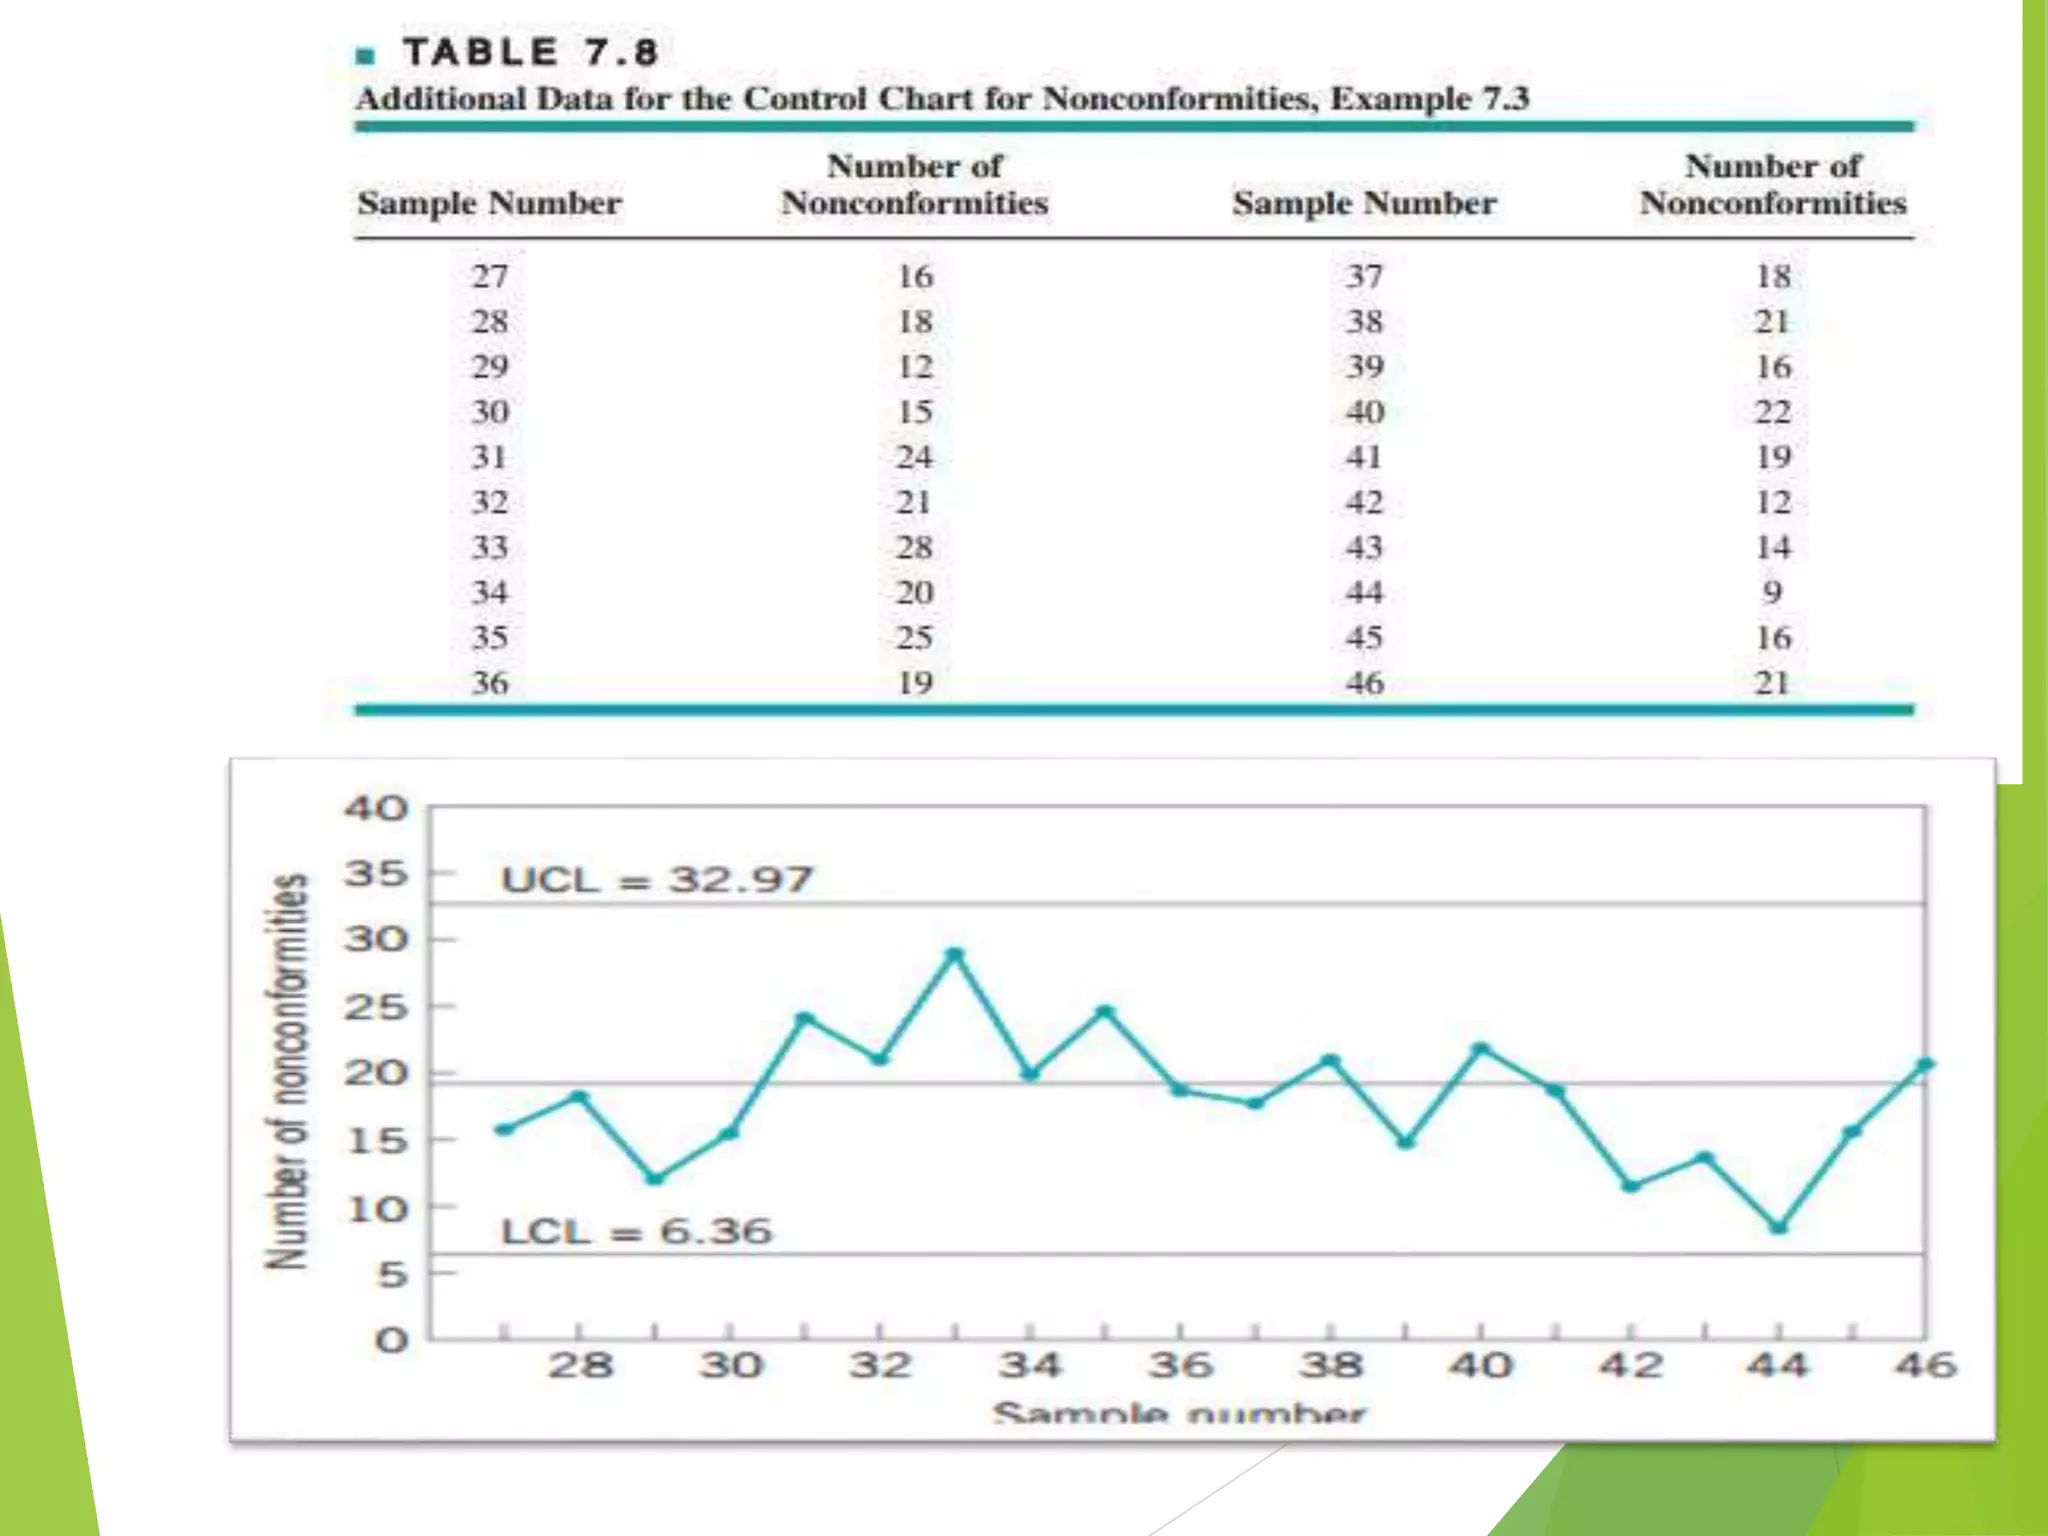

This document discusses C-charts, which are control charts used for nonconformities. C-charts can be used when a standard for nonconformities is given or not given. The chart contains an upper control limit, center line, and lower control limit. C-charts follow a Poisson distribution and are useful for healthcare process improvement and quality control. Examples are provided to demonstrate how to calculate control limits for a C-chart.


![Control Charts[1]](https://cdn.slidesharecdn.com/ss_thumbnails/controlcharts1-1226081330857138-9-thumbnail.jpg?width=640&height=640&fit=bounds)


![Chapter9[1]](https://cdn.slidesharecdn.com/ss_thumbnails/chapter91-140613050946-phpapp02-thumbnail.jpg?width=640&height=640&fit=bounds)
![Production & Operation Management Chapter9[1]](https://cdn.slidesharecdn.com/ss_thumbnails/chapter91-140613051446-phpapp02-thumbnail.jpg?width=640&height=640&fit=bounds)


![ch20[1].ppt](https://cdn.slidesharecdn.com/ss_thumbnails/ch201-230310224339-ed5e9422-thumbnail.jpg?width=640&height=640&fit=bounds)


