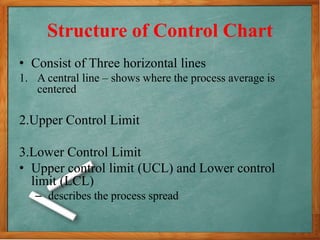
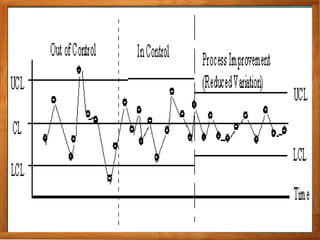
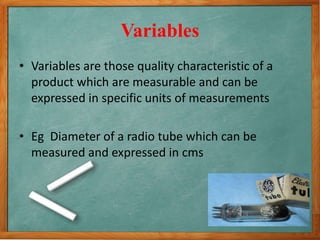
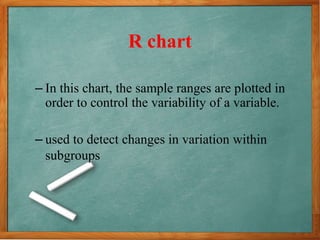
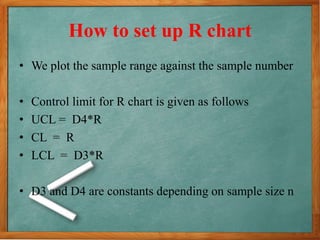
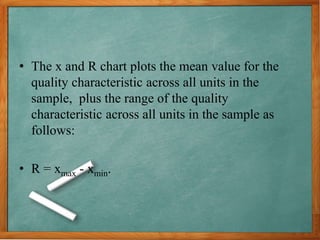
Control Charts
International Institute Of Population Science
Source : Fundamentals Of Applied Statistics
By
Smruti Mokal &
Tejal Lakhan
Structure of Control Chart
• Consist of Three horizontal lines
1. A central line – shows where the process average is
centered
2.Upper Control Limit
3.Lower Control Limit
• Upper control limit (UCL) and Lower control
limit (LCL)
– describes the process spread
Variables
• Variables are those quality characteristic of a
product which are measurable and can be
expressed in specific units of measurements
• Eg Diameter of a radio tube which can be
measured and expressed in cms
R chart
– In this chart, the sample ranges are plotted in
order to control the variability of a variable.
– used to detect changes in variation within
subgroups
How to set up R chart
• We plot the sample range against the sample number
• Control limit for R chart is given as follows
• UCL = D4*R
• CL = R
• LCL = D3*R
• D3 and D4 are constants depending on sample size n
• The x and R chart plots the mean value for the
quality characteristic across all units in the
sample, plus the range of the quality
characteristic across all units in the sample as
follows:
• R = xmax - xmin.
R chart
R chart

R chart

  • 1.
    Control Charts International InstituteOf Population Science Source : Fundamentals Of Applied Statistics By Smruti Mokal & Tejal Lakhan
  • 2.
    Structure of ControlChart • Consist of Three horizontal lines 1. A central line – shows where the process average is centered 2.Upper Control Limit 3.Lower Control Limit • Upper control limit (UCL) and Lower control limit (LCL) – describes the process spread
  • 4.
    Variables • Variables arethose quality characteristic of a product which are measurable and can be expressed in specific units of measurements • Eg Diameter of a radio tube which can be measured and expressed in cms
  • 5.
    R chart – Inthis chart, the sample ranges are plotted in order to control the variability of a variable. – used to detect changes in variation within subgroups
  • 6.
    How to setup R chart • We plot the sample range against the sample number • Control limit for R chart is given as follows • UCL = D4*R • CL = R • LCL = D3*R • D3 and D4 are constants depending on sample size n
  • 7.
    • The xand R chart plots the mean value for the quality characteristic across all units in the sample, plus the range of the quality characteristic across all units in the sample as follows: • R = xmax - xmin.