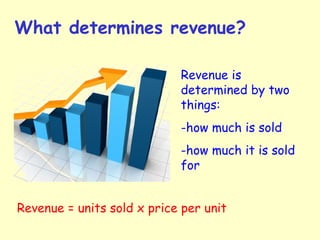
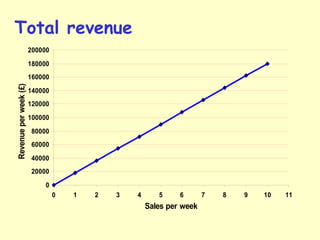
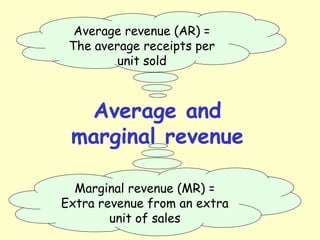
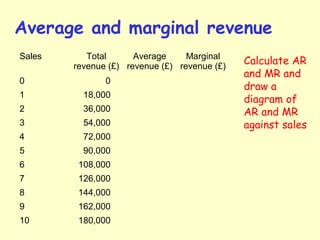
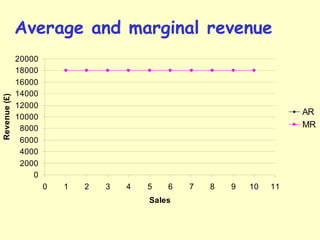
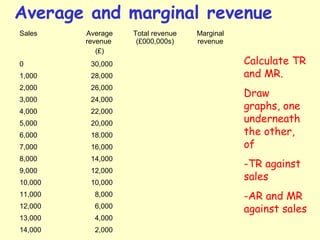
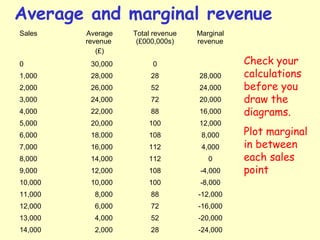
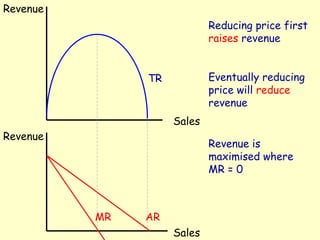
RevenueRevenue
Learning outcomes
Understand
what is meant
by revenue
Define and calculate total,
average and marginal
revenue
Understand the
determinants of
revenue
What is revenue?
Revenue is the
receipt of money
from the sale of a
firm’s output of
goods or services in a
given time period.
It is the money
coming in to a firm.
What determines revenue?
Revenue is
determined by two
things:
-how much is sold
-how much it is sold
for
Revenue = units sold x price per unit
Total revenue
Simplistically, revenue will
rise the more units are sold.
Assume a car dealer sells
new cars at £18,000 each.
Draw a diagram to show how revenue increases
with the amount of new cars sold per week
Total revenue
0
20000
40000
60000
80000
100000
120000
140000
160000
180000
200000
0 1 2 3 4 5 6 7 8 9 10 11
Sales per week
Revenueperweek(£)
Average and
marginal revenue
Average revenue (AR) =
The average receipts per
unit sold
Marginal revenue (MR) =
Extra revenue from an extra
unit of sales
Average and marginal revenue
Sales Total
revenue (£)
Average
revenue (£)
Marginal
revenue (£)
0 0
1 18,000
2 36,000
3 54,000
4 72,000
5 90,000
6 108,000
7 126,000
8 144,000
9 162,000
10 180,000
Calculate AR
and MR and
draw a
diagram of
AR and MR
against sales
Average and marginal revenue
0
2000
4000
6000
8000
10000
12000
14000
16000
18000
20000
0 1 2 3 4 5 6 7 8 9 10 11
Sales
Revenue(£)
AR
MR
Price, demand and revenue
Often firms will have to cut
prices to sell more output.
Citroen is likely to sell more
new cars by reducing prices.
It does this by offering
‘cashbacks’.
The inverse relationship between price and
sales is known as the ‘law of demand’ – the lower
the price the higher the demand
Average and marginal revenue
Calculate TR
and MR.
Draw
graphs, one
underneath
the other,
of
-TR against
sales
-AR and MR
against sales
Sales Average
revenue
(£)
Total revenue
(£000,000s)
Marginal
revenue
0 30,000
1,000 28,000
2,000 26,000
3,000 24,000
4,000 22,000
5,000 20,000
6,000 18,000
7,000 16,000
8,000 14,000
9,000 12,000
10,000 10,000
11,000 8,000
12,000 6,000
13,000 4,000
14,000 2,000
Average and marginal revenue
Sales Average
revenue
(£)
Total revenue
(£000,000s)
Marginal
revenue
0 30,000 0
1,000 28,000 28 28,000
2,000 26,000 52 24,000
3,000 24,000 72 20,000
4,000 22,000 88 16,000
5,000 20,000 100 12,000
6,000 18,000 108 8,000
7,000 16,000 112 4,000
8,000 14,000 112 0
9,000 12,000 108 -4,000
10,000 10,000 100 -8,000
11,000 8,000 88 -12,000
12,000 6,000 72 -16,000
13,000 4,000 52 -20,000
14,000 2,000 28 -24,000
Check your
calculations
before you
draw the
diagrams.
Plot marginal
in between
each sales
point
Sales
Sales
Revenue
Revenue
TR
ARMR
Reducing price first
raises revenue
Eventually reducing
price will reduce
revenue
Revenue is
maximised where
MR = 0

Revenue

  • 1.
  • 2.
    Learning outcomes Understand what ismeant by revenue Define and calculate total, average and marginal revenue Understand the determinants of revenue
  • 3.
    What is revenue? Revenueis the receipt of money from the sale of a firm’s output of goods or services in a given time period. It is the money coming in to a firm.
  • 4.
    What determines revenue? Revenueis determined by two things: -how much is sold -how much it is sold for Revenue = units sold x price per unit
  • 5.
    Total revenue Simplistically, revenuewill rise the more units are sold. Assume a car dealer sells new cars at £18,000 each. Draw a diagram to show how revenue increases with the amount of new cars sold per week
  • 6.
  • 7.
    Average and marginal revenue Averagerevenue (AR) = The average receipts per unit sold Marginal revenue (MR) = Extra revenue from an extra unit of sales
  • 8.
    Average and marginalrevenue Sales Total revenue (£) Average revenue (£) Marginal revenue (£) 0 0 1 18,000 2 36,000 3 54,000 4 72,000 5 90,000 6 108,000 7 126,000 8 144,000 9 162,000 10 180,000 Calculate AR and MR and draw a diagram of AR and MR against sales
  • 9.
    Average and marginalrevenue 0 2000 4000 6000 8000 10000 12000 14000 16000 18000 20000 0 1 2 3 4 5 6 7 8 9 10 11 Sales Revenue(£) AR MR
  • 10.
    Price, demand andrevenue Often firms will have to cut prices to sell more output. Citroen is likely to sell more new cars by reducing prices. It does this by offering ‘cashbacks’. The inverse relationship between price and sales is known as the ‘law of demand’ – the lower the price the higher the demand
  • 11.
    Average and marginalrevenue Calculate TR and MR. Draw graphs, one underneath the other, of -TR against sales -AR and MR against sales Sales Average revenue (£) Total revenue (£000,000s) Marginal revenue 0 30,000 1,000 28,000 2,000 26,000 3,000 24,000 4,000 22,000 5,000 20,000 6,000 18,000 7,000 16,000 8,000 14,000 9,000 12,000 10,000 10,000 11,000 8,000 12,000 6,000 13,000 4,000 14,000 2,000
  • 12.
    Average and marginalrevenue Sales Average revenue (£) Total revenue (£000,000s) Marginal revenue 0 30,000 0 1,000 28,000 28 28,000 2,000 26,000 52 24,000 3,000 24,000 72 20,000 4,000 22,000 88 16,000 5,000 20,000 100 12,000 6,000 18,000 108 8,000 7,000 16,000 112 4,000 8,000 14,000 112 0 9,000 12,000 108 -4,000 10,000 10,000 100 -8,000 11,000 8,000 88 -12,000 12,000 6,000 72 -16,000 13,000 4,000 52 -20,000 14,000 2,000 28 -24,000 Check your calculations before you draw the diagrams. Plot marginal in between each sales point
  • 13.
    Sales Sales Revenue Revenue TR ARMR Reducing price first raisesrevenue Eventually reducing price will reduce revenue Revenue is maximised where MR = 0