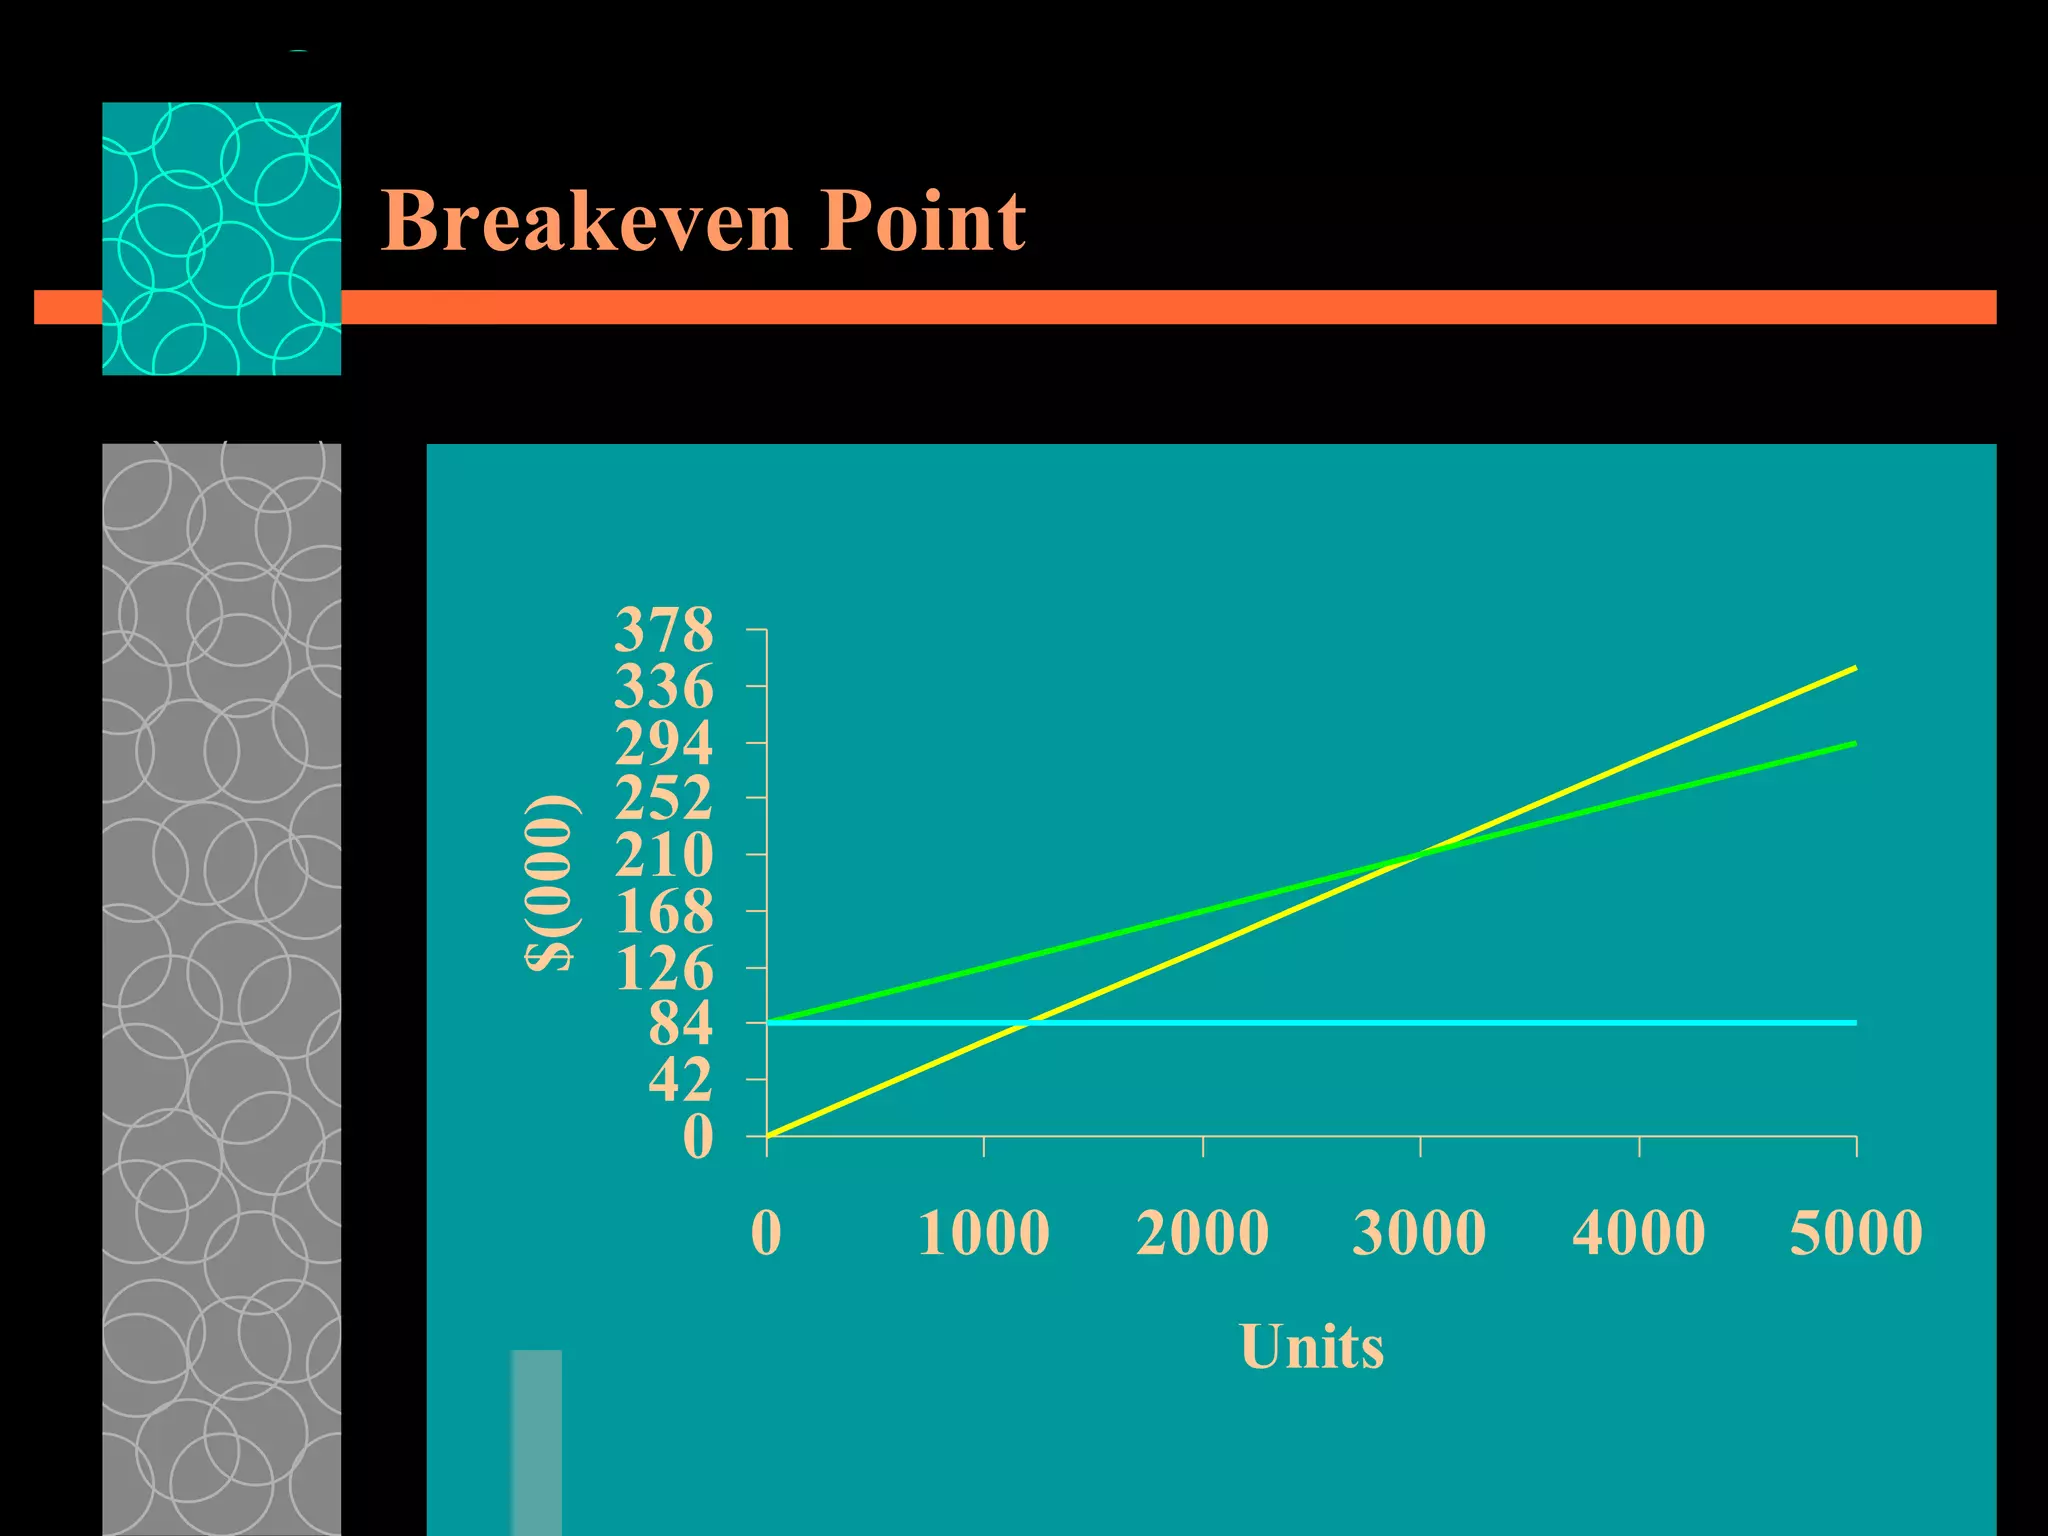
Cost-Volume-Profit Analysis
Cost-Volume-Profit Assumptions Changes in the level of revenues and costs arise only because of changes in the number of product (or service) units produced and sold. Total costs can be divided into a fixed component and a component that is variable with respect to the level of output.
Cost-Volume-Profit Assumptions When graphed, the behavior of total revenues and total costs is linear (straight-line) in relation to output units within the relevant range (and time period). The unit selling price, unit variable costs, and fixed costs are known and constant.
Cost-Volume-Profit Assumptions The analysis either covers a single product or assumes that the sales mix when multiple products are sold will remain constant as the level of total units sold changes. All revenues and costs can be added and compared without taking into account the time value of money.
Cost-Volume-Profit Analysis Operating income = Total revenues from operations – Cost of goods sold and operating costs (excluding income taxes) Net income =  Operating income – Income taxes
Breakeven Point Sales Variable expenses Fixed expenses – = Total revenues = Total costs
Breakeven Point (Selling price  ×  Quantity sold) –  (Variable unit cost  ×  Quantity sold) –  Fixed costs =  Operating income
Breakeven Point
Target Operating Income (Fixed costs + Target operating income) divided either by Contribution margin percentage or Contribution margin per unit

Break Even

  • 1.
  • 2.
    Cost-Volume-Profit Assumptions Changesin the level of revenues and costs arise only because of changes in the number of product (or service) units produced and sold. Total costs can be divided into a fixed component and a component that is variable with respect to the level of output.
  • 3.
    Cost-Volume-Profit Assumptions Whengraphed, the behavior of total revenues and total costs is linear (straight-line) in relation to output units within the relevant range (and time period). The unit selling price, unit variable costs, and fixed costs are known and constant.
  • 4.
    Cost-Volume-Profit Assumptions Theanalysis either covers a single product or assumes that the sales mix when multiple products are sold will remain constant as the level of total units sold changes. All revenues and costs can be added and compared without taking into account the time value of money.
  • 5.
    Cost-Volume-Profit Analysis Operatingincome = Total revenues from operations – Cost of goods sold and operating costs (excluding income taxes) Net income = Operating income – Income taxes
  • 6.
    Breakeven Point SalesVariable expenses Fixed expenses – = Total revenues = Total costs
  • 7.
    Breakeven Point (Sellingprice × Quantity sold) – (Variable unit cost × Quantity sold) – Fixed costs = Operating income
  • 8.
  • 9.
    Target Operating Income(Fixed costs + Target operating income) divided either by Contribution margin percentage or Contribution margin per unit