Downloaded 116 times

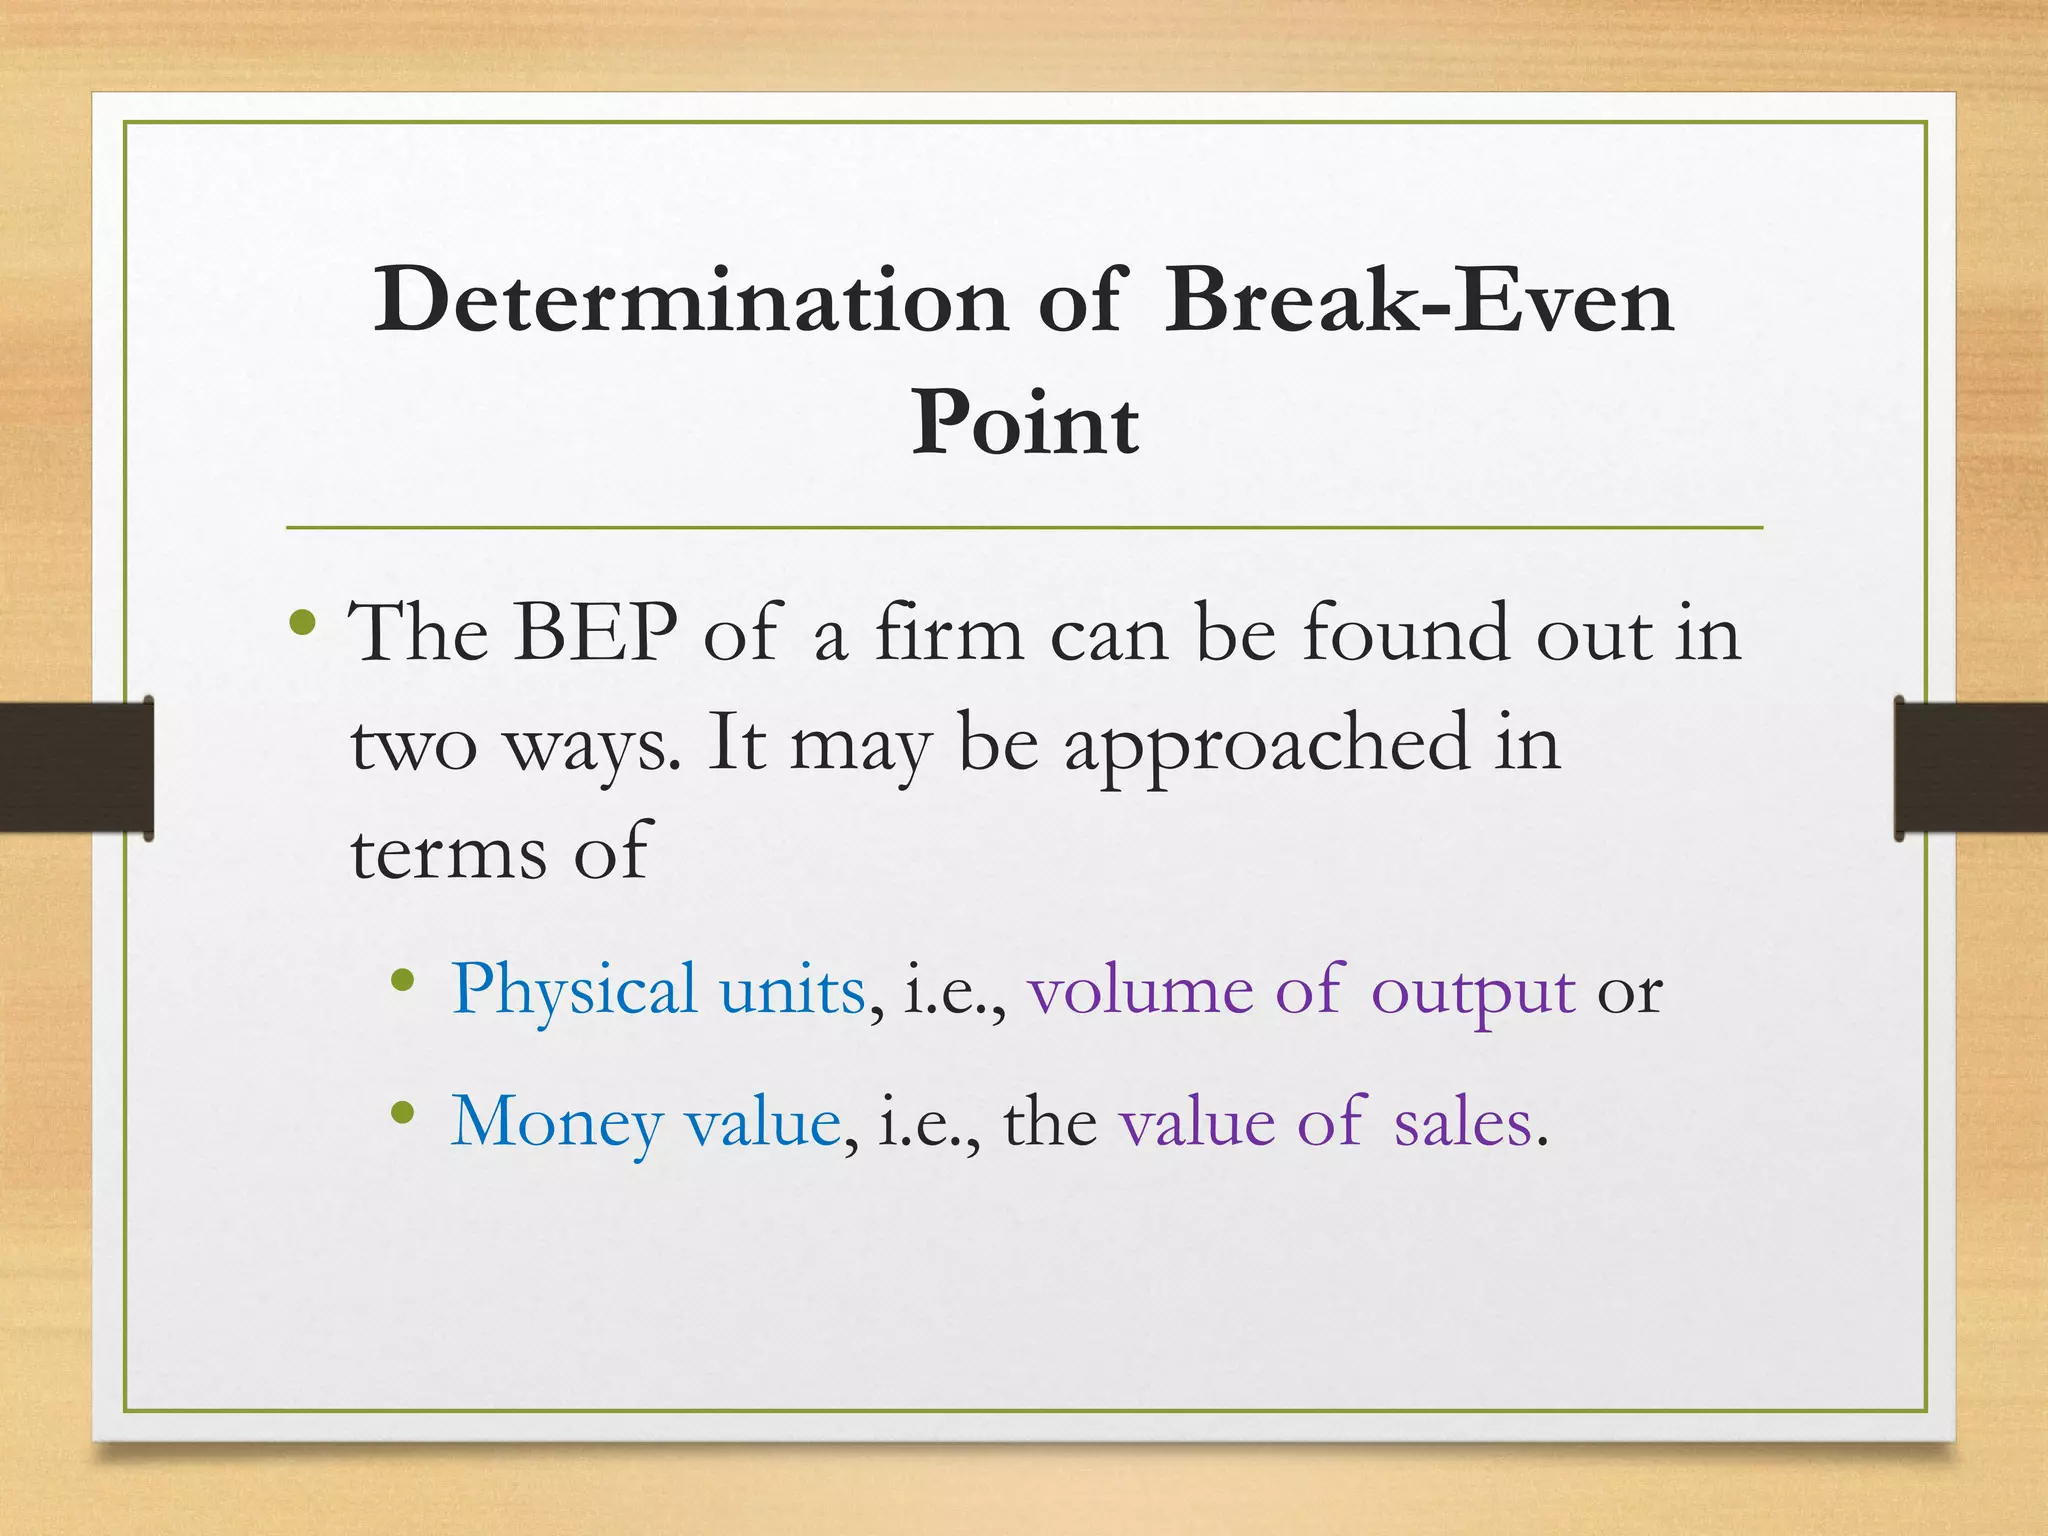
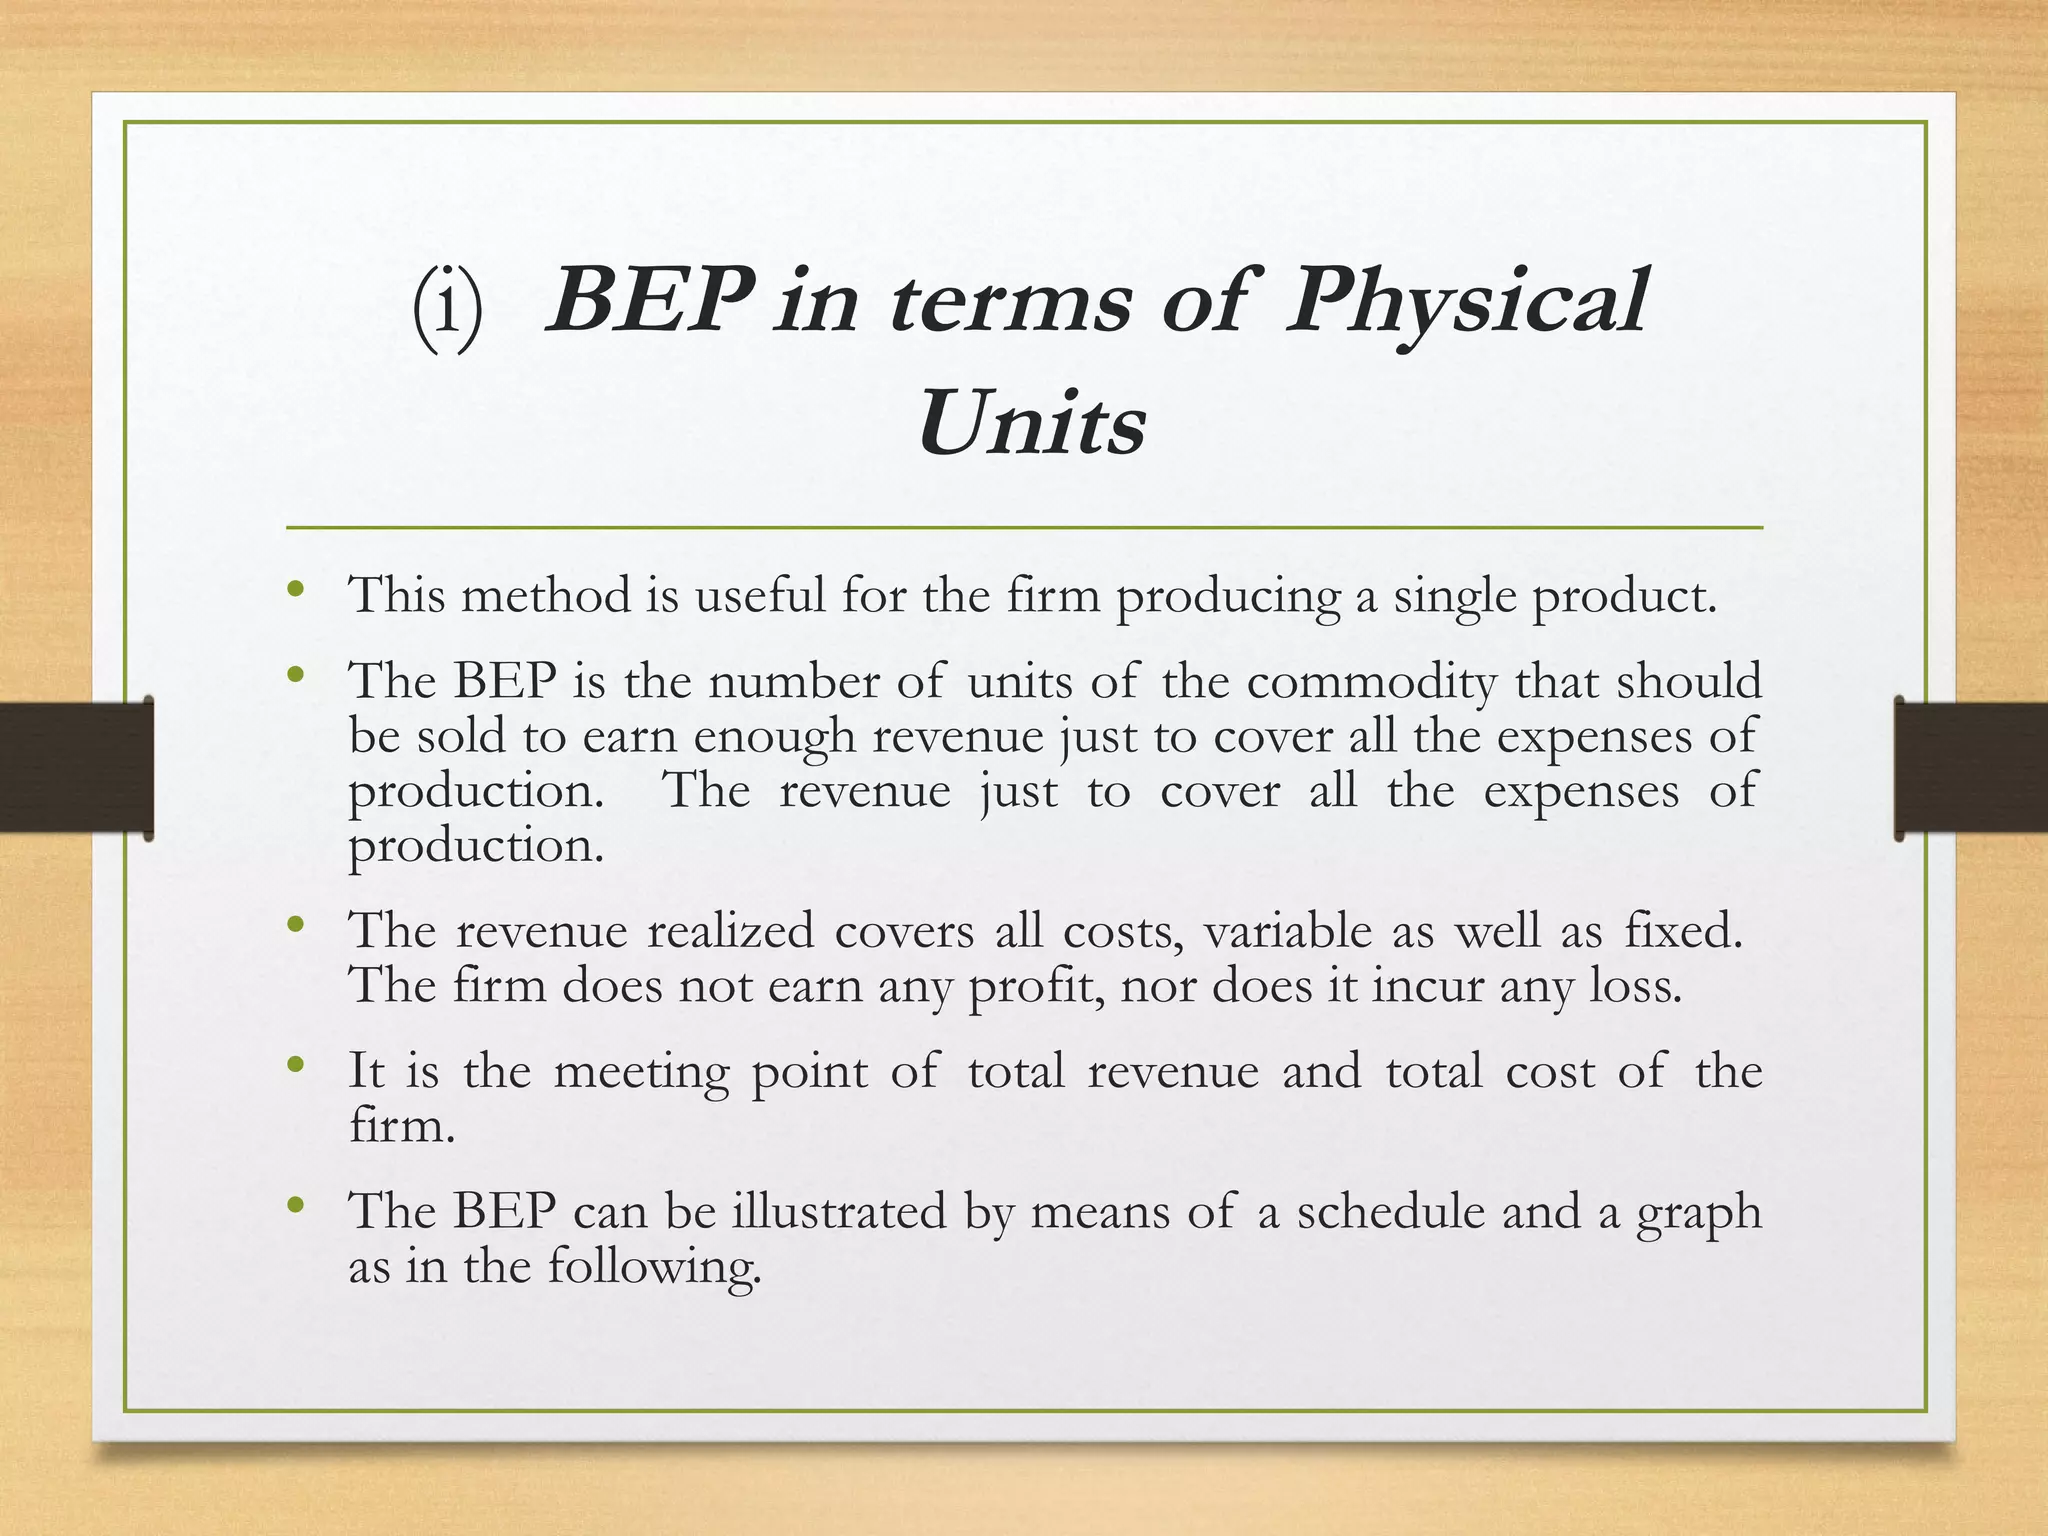


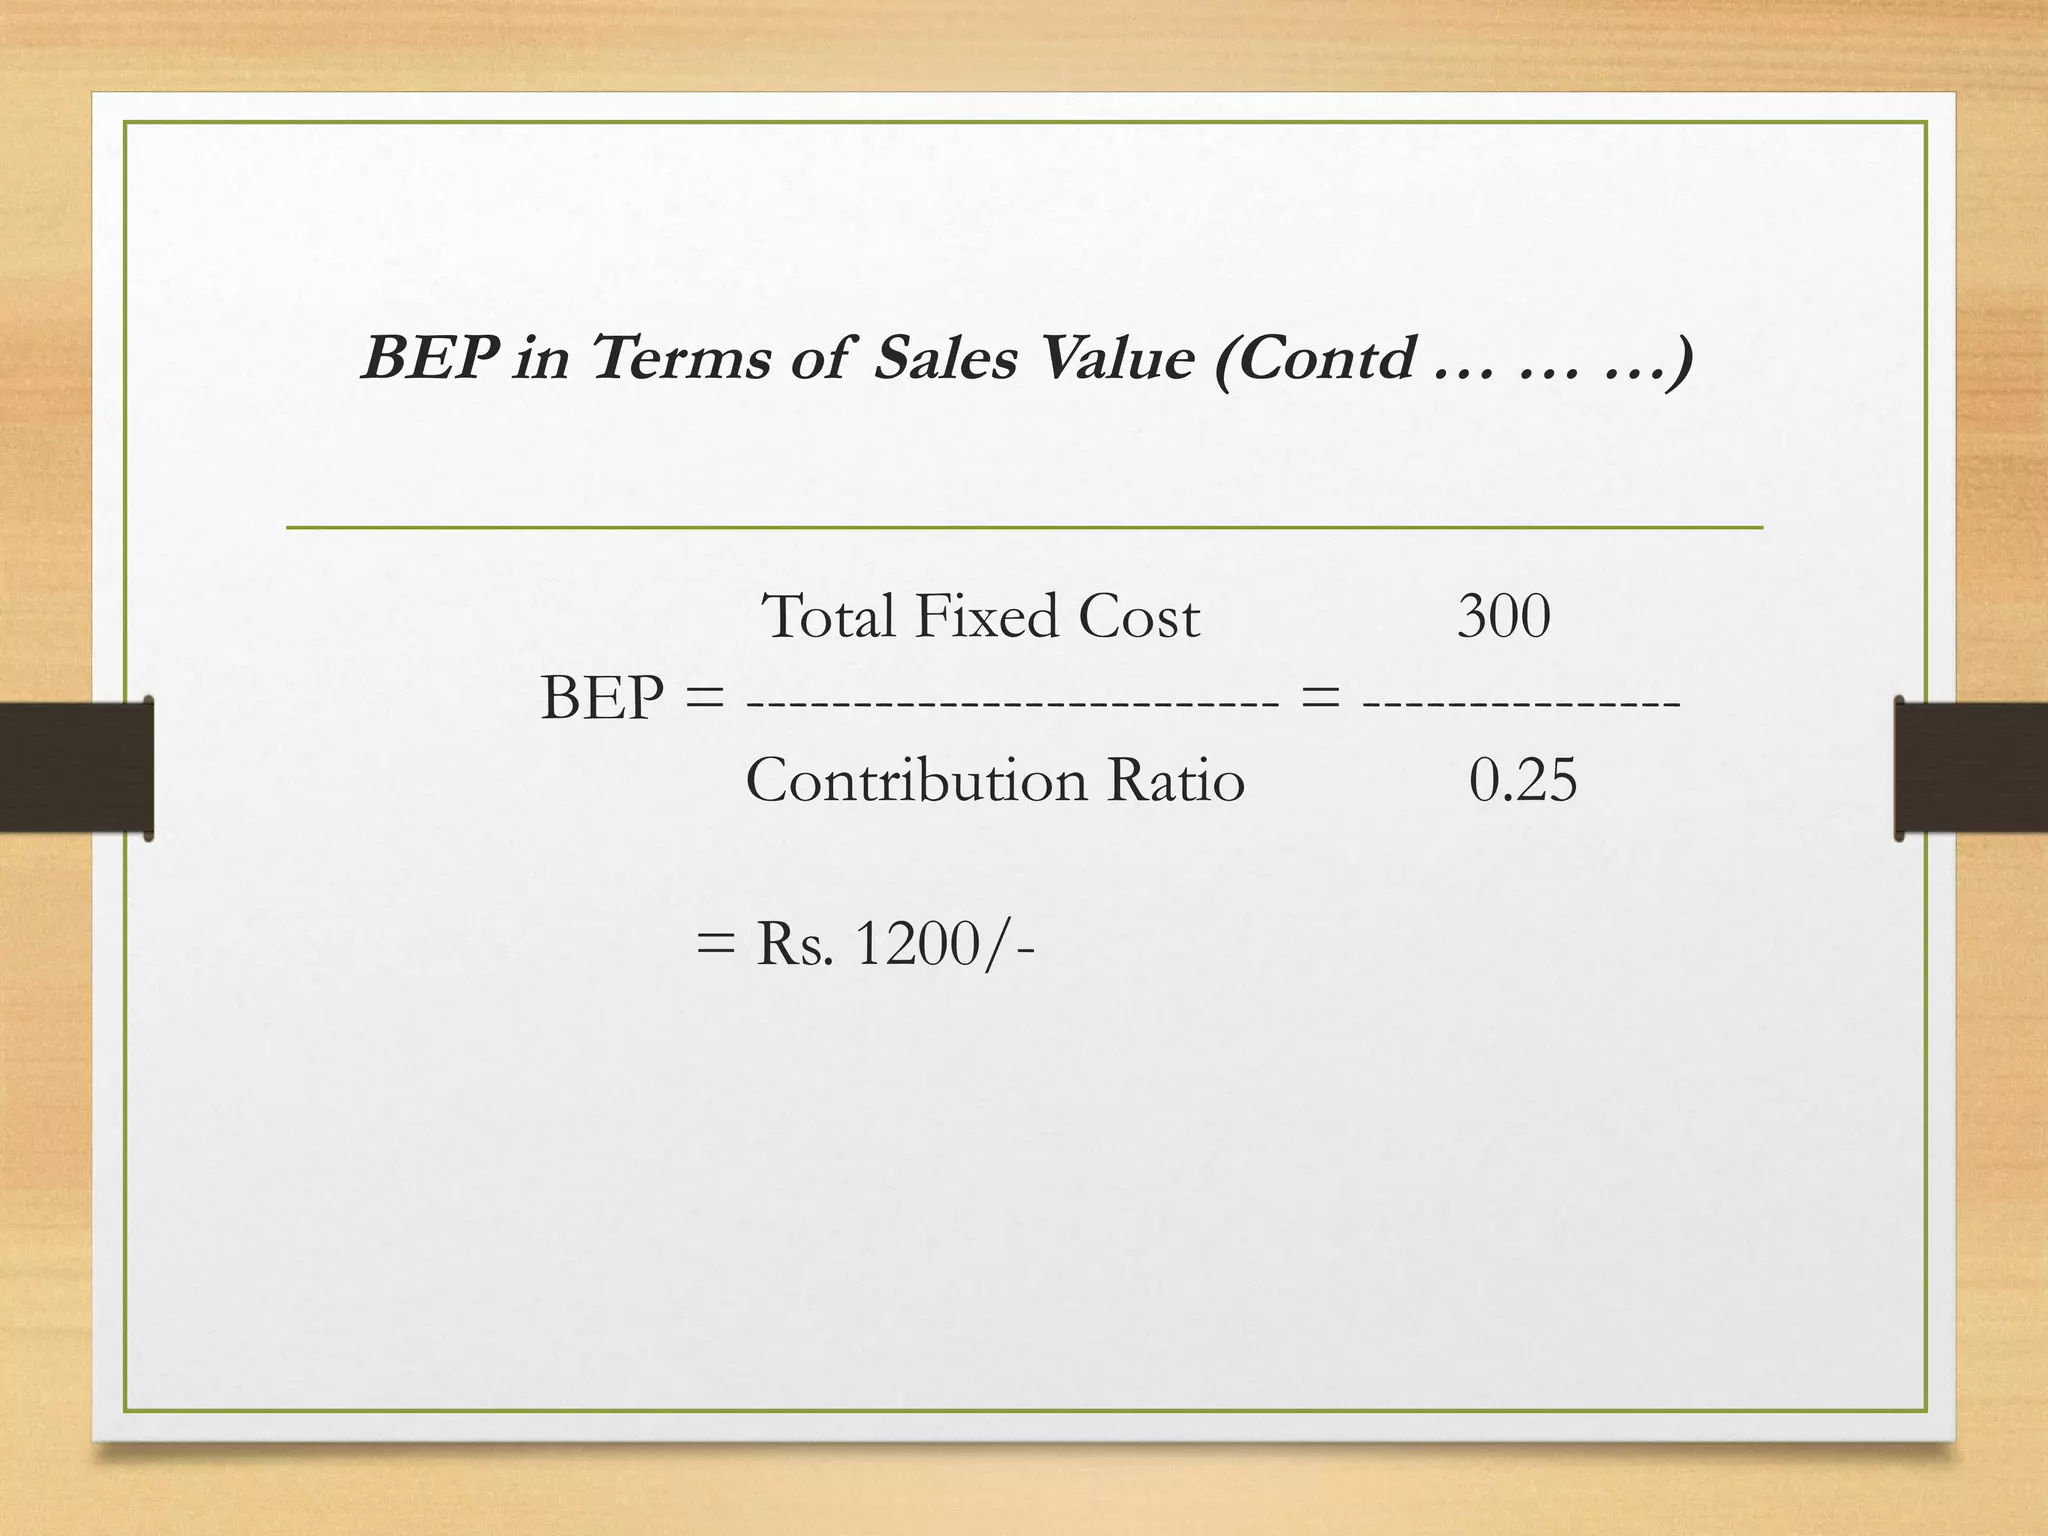
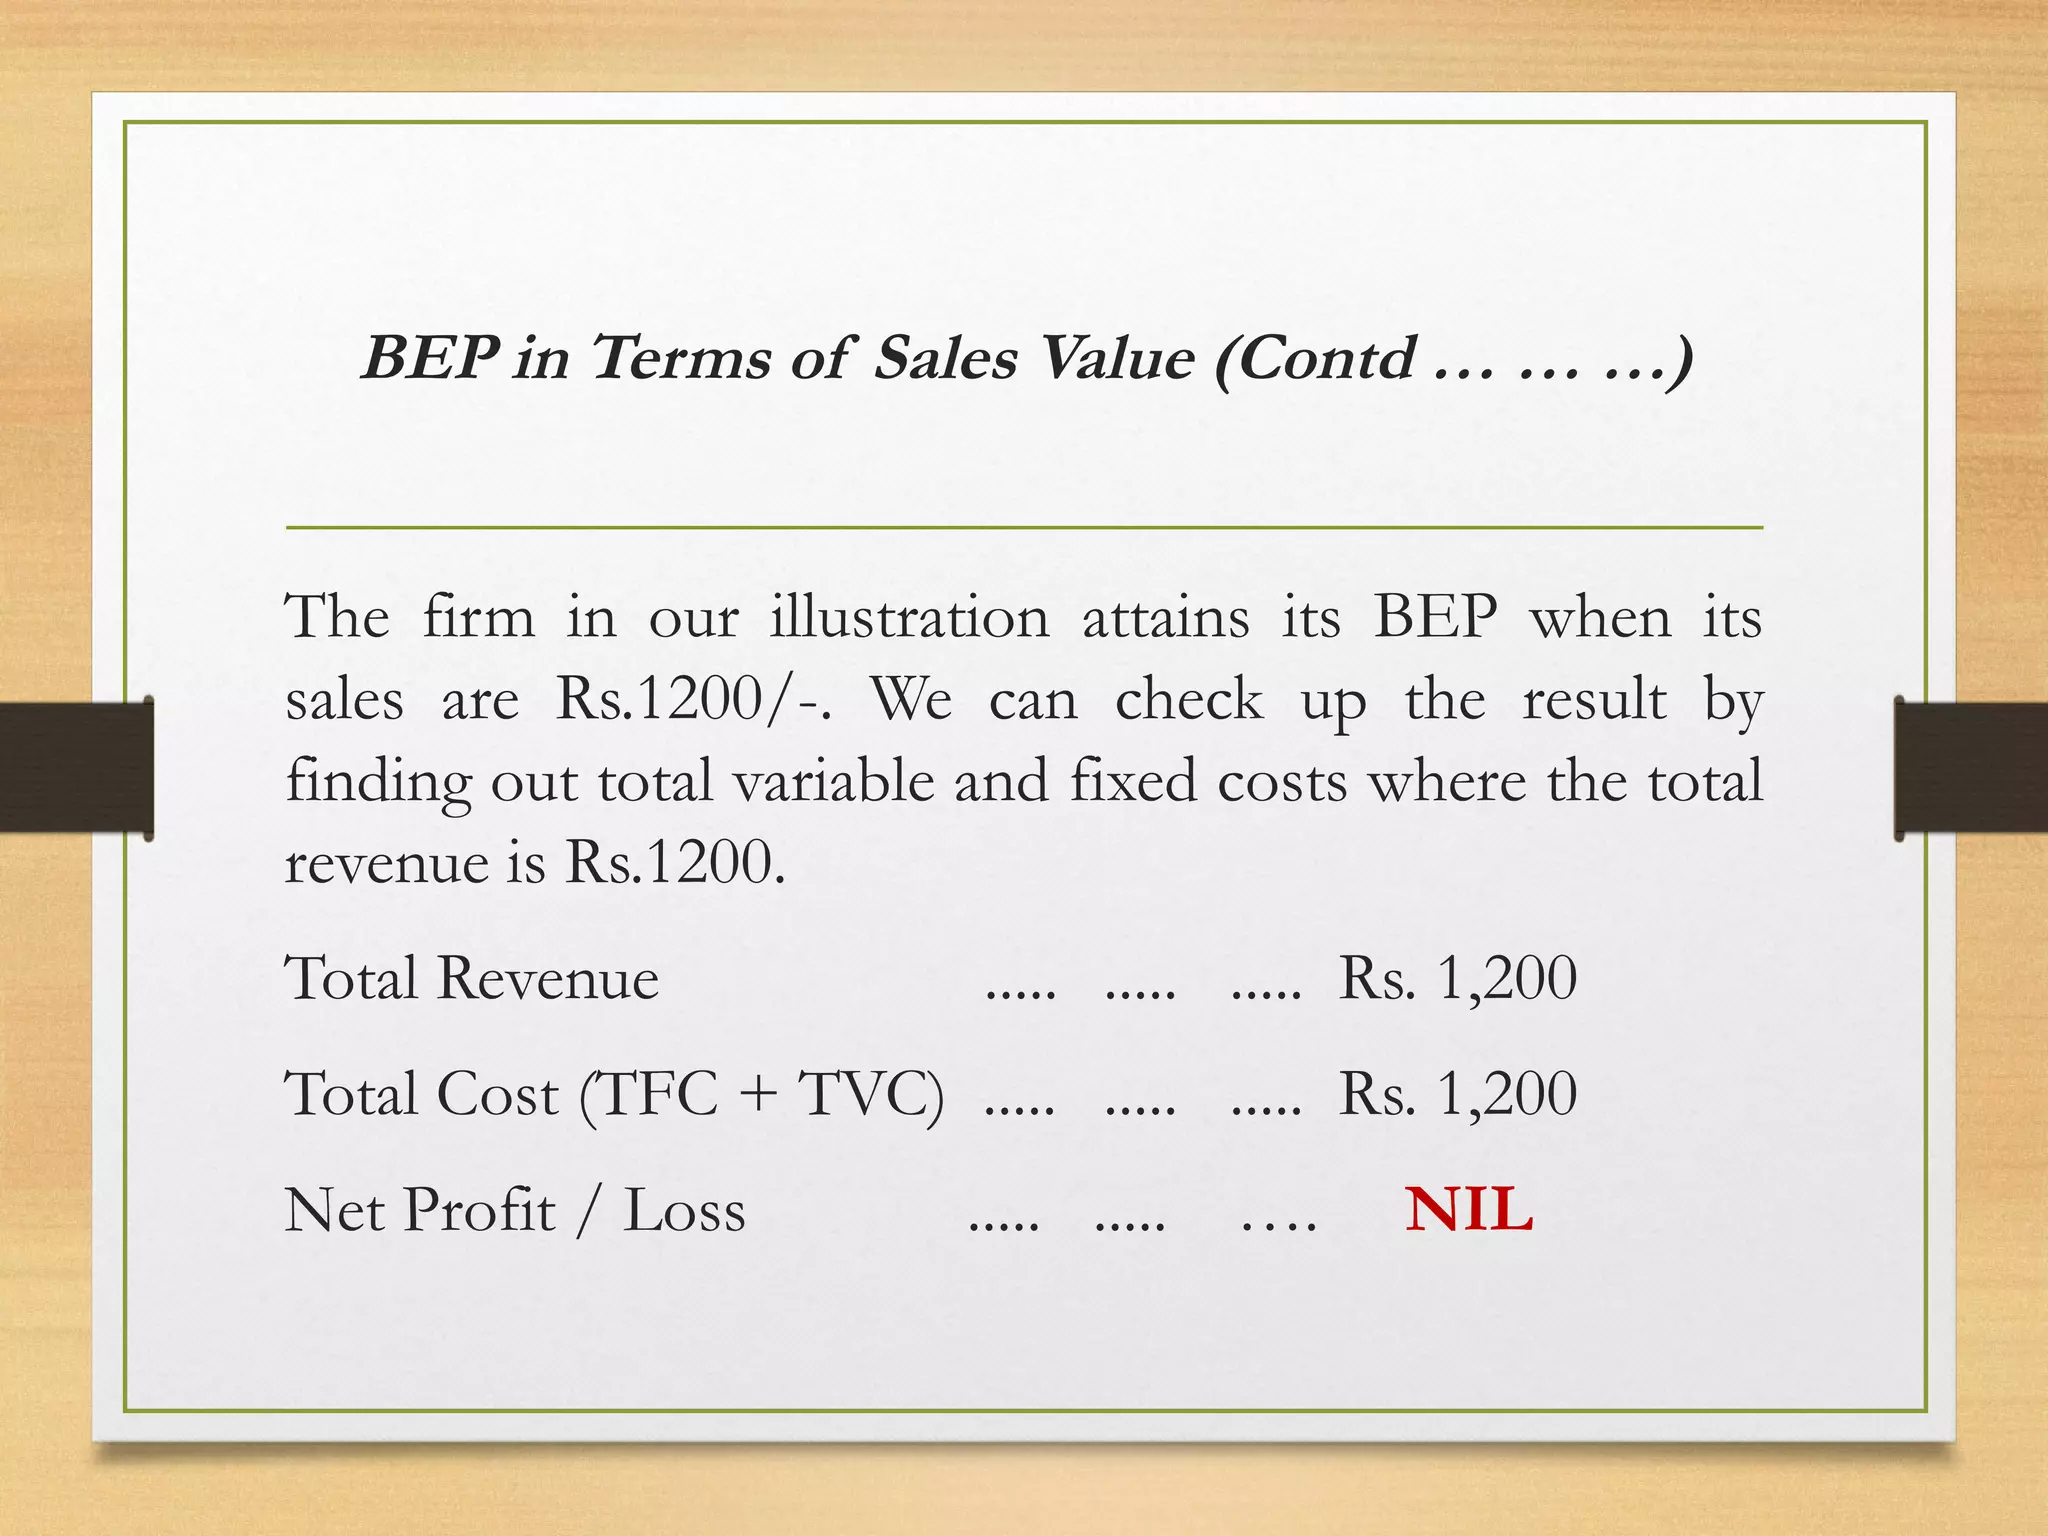

The document explains break-even analysis, a method used to determine the sales volume at which a firm's costs and revenues are equal, resulting in no profit or loss. It discusses two approaches for calculating the break-even point: in terms of physical units and sales value, and explains key concepts such as total revenue, total cost, and contribution margin. The analysis is illustrated with examples and tables, demonstrating how the break-even point can be computed and visualized.