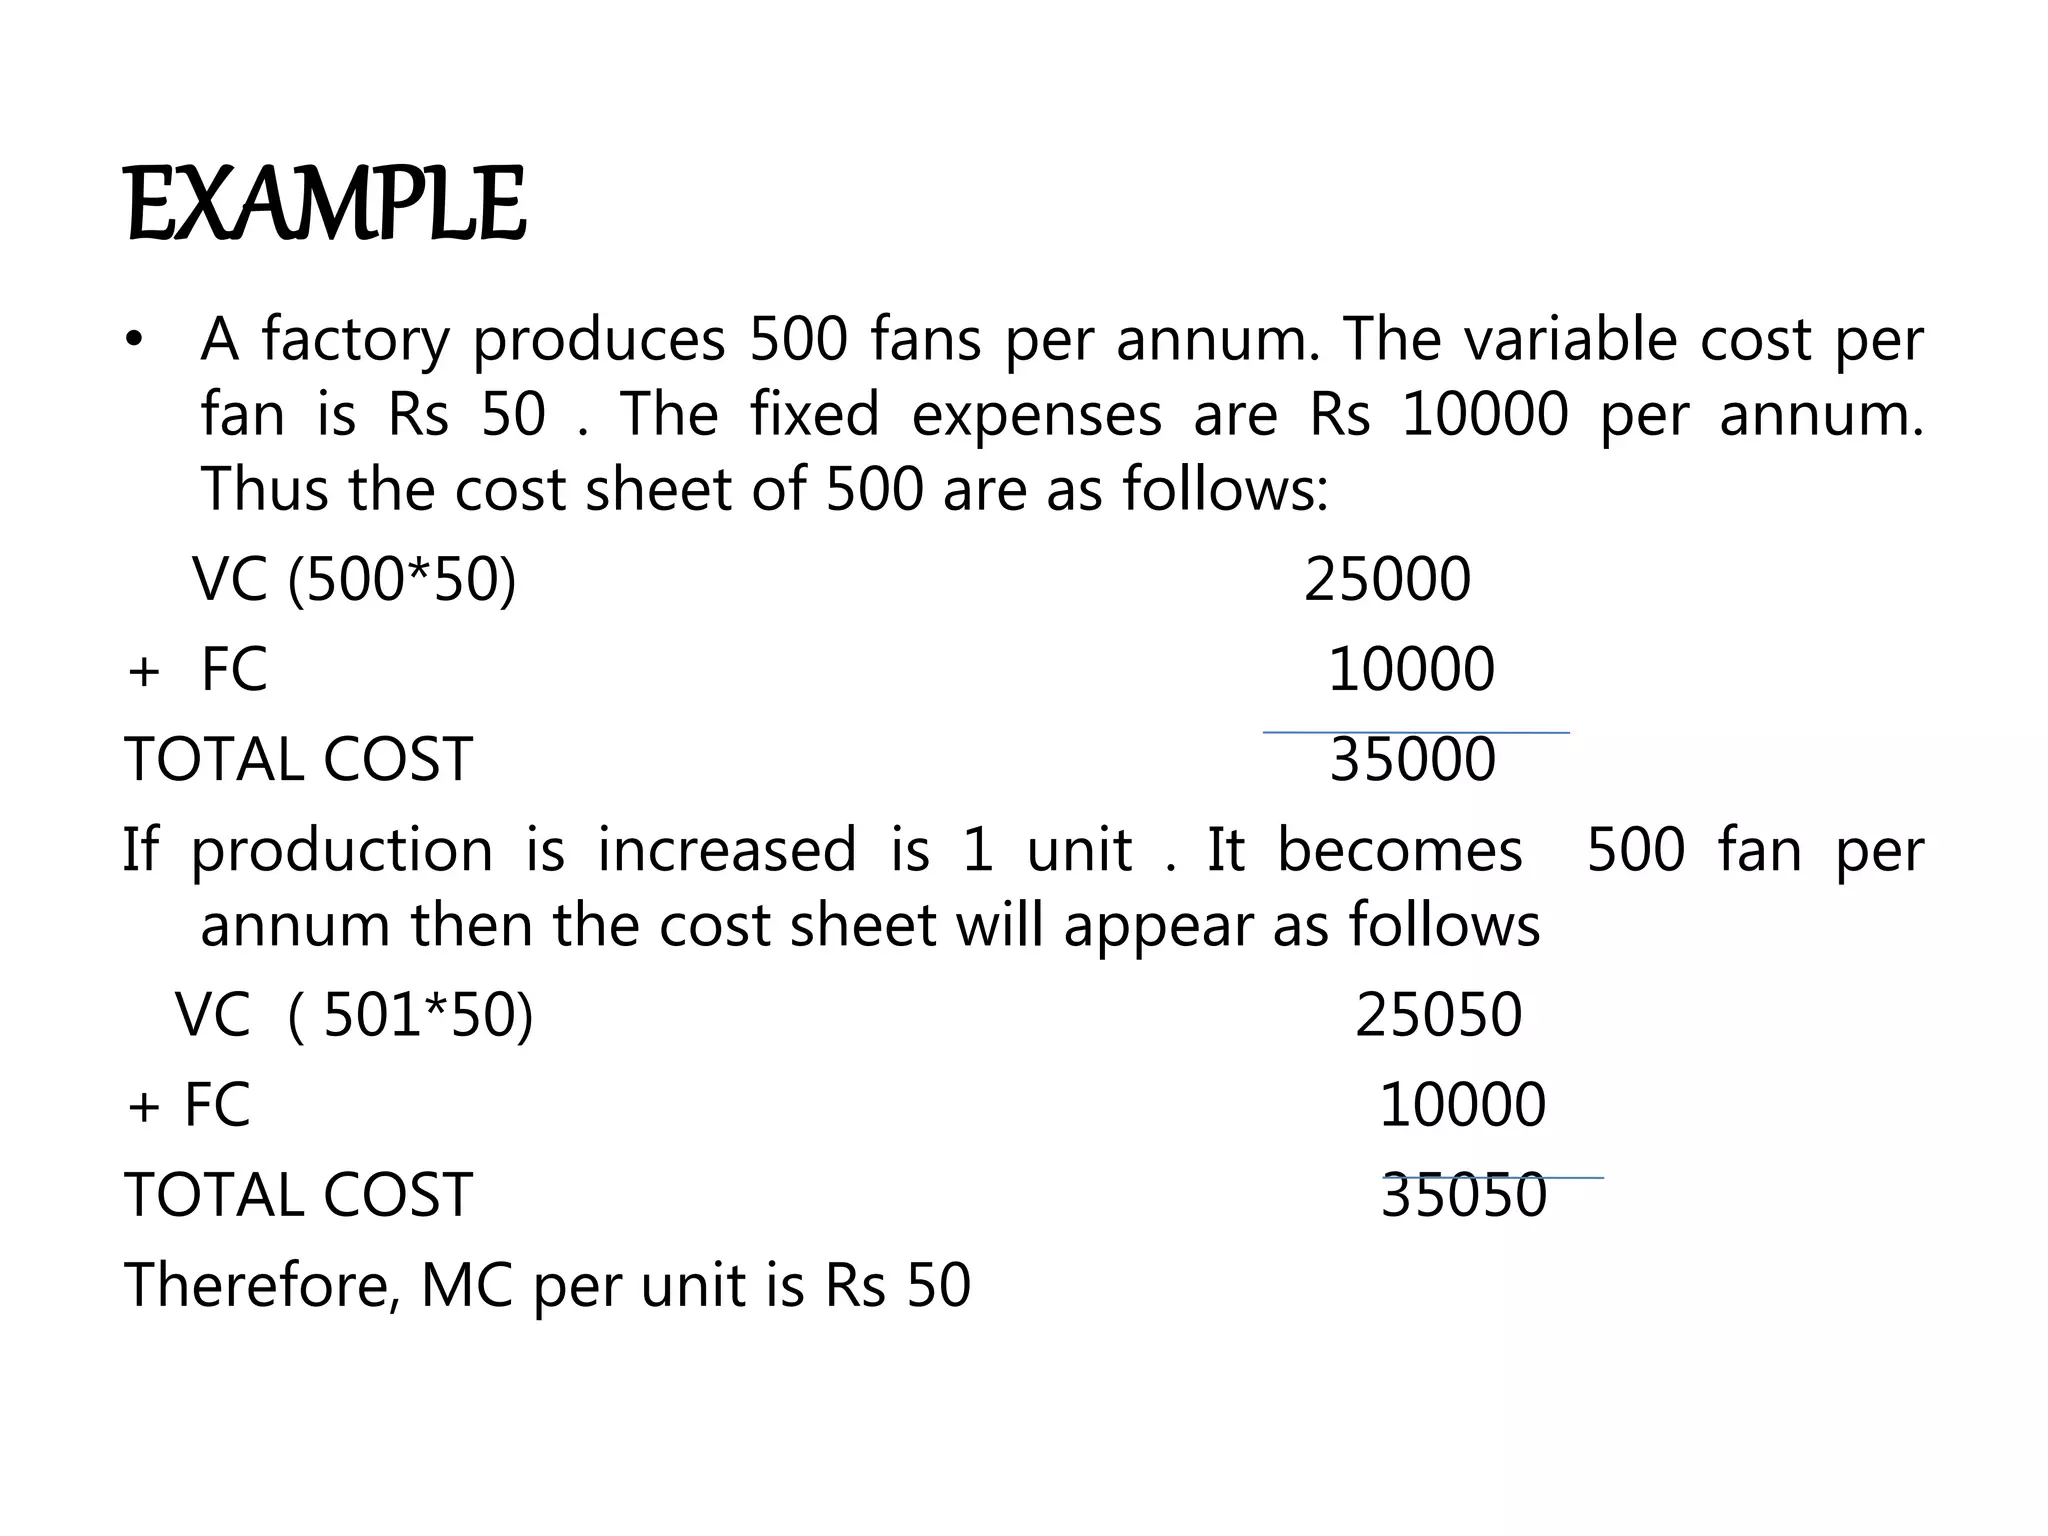
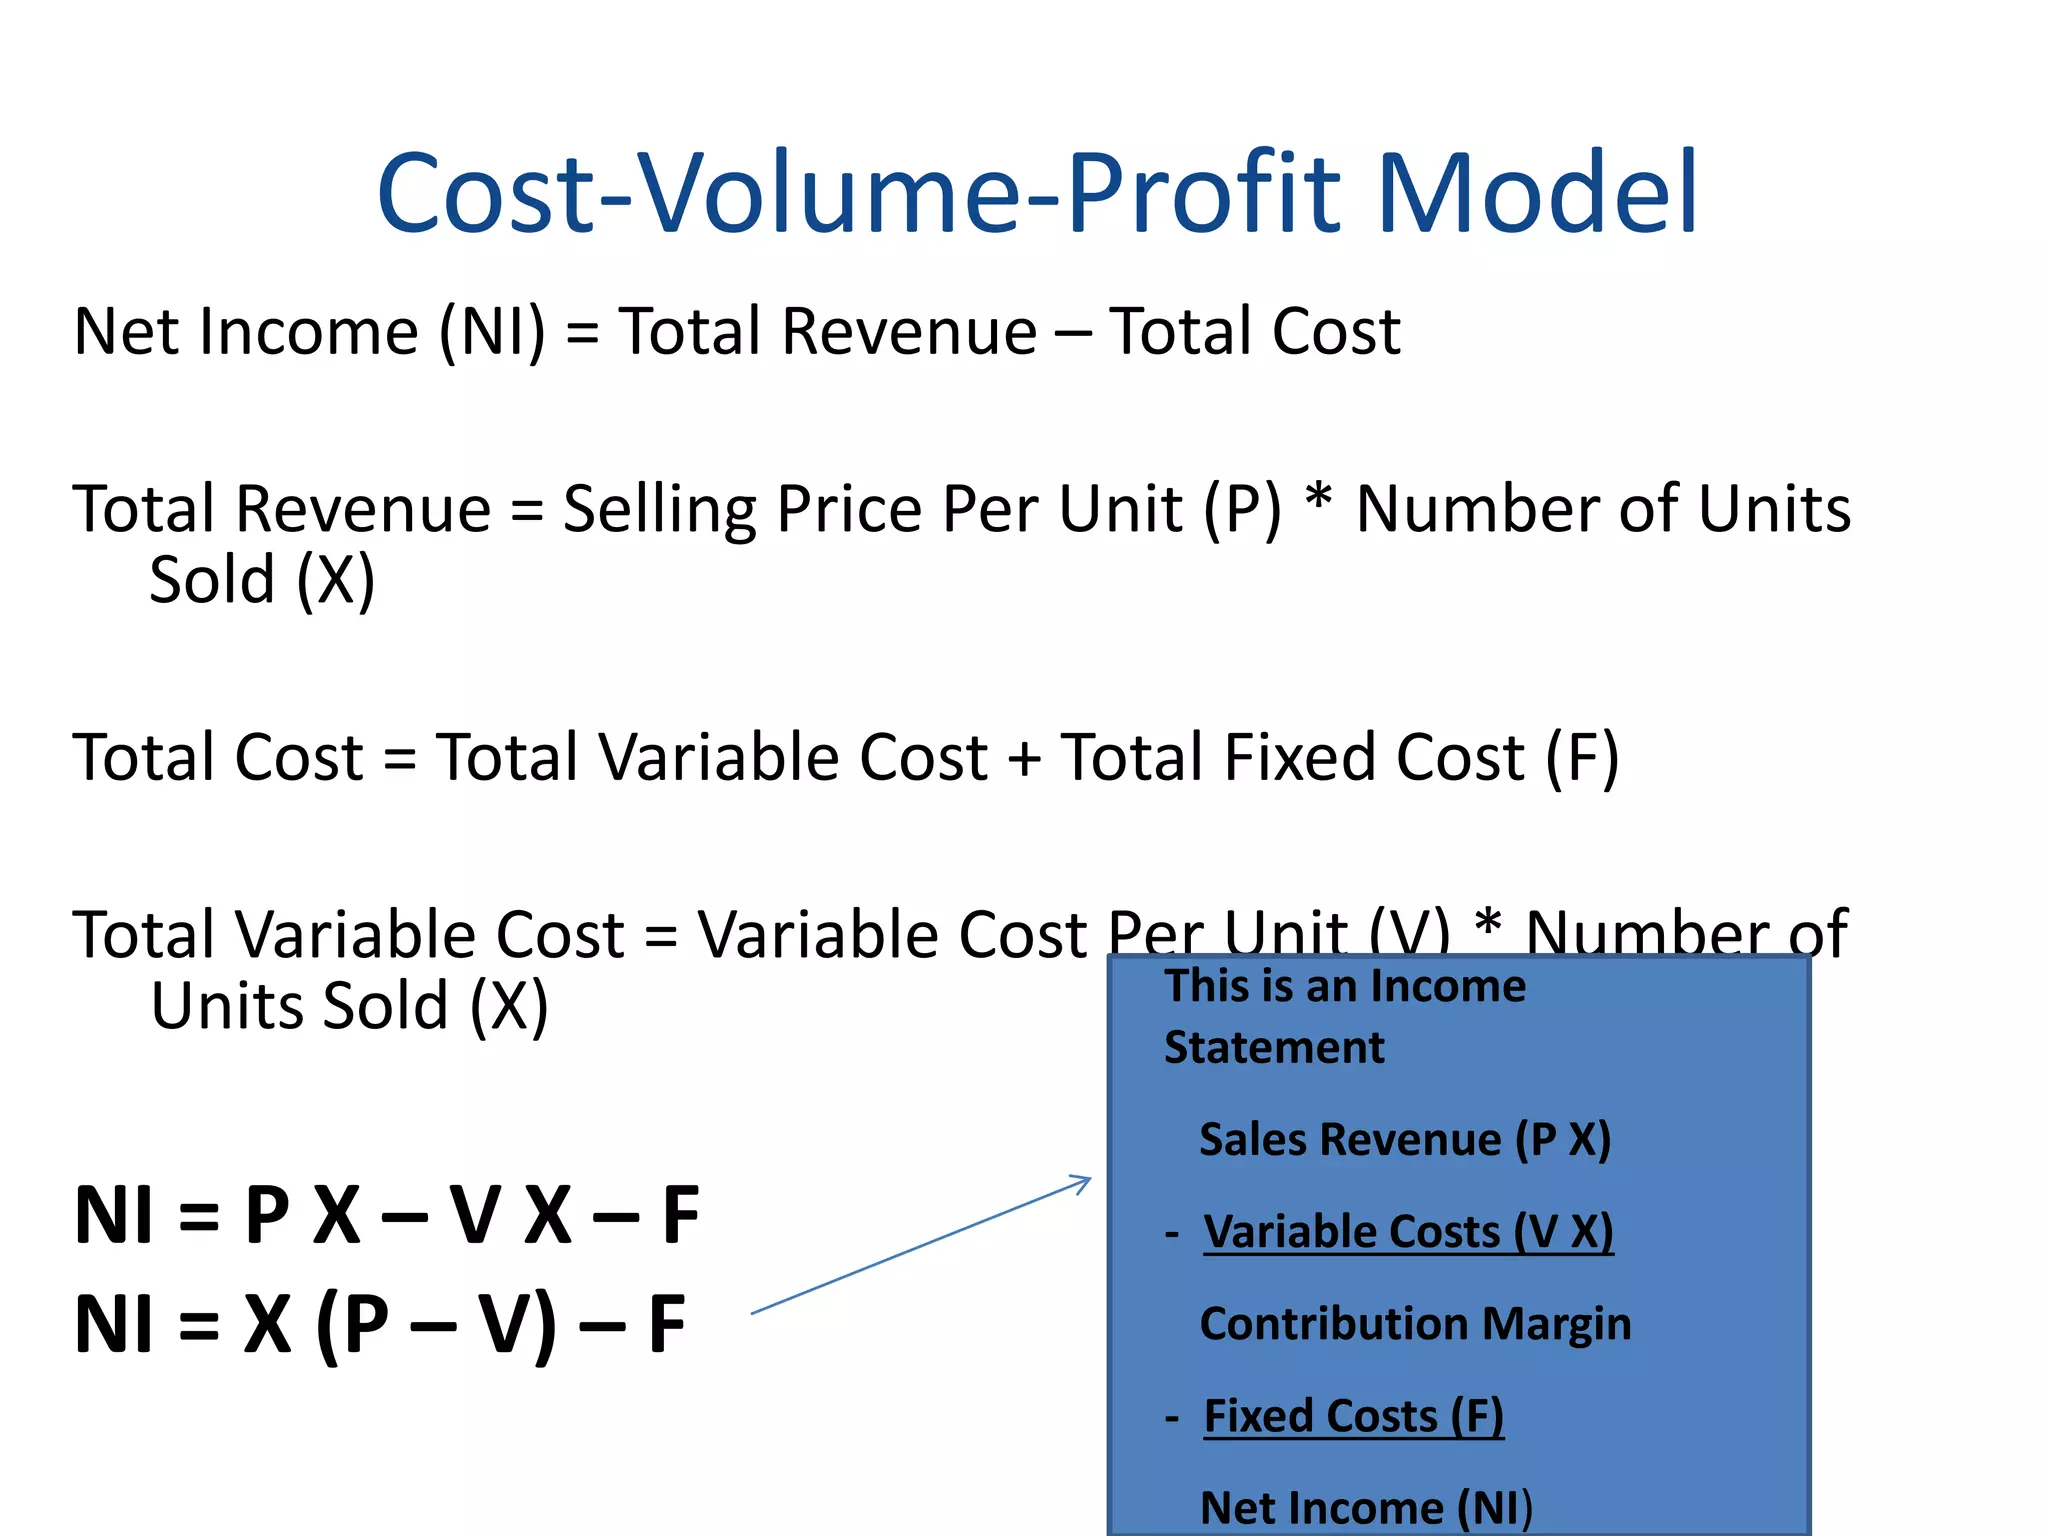
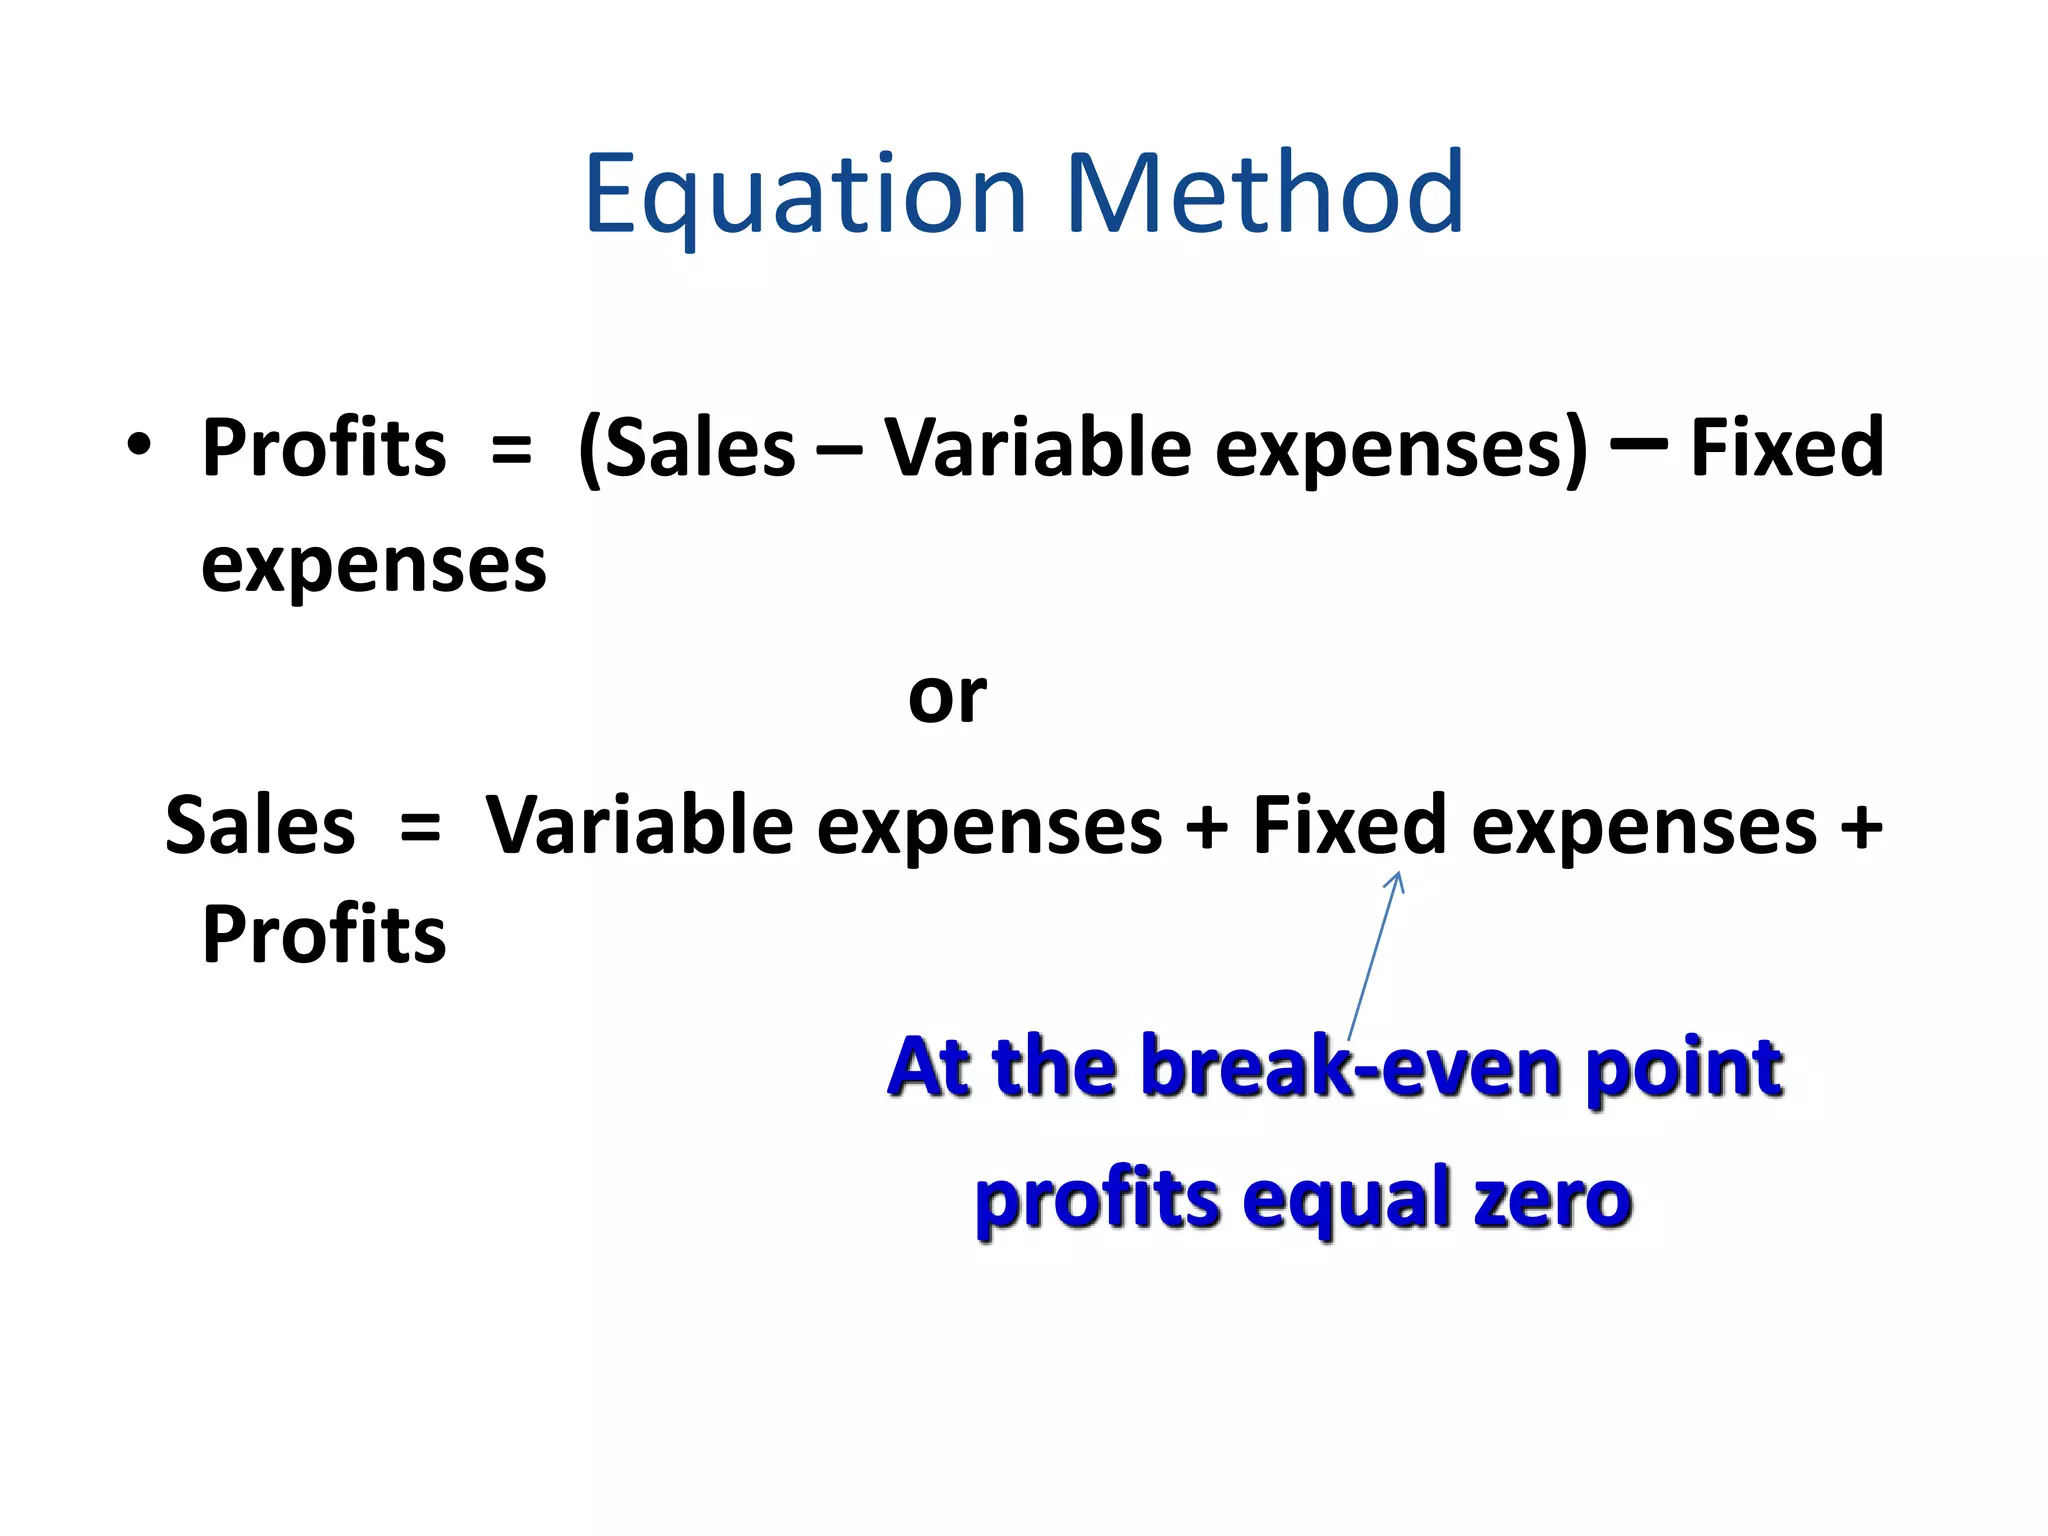
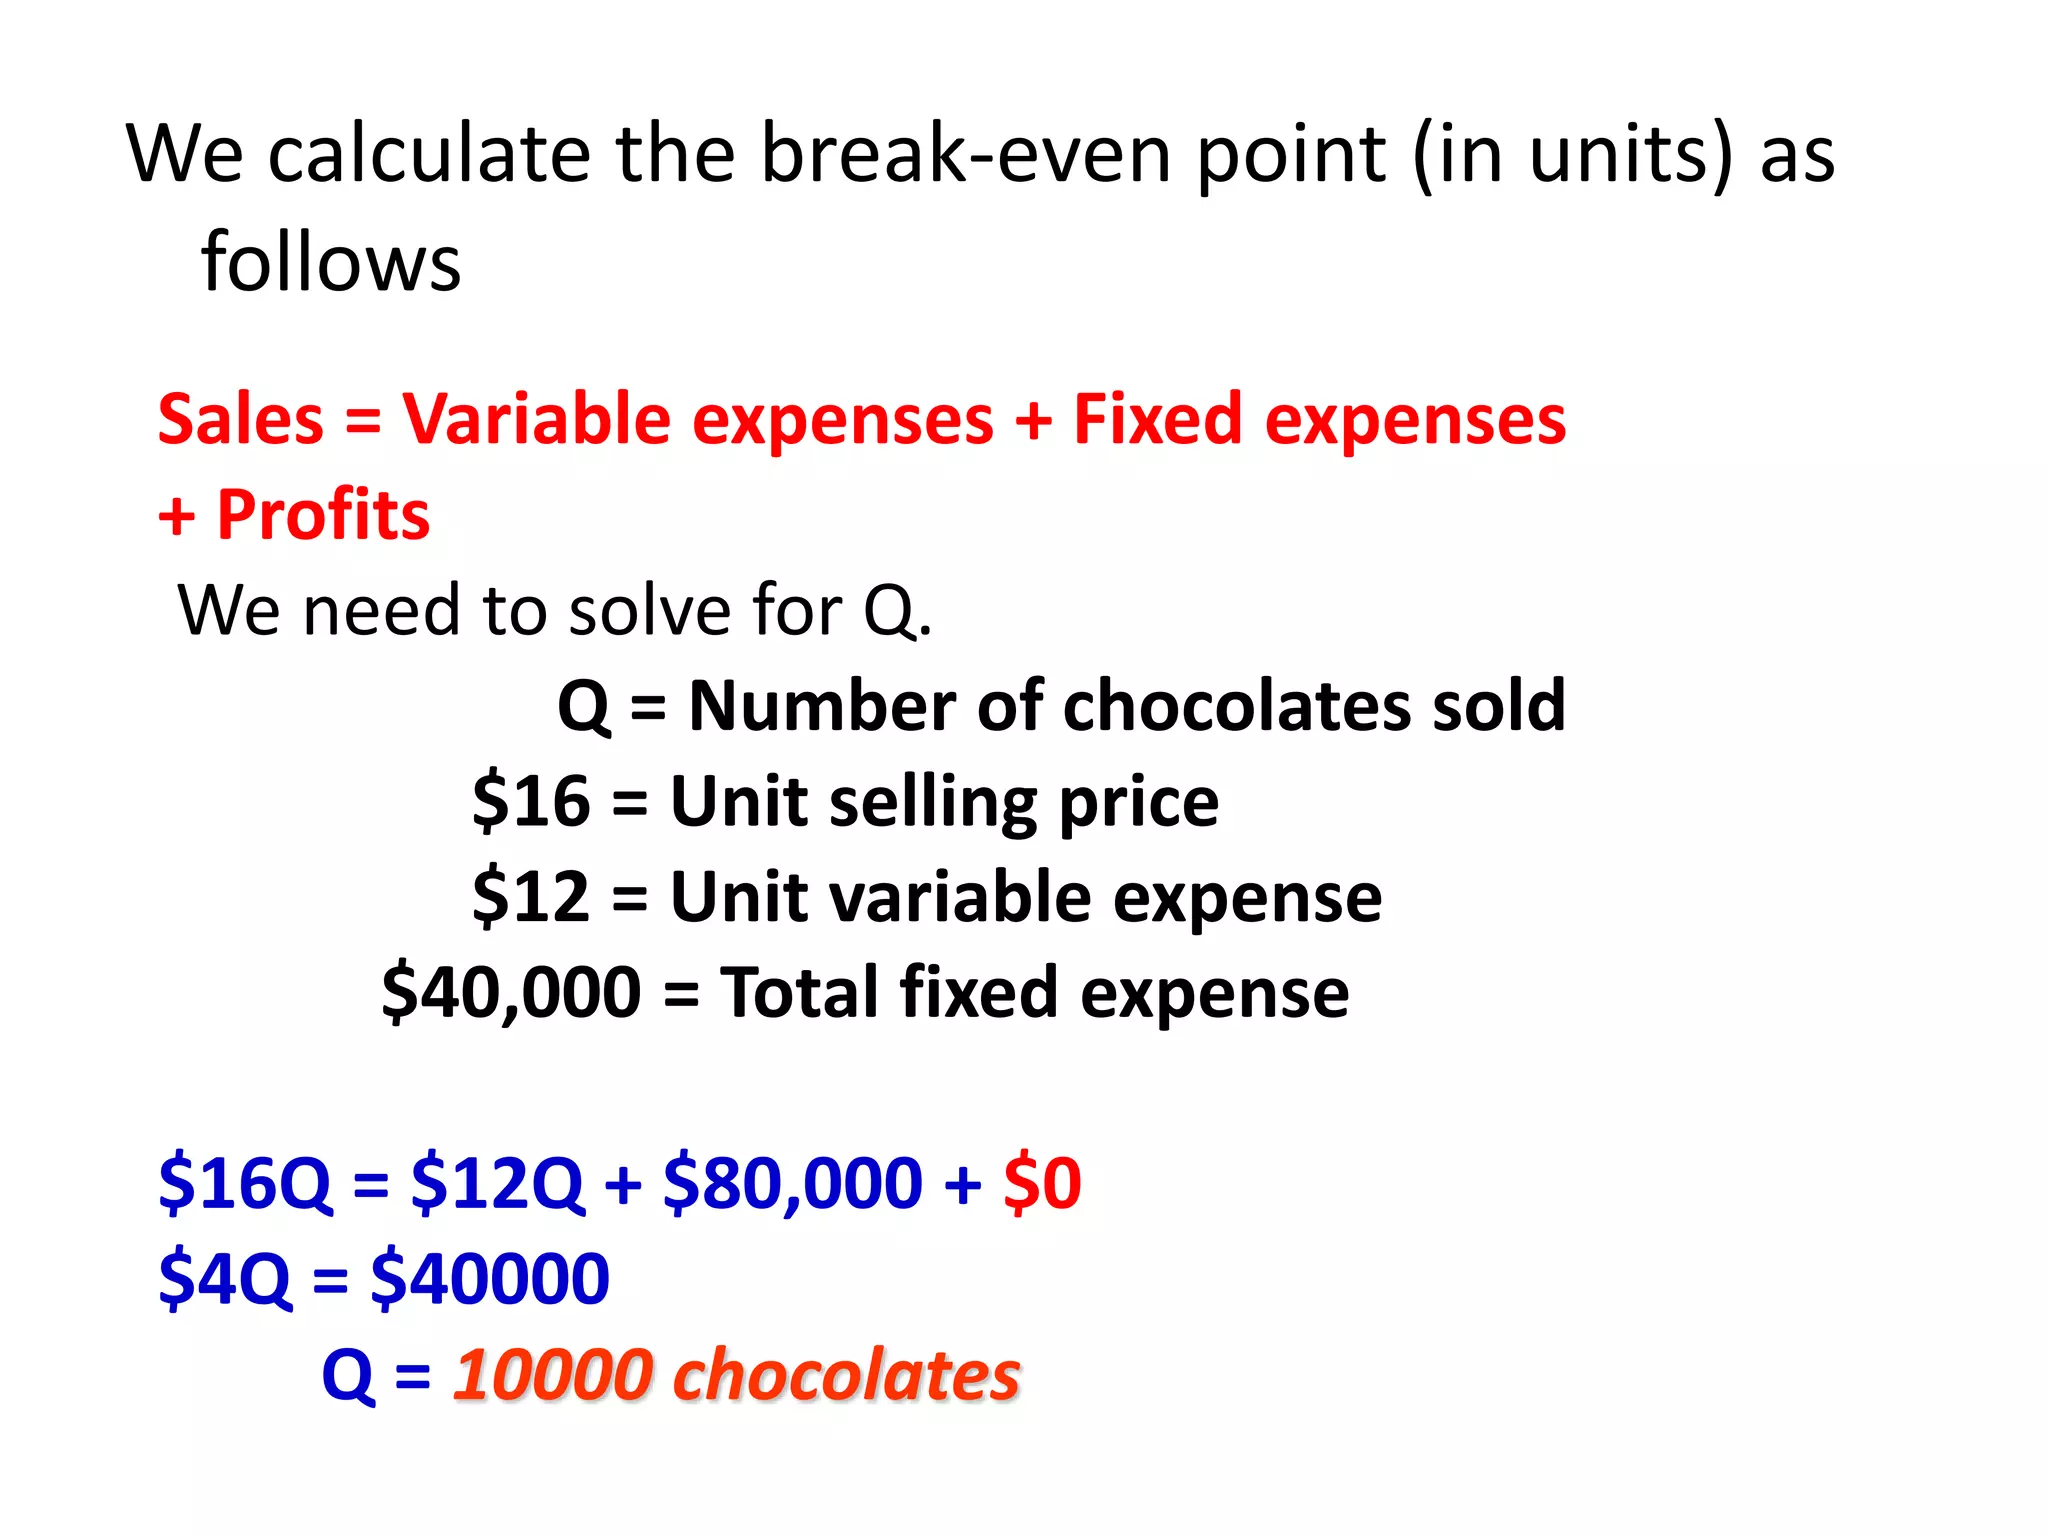
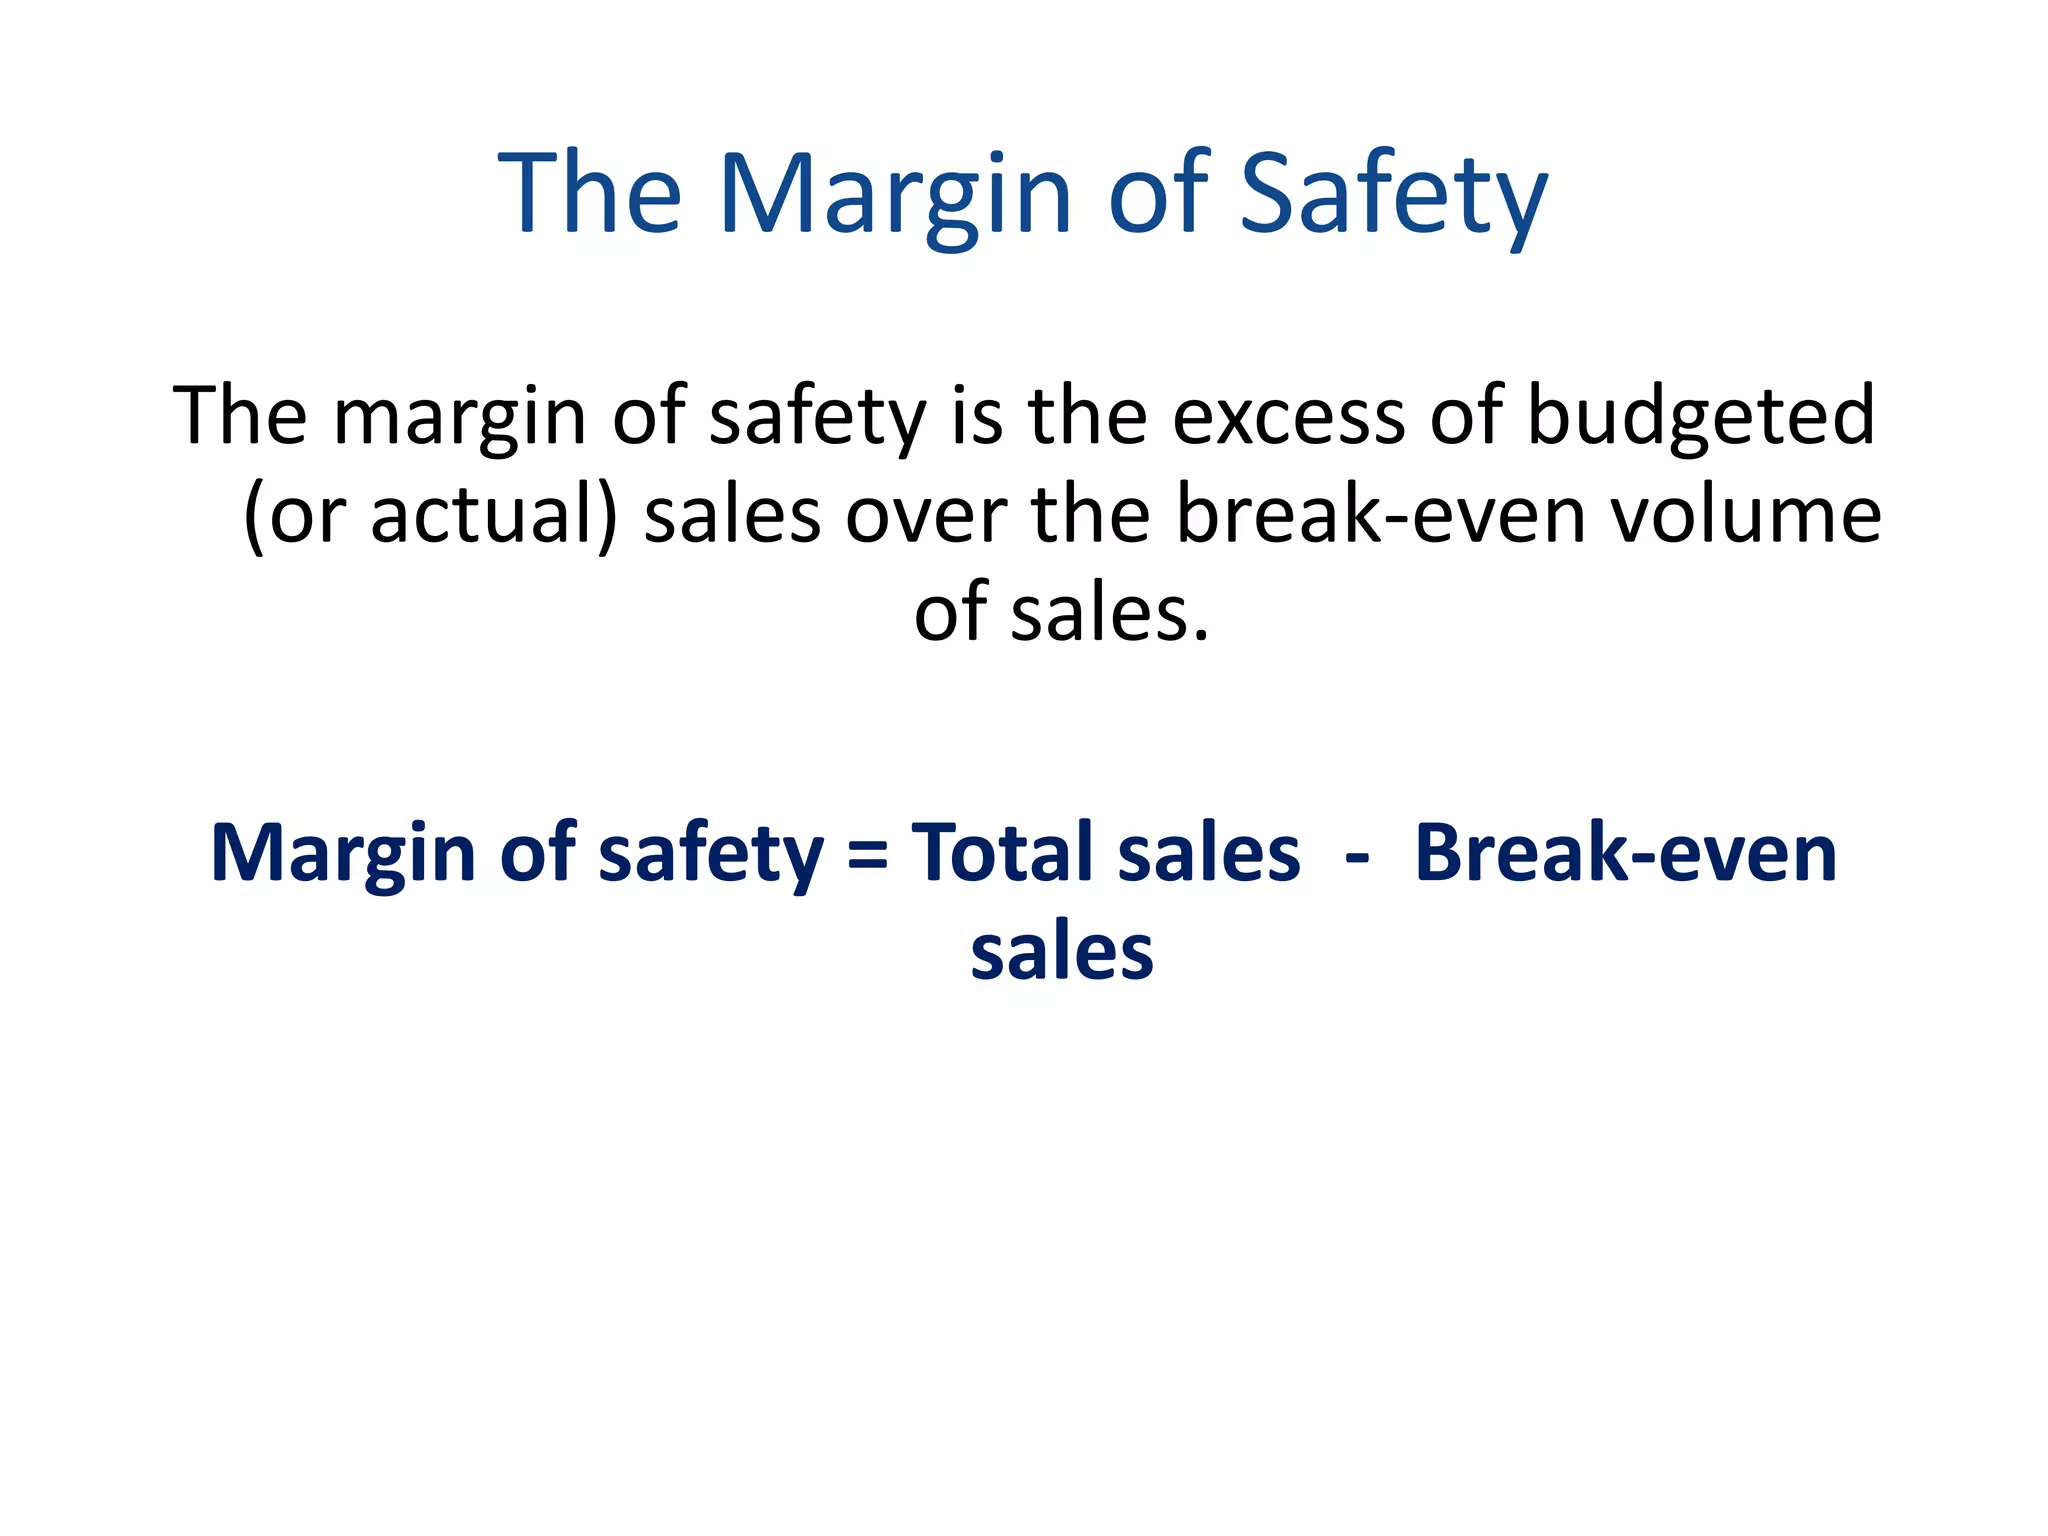
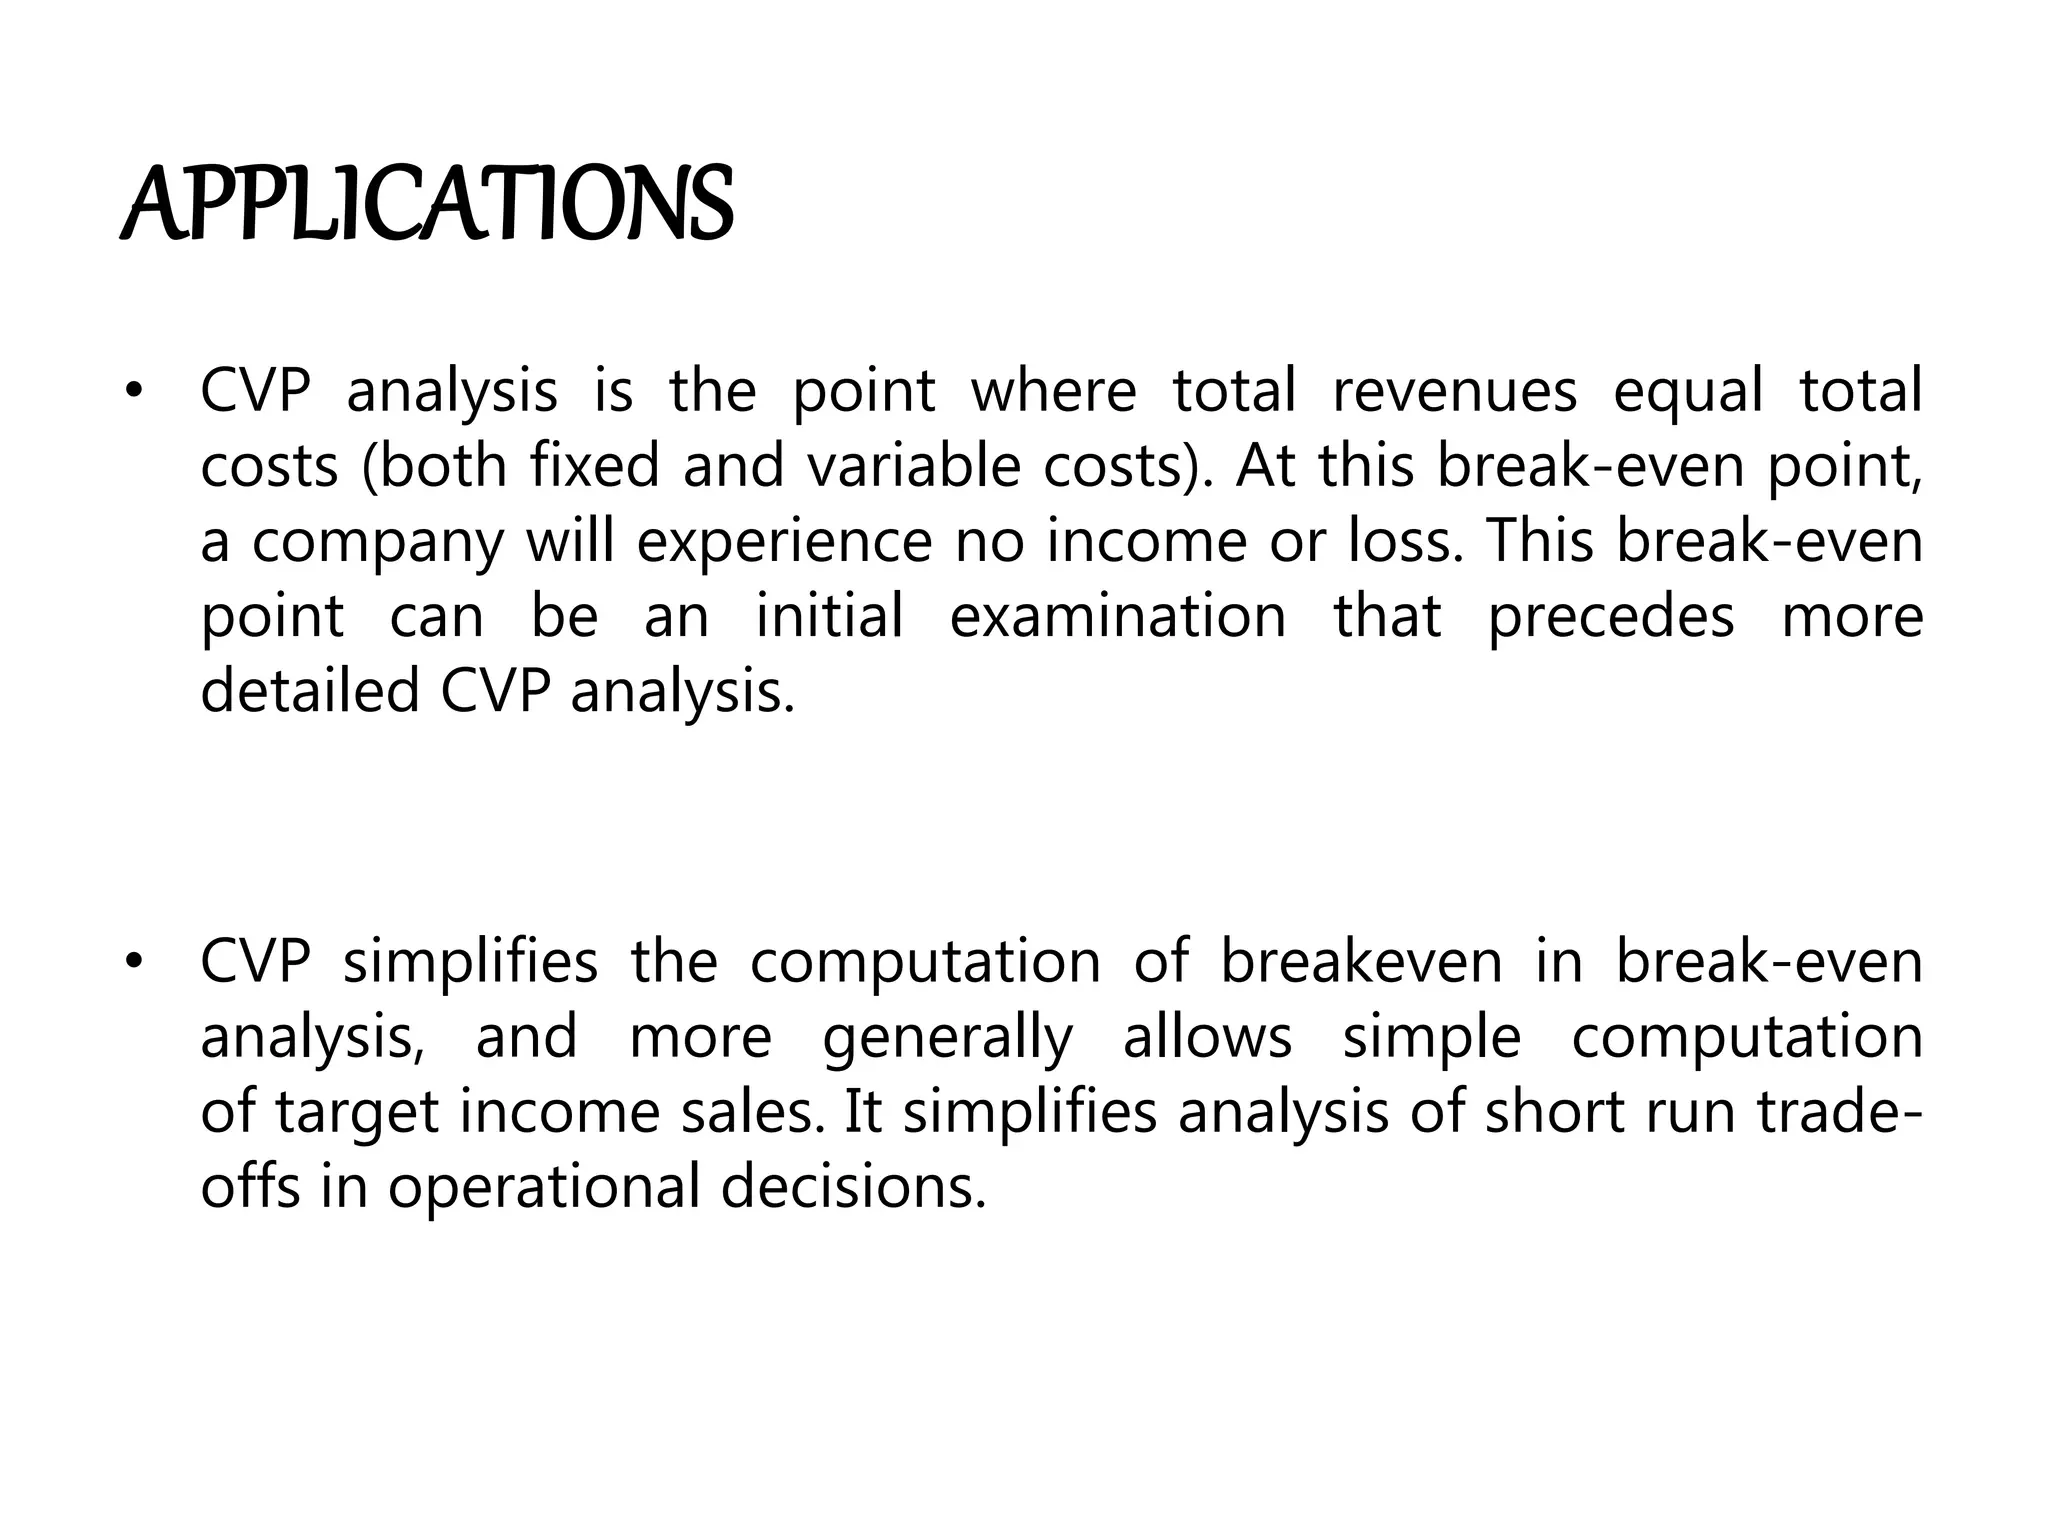
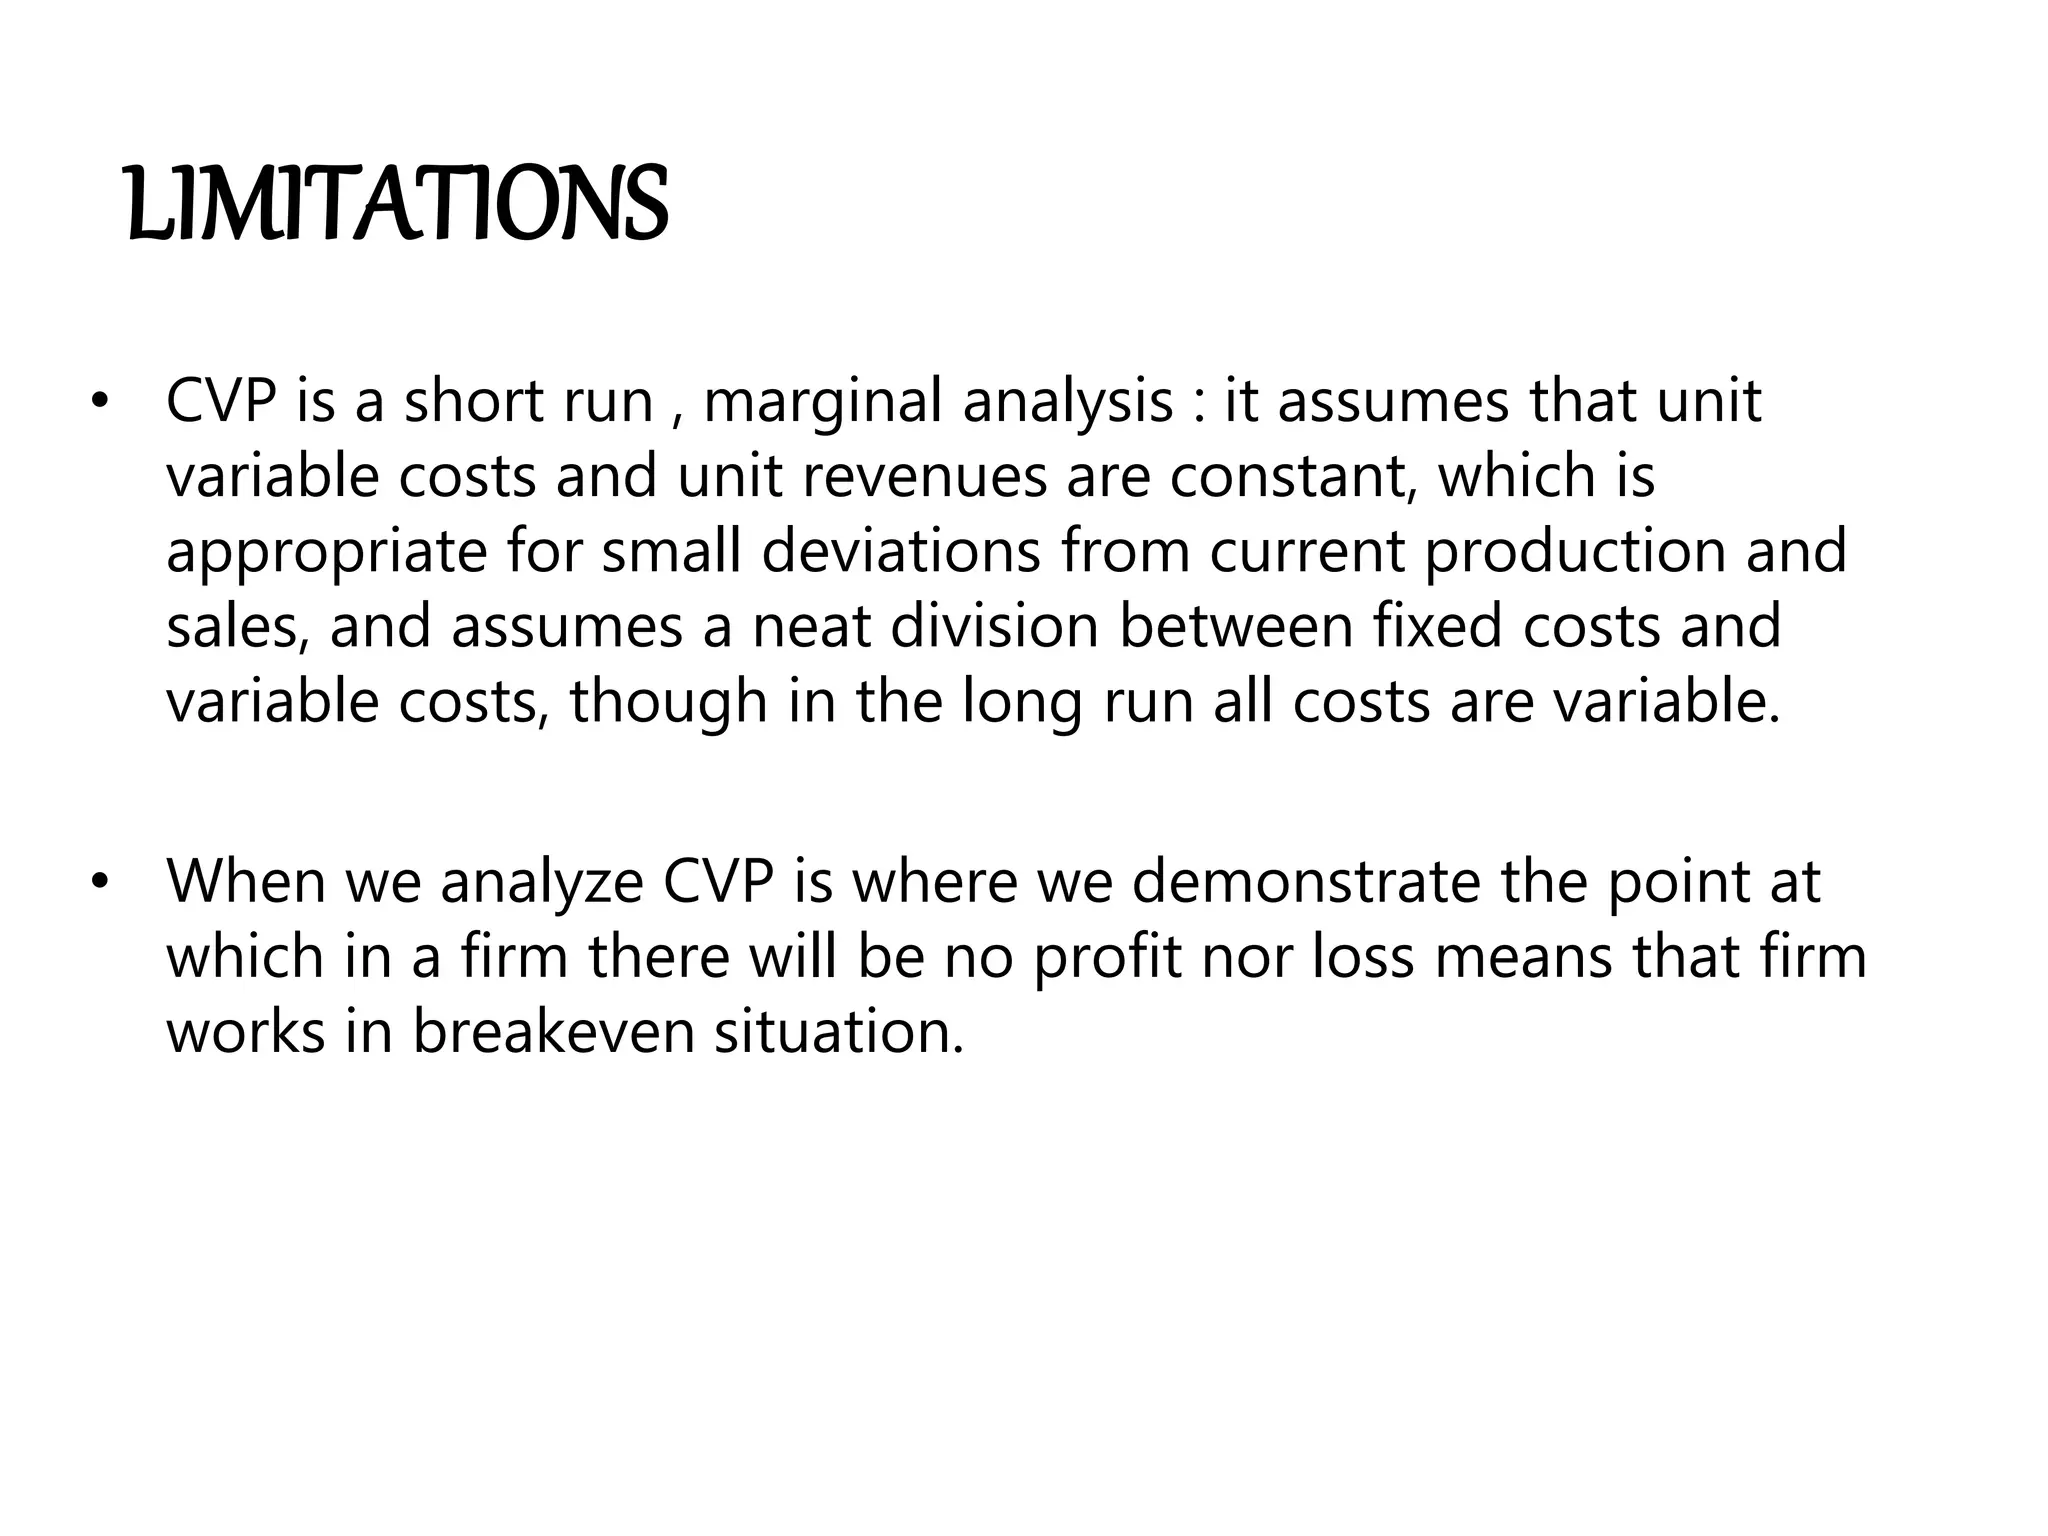
2. MARGINAL COSTING
• Marginal cost is the change in the total cost that arises when
the quantity produced is incremented by one unit, that is, it is
the cost of producing one more unit of a good.
• In general term, marginal cost at each level of production
includes any additional costs required to produce the next level.
Marginal cost = Direct material cost + Direct labor cost + other
variable costs
OR
Total cost – Fixed cost
3. EXAMPLE
• A factory produces 500 fans per annum. The variable cost per
fan is Rs 50 . The fixed expenses are Rs 10000 per annum.
Thus the cost sheet of 500 are as follows:
VC (500*50) 25000
+ FC 10000
TOTAL COST 35000
If production is increased is 1 unit . It becomes 500 fan per
annum then the cost sheet will appear as follows
VC ( 501*50) 25050
+ FC 10000
TOTAL COST 35050
Therefore, MC per unit is Rs 50
4. Contribution Margin
• The contribution margin represents the amount of income or
profit the company made before deducting its fixed costs
Contribution margin = Sales revenue - All variable costs
BREAK EVEN POINT
• Breakeven is where total sales revenue for a period just covers
fixed costs, leaving neither profit nor loss. For every unit sold
in excess of the breakeven point, profit will increase by the
amount of the contribution per unit.
5. COST–VOLUME – PROFIT ANALYSIS
• Cost-volume-profit (CVP) analysis is used to determine how
changes in costs and volume affect a company's operating
income and net income.
• CVP analysis requires that all the company's costs, including
manufacturing, selling, and administrative costs, be identified
as variable or fixed.
6. Cost-Volume-Profit Model
Net Income (NI) = Total Revenue – Total Cost
Total Revenue = Selling Price Per Unit (P) * Number of Units
Sold (X)
Total Cost = Total Variable Cost + Total Fixed Cost (F)
Total Variable Cost = Variable Cost Per Unit (V) * Number of
Units Sold (X)
NI = P X – V X – F
NI = X (P – V) – F
This is an Income
Statement
Sales Revenue (P X)
- Variable Costs (V X)
Contribution Margin
- Fixed Costs (F)
Net Income (NI)
8. Equation Method
• Profits = (Sales – Variable expenses) – Fixed
expenses
or
Sales = Variable expenses + Fixed expenses +
Profits
At the break-even point
profits equal zero
9. We calculate the break-even point (in units) as
follows
Sales = Variable expenses + Fixed expenses
+ Profits
We need to solve for Q.
Q = Number of chocolates sold
$16 = Unit selling price
$12 = Unit variable expense
$40,000 = Total fixed expense
$16Q = $12Q + $80,000 + $0
$4Q = $40000
Q = 10000 chocolates
10. Calculate the break-even point in sales dollar
Sales = Variable expenses + Fixed expenses +
Profits
X = 0.75X + $40,000 + $0
0.25X = $40,000
X = $40,000 ÷ 0.25
X = $160,000
l = Variable expenses + Fixed expenses + Profits
11. Contribution Margin Method
• The contribution margin method has two key
equations
Break-even point in
units sold
14. The Margin of Safety
The margin of safety is the excess of budgeted
(or actual) sales over the break-even volume
of sales.
Margin of safety = Total sales - Break-even
sales
15. ASSUMPTIONS
CVP assumes the following:
• Constant sales price.
• Constant variable cost per unit.
• Constant total fixed cost.
• Constant sales mix.
• Units sold equal units produced.
16. APPLICATIONS
• CVP analysis is the point where total revenues equal total
costs (both fixed and variable costs). At this break-even point,
a company will experience no income or loss. This break-even
point can be an initial examination that precedes more
detailed CVP analysis.
• CVP simplifies the computation of breakeven in break-even
analysis, and more generally allows simple computation
of target income sales. It simplifies analysis of short run trade-
offs in operational decisions.
17. OBJECTIVE
• It is essential to ascertain the relationship between cost and
profit on one hand and volume on the other.
• Helpful in setting up flexible budget which indicates cost at
various levels of activities.
• Assist in evaluating performance for the purpose of control.
• Formulate pricing policies by projecting the effect of different
price structures on cost and profit.
18. LIMITATIONS
• CVP is a short run , marginal analysis : it assumes that unit
variable costs and unit revenues are constant, which is
appropriate for small deviations from current production and
sales, and assumes a neat division between fixed costs and
variable costs, though in the long run all costs are variable.
• When we analyze CVP is where we demonstrate the point at
which in a firm there will be no profit nor loss means that firm
works in breakeven situation.