Downloaded 49 times

![2
Therefore, p (115 ≤ 𝑋̅ ≤ 125) = p[
(115 − 120)
15
√50
⁄
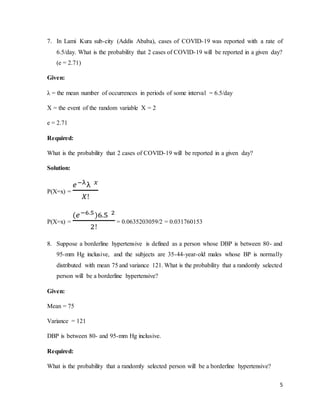
] ≤ [
(X
̅− µ)
σ
√𝑛
⁄
] ≤ [
(125 − 120)
15
√50
⁄
]
p (115 ≤ 𝑋̅ ≤ 125) = p[
(115 − 120)
15
√50
⁄
] ≤ 𝑍 ≤ [
(125 − 120)
15
√50
⁄
]
p (115 ≤ 𝑋̅ ≤ 125) = p (−2.357 ≤ 𝑍 ≤ 2.357 )
Since the Z table shows at two decimal places, I approximated the values to two decimal
places. p (115 ≤ 𝑋̅ ≤ 125) = p (-2.36 ≤ Z ≤ 2.36)
p (115 ≤ 𝑋̅ ≤ 125) = p (𝑍 ≤ 2.36 )− 𝑝 (𝑍 ≤ − 2.36)
p (115 ≤ 𝑋̅ ≤ 125) = 0.9909 - 0.0091
p (115 ≤ 𝑋̅ ≤ 125) = 0.9818
Thus, approximately 98.18 % of normal sample will yield a mean between 115 and 125
micrograms per 100 ml.
2. The National Health and Nutrition Examination Survey of 1988–1994 (NHANES III, A-
1) estimated the mean serum cholesterol level for U.S. females aged 20–74 years to be 204
mg/dl. The estimate of the standard deviation was approximately 44. Using these estimates
as the mean x and standard deviation s for the U.S. population, consider the sampling
distribution of the sample mean based on samples of size 50 drawn from women in this age
group. What is the mean of the sampling distribution? The standard error?
Given:
Mean (𝑋̅) = 204
σ = 44,
n = 50,
Required:
What is the mean of the sampling distribution?
The standard error?](https://image.slidesharecdn.com/bio-hab-220127145439/85/Biostatistics-Assignment-4-320.jpg)
![4
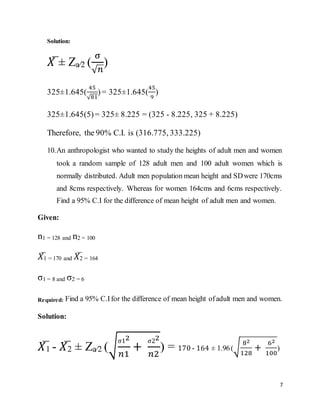
Therefore, the probability that a resident consumes at least four types of food = (P ≥ 4) is
0.2325 (23.25 %)
5. What is expected value/Population mean?
The expected value (EV) is calculated by multiplying each of the possible outcomes by the
likelihood each outcome will occur and then summing all of those values.
EV = ∑ P(Xi) × Xi
EV = (1 × 0.4231) + (2 × 0.3321) + (3 × 0.0123) + (4 × 0.1431) + (5 × 0.0231) + (6 × 0.0663)
EV = 0.4231 + 0.6642 + 0.0369 + 0.5724 + 0.1155 + 0.3978
EV = 2.2099
Therefore, the expected value (population mean) is 2.2099
6. What is the variance of the population around the mean?
σ = √𝑉𝑎𝑟 (𝑋)
σ2 = [(1 - 2.2099)2 0.4231] + [(2 - 2.2099)2 0.3321] + [(3 - 2.2099)2 0.0123] + [(4 - 2.2099)2
0.1431] + [(5 - 2.2099)2 0.0231] + [(6 - 2.2099)2 0.0663]
σ2 = [(-1.2099)2 0.4231] + [(- 0.2099)2 0.3321] + [(0.7901)2 0.0123] + [(1.7901)2 0.1431] +
[(2.7901)2 0.0231] + [(3.7901)2 0.0663]
σ2 = [0.61935832] + [0.0146316651] + [0.0076783735] + [0.4585579412] + [0.1798256] +
[0.9523900861]
σ2 = 2.2324419859 σ = √𝑉𝑎𝑟 (𝑋) σ = √2.2324419859
Therefore, the variance of the population around the mean is 2.23](https://image.slidesharecdn.com/bio-hab-220127145439/85/Biostatistics-Assignment-6-320.jpg)
![6
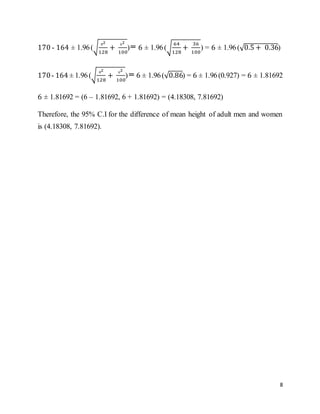
Solution:
Let X be DBP, X ~ N (75, 121)
σ = √𝑉𝑎𝑟𝑖𝑎𝑛𝑐𝑒 = √121 = 11
P (80 < 𝑋̅ < 95) = P [
(80 − 75)
11
] < [
(X
̅− µ)
σ
] < [
(95 − 75)
11
]
P (80 < 𝑋̅ < 95) = P [
(80 − 75)
11
] < 𝑍 < [
(95 − 75)
11
]
P (80 < 𝑋̅ < 95) = P (0.45454545454545454545454545454545 < 𝑍 <
1.8181818181818181818181818181818)
Since the Z table shows at two decimal places, I approximated the values to two decimal
places. P (80 < 𝑋̅ < 95) = P (0.46 < 𝑍 < 1.82)
P (80 < 𝑋̅ < 95) = P (0.46 < 𝑍 < 1.82)
P (80 < 𝑋̅ < 95) = P (Z < 1.82) – P (Z < 0.46)
P (80 < 𝑋̅ < 95) = 0.9656 – 0.6772
P (80 < 𝑋̅ < 95) = 0.2884
Thus, approximately 28.84 % of this population will be borderline hypertensive.
9. The mean reading speed of a random sample of 81 adults is 325 words per minute. If the
standard deviation for all adults is 45 words per minute; Find a 90% C.I.
Given:
n = 81
𝑋̅ = 325
σ = 45
90% C.I. = 1.645
Required: Find a 90% C.I.](https://image.slidesharecdn.com/bio-hab-220127145439/85/Biostatistics-Assignment-8-320.jpg)

1. The probability that a random sample of 50 normal men will yield a mean serum iron level between 115 and 125 micrograms per 100 ml is approximately 98.18%. 2. The mean of the sampling distribution for the mean serum cholesterol level of US females based on samples of size 50 is 204 mg/dl. The standard error is 6.22 mg/dl. 3. The probability that a resident consumes at most 3 types of food is 0.7675 or 76.75%.