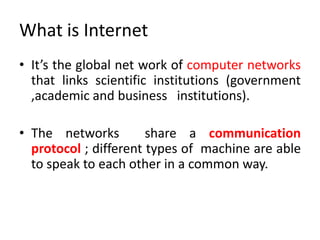
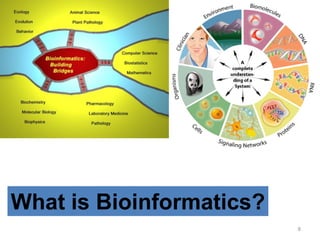
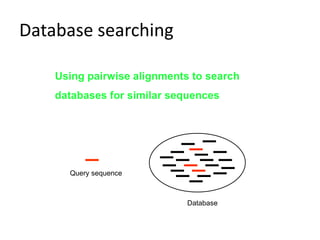
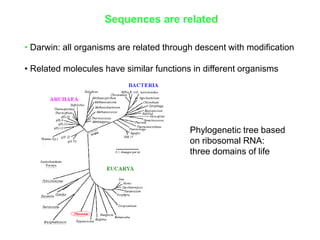
The document provides an overview of bioinformatics, describing the internet as a communication network and introducing bioinformatics as the application of IT for managing biological information. It highlights various bioinformatics applications, including DNA sequence analysis, molecular modeling, and ecological studies, and outlines the importance of databases and software tools in this field. Additionally, it discusses the significance of sequence analysis and database querying for understanding genetic relationships and functionalities.
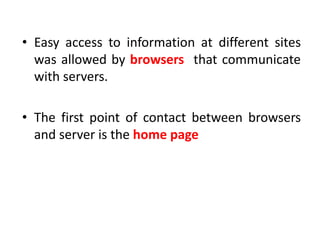
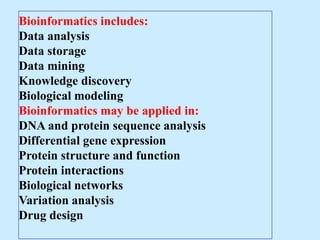

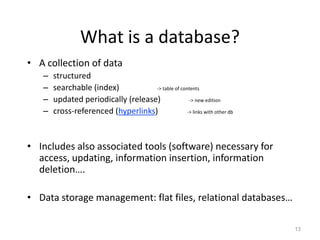
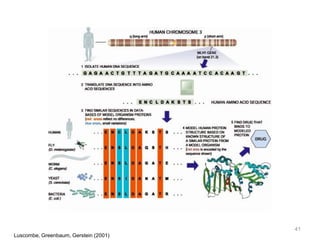
![In bioinformatics, FASTA format is a text-based format for representing
either nucleotide sequences or peptide sequences, in which nucleotides
or amino acids are represented using single-letter codes.
The format also allows for sequence names and comments to precede the
sequences.
>gi|5524211|gb|AAD44166.1| cytochrome b [Elephas maximus maximus]
LCLYTHIGRNIYYGSYLYSETWNTGIMLLLITMATAFMGYVLPWGQMSFWGATVITNLFSAIPYIGTNLV
EWIWGGFSVDKATLNRFFAFHFILPFTMVALAGVHLTFLHETGSNNPLGLTSDSDKIPFHPYYTIKDFLG
LLILILLLLLLALLSPDMLGDPDNHMPADPLNTPLHIKPEWYFLFAYAILRSVPNKLGGVLALFLSIVIL
GLMPFLHTSKHRSMMLRPLSQALFWTLTMDLLTLTWIGSQPVEYPYTIIGQMASILYFSIILAFLPIAGX
IENY
>gi|14456711|ref|NM_000558.3| Homo sapiens hemoglobin, alpha 1 (HBA1), mRNA
ACTCTTCTGGTCCCCACAGACTCAGAGAGAACCCACCATGGTGCTGTCTCCTGCCGACAAGACCAACGTCAAGGCCGCCTGGGGTAAGGTCGG
CGCGCACGCTGGCGAGTATGGTGCGGAGGCCCTGGAGAGGATGTTCCTGTCCTTCCCCACCACCAAGACCTACTTCCCGCACTTCGACCTGAG
CCACGGCTCTGCCCAGGTTAAGGGCCACGGCAAGAAGGTGGCCGACGCGCTGACCAACGCCGTGGCGCACGTGGACGACATGCCCAACGCGCT
GTCCGCCCTGAGCGACCTGCACGCGCACAAGCTTCGGGTGGACCCGGTCAACTTCAAGCTCCTAAGCCACTGCCTGCTGGTGACCCTGGCCGC
CCACCTCCCCGCCGAGTTCACCCCTGCGGTGCACGCCTCCCTGGACAAGTTCCTGGCTTCTGTGAGCACCGTGCTGACCTCCAAATACCGTTA
AGCTGGAGCCTCGGTGGCCATGCTTCTTGCCCCTTGGGCCTCCCCCCAGCCCCTCCTCCCCTTCCTGCACCCGTACCCCCGTGGTCTTTGAAT
AAAGTCTGAGTGGGCGGC](https://image.slidesharecdn.com/bioinformatics-221124065210-abd8d756/85/Bioinformatics-pdf-17-320.jpg)
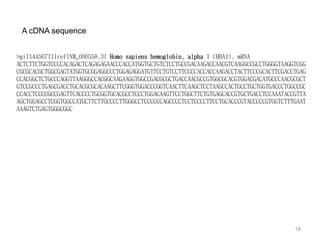
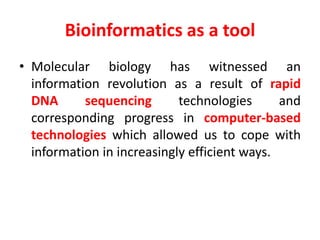
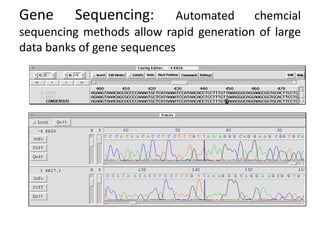
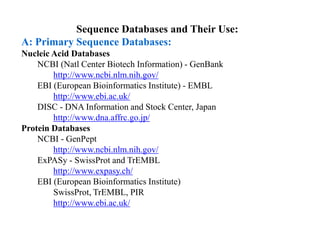
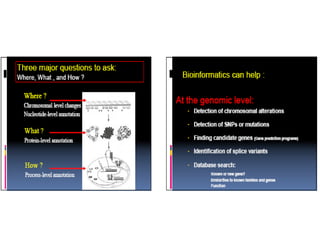
![A cDNA sequence (reading frame)
A protein sequence
>gi|14456711|ref|NM_000558.3| Homo sapiens hemoglobin, alpha 1 (HBA1), mRNA
ACTCTTCTGGTCCCCACAGACTCAGAGAGAACCCACCATGGTGCTGTCTCCTGCCGACAAGACCAACGTCAAGGCCGCCTGGGGTAAGGTC
GGCGCGCACGCTGGCGAGTATGGTGCGGAGGCCCTGGAGAGGATGTTCCTGTCCTTCCCCACCACCAAGACCTACTTCCCGCACTTCGACCTG
AGCCACGGCTCTGCCCAGGTTAAGGGCCACGGCAAGAAGGTGGCCGACGCGCTGACCAACGCCGTGGCGCACGTGGACGACATGCCCAACGCG
CTGTCCGCCCTGAGCGACCTGCACGCGCACAAGCTTCGGGTGGACCCGGTCAACTTCAAGCTCCTAAGCCACTGCCTGCTGGTGACCCTGGCC
GCCCACCTCCCCGCCGAGTTCACCCCTGCGGTGCACGCCTCCCTGGACAAGTTCCTGGCTTCTGTGAGCACCGTGCTGACCTCCAAATACCGT
TAAGCTGGAGCCTCGGTGGCCATGCTTCTTGCCCCTTGGGCCTCCCCCCAGCCCCTCCTCCCCTTCCTGCACCCGTACCCCCGTGGTCTTT
GAATAAAGTCTGAGTGGGCGGC
>gi|4504347|ref|NP_000549.1| alpha 1 globin [Homo sapiens]
MVLSPADKTNVKAAWGKVGAHAGEYGAEALERMFLSFPTTKTYFPHFDLSHGSAQVKGHGKKVADALTNAVAHVDDMPNALSALSDL
HAHKLRVDPVNFKLLSHCLLVTLAAHLPAEFTPAVHASLDKFLASVSTVLTSKYR
19](https://image.slidesharecdn.com/bioinformatics-221124065210-abd8d756/85/Bioinformatics-pdf-19-320.jpg)


![PERI-PROSTHETIC FRACTURE NAIL-PLATE CONSTRUCT [NPC].pptx](https://cdn.slidesharecdn.com/ss_thumbnails/drarunkumardrmohamedashrafperiprostheticfrasturenail-plateconstructnpc-260209164459-7e9d15a1-thumbnail.jpg?width=640&height=640&fit=bounds)


