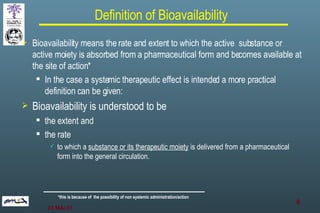
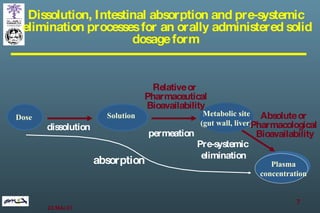
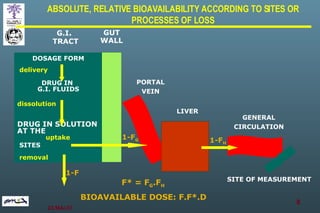
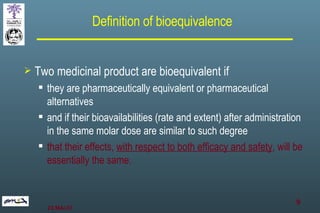
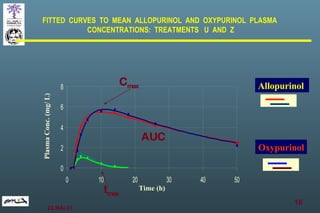
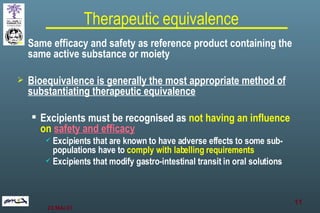
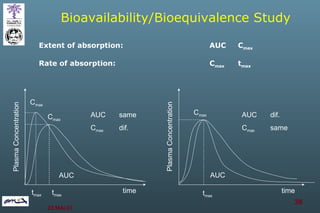
The document discusses bioavailability (BA) and bioequivalence (BE) assessment within pharmaceutical regulations, focusing on design and conduct of studies. It defines bioavailability as the extent and rate at which a substance is absorbed into circulation, and outlines criteria for establishing bioequivalence between medicinal products. Additionally, it addresses regulatory guidelines, variability in study populations, the influence of food on drug absorption, and the importance of metabolites in bioequivalence determination.


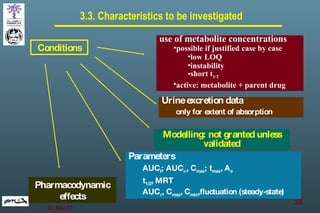
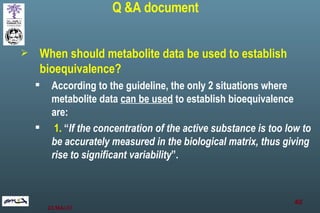
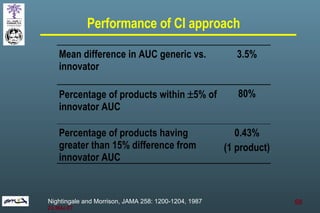
![Statistical analysis example -hydrochlorothiazide [84,5 – 106]% 94,7% AUC 0-inf [87,6 – 106]% 96,8% AUC 0-t [85,3 – 101]% 93,0% C max 90% CI T / R Parameter](https://image.slidesharecdn.com/bioavailability-and-bioequivalence-problems-and-pitfalls-8278/85/Bioavailability-and-bioequivalence-problems-and-pitfalls-47-320.jpg)


![New Drug Application [NDA]](https://cdn.slidesharecdn.com/ss_thumbnails/newdrugapplicationnda-160619063242-thumbnail.jpg?width=640&height=640&fit=bounds)


