Skip to main content
Download free for 30 days
Sign in
Upload
Language (EN)
Support
Business
Mobile
Social Media
Marketing
Technology
Art & Photos
Career
Design
Education
Presentations & Public Speaking
Government & Nonprofit
Healthcare
Internet
Law
Leadership & Management
Automotive
Engineering
Software
Recruiting & HR
Retail
Sales
Services
Science
Small Business & Entrepreneurship
Food
Environment
Economy & Finance
Data & Analytics
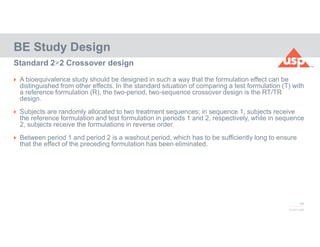
Investor Relations
Sports
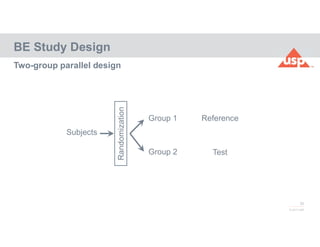
Spiritual
News & Politics
Travel
Self Improvement
Real Estate
Entertainment & Humor
Health & Medicine
Devices & Hardware
Lifestyle
EN
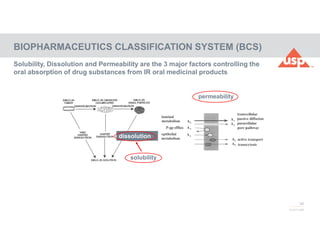
Upload
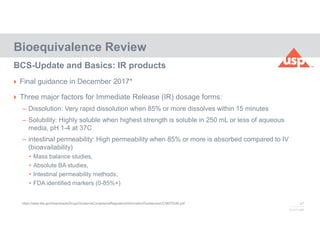
Download free for 30 days
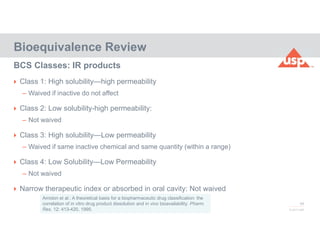
Sign in
Uploaded by
WaqasAhmed706069
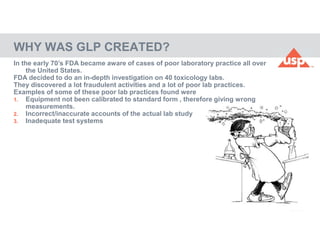
27 views
Bioequivalence studies PK, GCP GLP and inspections
Bioequivalence PK Karachi 2018.pdf
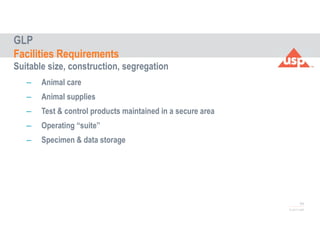
Health & Medicine
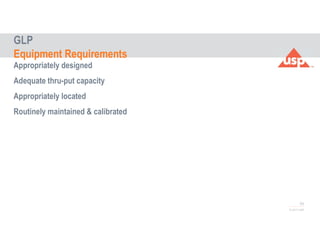
◦
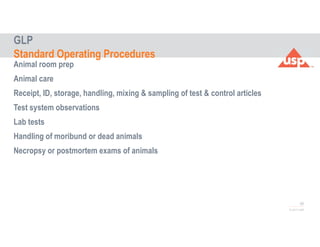
Read more
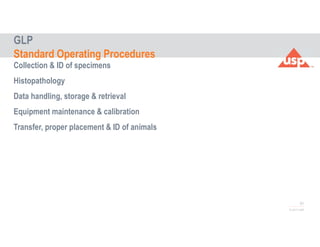
0
Save
Share
Embed
Save to Drive
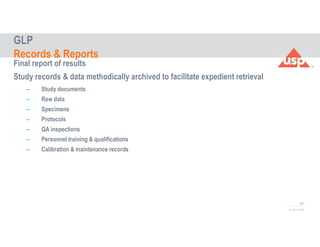
Download now
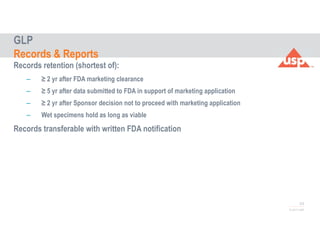
Download to read offline
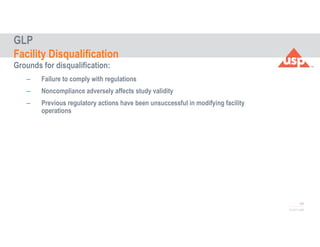
1
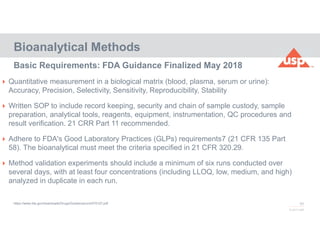
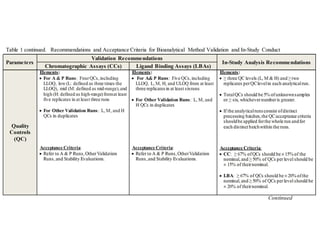
/ 148
2
/ 148
3
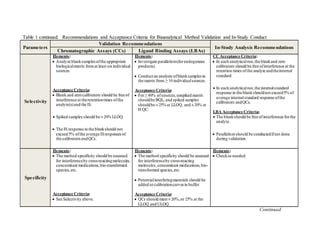
/ 148
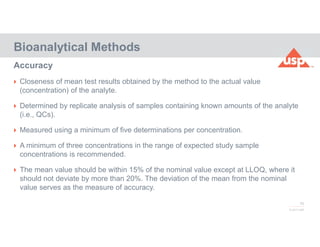
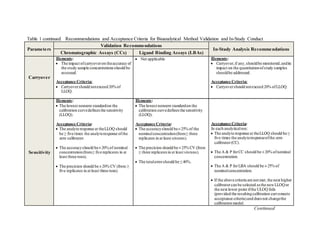
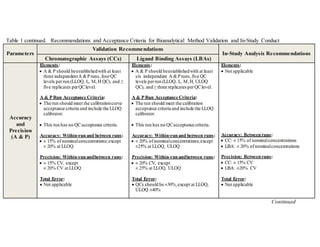
4
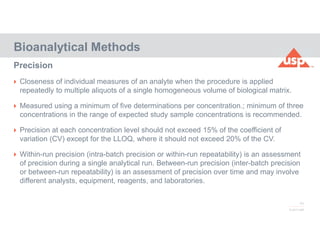
/ 148
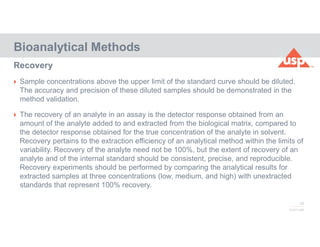
5
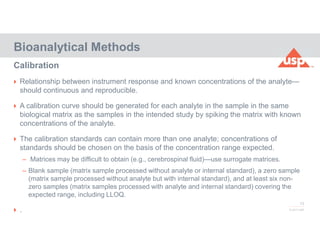
/ 148
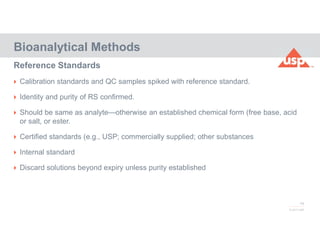
6
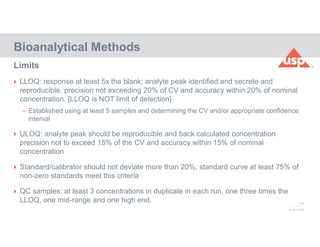
/ 148
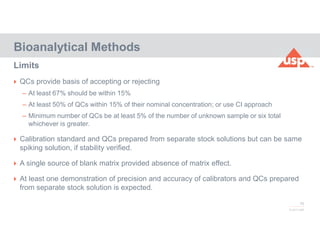
7
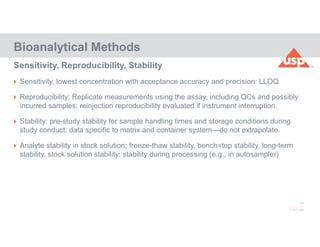
/ 148
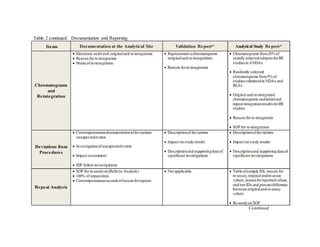
8
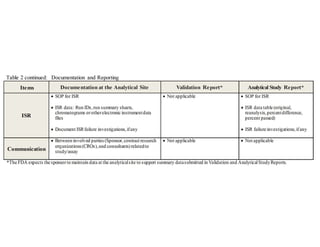
/ 148
9
/ 148
10
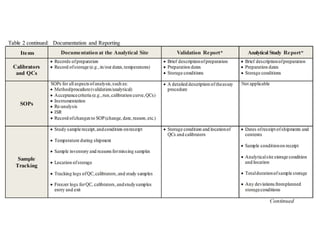
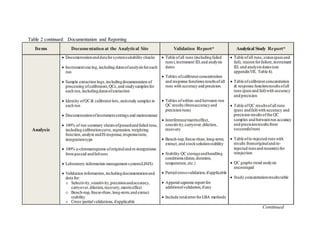
/ 148
11
/ 148
12
/ 148
13
/ 148
14
/ 148
15
/ 148
16
/ 148
17
/ 148
18
/ 148
19
/ 148
20
/ 148
More Related Content
PDF
Bio-equivalence of Generic Drug
by
Md. Mizanur Rahman Miajee
74 slides
2.2K views
PPTX
Clinical significance of be studies
by
Durgadevi Ganesan
15 slides
11K views
PPTX
Regulatory aspects of bioequivalence iss xr4-revised
by
E. Dennis Bashaw
52 slides
1.2K views
PPTX
Bioavailability and bioequivalence
by
muliksudip
41 slides
38.6K views
PPT
Therapeutic action and Bioequivalence.ppt
by
PreetiKarwa1
35 slides
44 views
PPT
Bioequivalence study for pharmaceutical product.ppt
by
mkaisar0307
35 slides
0 views
PDF
Bioavailability and Bioequivalence detail.pdf
by
Home
57 slides
737 views
PPT
Therequiv
by
cqpate
46 slides
3.1K views
Bio-equivalence of Generic Drug
by
Md. Mizanur Rahman Miajee
74 slides
2.2K views
Clinical significance of be studies
by
Durgadevi Ganesan
15 slides
11K views
Regulatory aspects of bioequivalence iss xr4-revised
by
E. Dennis Bashaw
52 slides
1.2K views
Bioavailability and bioequivalence
by
muliksudip
41 slides
38.6K views
Therapeutic action and Bioequivalence.ppt
by
PreetiKarwa1
35 slides
44 views
Bioequivalence study for pharmaceutical product.ppt
by
mkaisar0307
35 slides
0 views
Bioavailability and Bioequivalence detail.pdf
by
Home
57 slides
737 views
Therequiv
by
cqpate
46 slides
3.1K views
Similar to Bioequivalence studies PK, GCP GLP and inspections
PDF
Bioequivalence & Bioavailability
by
Michael Swit
24 slides
5.4K views
PPT
Group 3 Biovailability and Bioequivalance.ppt
by
BarakaFundo
74 slides
10 views
PPTX
Bioequivalence 112070804009
by
Patel Parth
32 slides
71.6K views
PPTX
Bioequivalence
by
Dr. Rupendra Bharti
66 slides
2.8K views
PPTX
Parameters to evaluate Bioequivalence
by
Vinitha Nair
19 slides
9.9K views
PPTX
bioequivalencestudies-130210235231-phpapp02.pptx
by
GaneshSureshKumbhar
19 slides
134 views
PPT
Bioavailability and Bioequivalence study.ppt
by
yogahirrao11
95 slides
122 views
PPT
Bioavailability and bioequivalence – problems and pitfalls
by
inemet
85 slides
10.2K views
PPTX
DRUG PRODUCT PERFORMANCE, IN VIVO.pptx
by
subhanalla505
23 slides
1.7K views
PPTX
bioavailability and bioequivalence
by
alviya thomas
36 slides
425 views
PDF
bioavailability and bioequivalence studies
by
AneesurRahman35
89 slides
54 views
PPTX
ba be studies
by
Rohit K.
89 slides
30.3K views
PDF
Bioequivalence MANIK
by
Imran Nur Manik
26 slides
531 views
PPT
BA-BE Bio-availability and Bio-equivalency
by
Dr. Jigar Vyas
41 slides
398 views
PDF
Final bioequivalanve presentation
by
Yasir Mehmood
62 slides
156 views
PPTX
Drug product performance
by
VivekBihania
33 slides
25.8K views
PPT
BaBE-Bioavailability and Bioequivalance
by
Dr. Jigar Vyas
41 slides
474 views
PPTX
a be & drug product assessment.pptx
by
PawanDhamala1
18 slides
1.4K views
PPTX
clinical significance of bioequivalaence studies- pptx
by
njoecreations99
28 slides
1.5K views
PDF
ASEAN-Guideline-Conduct-Bioequivalence 2015.PDF
by
ManivannanKathirvel1
44 slides
266 views
Bioequivalence & Bioavailability
by
Michael Swit
24 slides
5.4K views
Group 3 Biovailability and Bioequivalance.ppt
by
BarakaFundo
74 slides
10 views
Bioequivalence 112070804009
by
Patel Parth
32 slides
71.6K views
Bioequivalence
by
Dr. Rupendra Bharti
66 slides
2.8K views
Parameters to evaluate Bioequivalence
by
Vinitha Nair
19 slides
9.9K views
bioequivalencestudies-130210235231-phpapp02.pptx
by
GaneshSureshKumbhar
19 slides
134 views
Bioavailability and Bioequivalence study.ppt
by
yogahirrao11
95 slides
122 views
Bioavailability and bioequivalence – problems and pitfalls
by
inemet
85 slides
10.2K views
DRUG PRODUCT PERFORMANCE, IN VIVO.pptx
by
subhanalla505
23 slides
1.7K views
bioavailability and bioequivalence
by
alviya thomas
36 slides
425 views
bioavailability and bioequivalence studies
by
AneesurRahman35
89 slides
54 views
ba be studies
by
Rohit K.
89 slides
30.3K views
Bioequivalence MANIK
by
Imran Nur Manik
26 slides
531 views
BA-BE Bio-availability and Bio-equivalency
by
Dr. Jigar Vyas
41 slides
398 views
Final bioequivalanve presentation
by
Yasir Mehmood
62 slides
156 views
Drug product performance
by
VivekBihania
33 slides
25.8K views
BaBE-Bioavailability and Bioequivalance
by
Dr. Jigar Vyas
41 slides
474 views
a be & drug product assessment.pptx
by
PawanDhamala1
18 slides
1.4K views
clinical significance of bioequivalaence studies- pptx
by
njoecreations99
28 slides
1.5K views
ASEAN-Guideline-Conduct-Bioequivalence 2015.PDF
by
ManivannanKathirvel1
44 slides
266 views
Recently uploaded
PPTX
Tablet part-2.Industrial Pharmacy, Pharmaceutics
by
Pragati Mahajan
54 slides
55 views
PDF
Introduction to Pharmacognosy: History, Sources, and Scope
by
PAWAN KUMAR SAHU
10 slides
46 views
PDF
Kaplan and Sadock’s Synopsis of Psychiatry 12th Edition Robert Boland
by
samiomedu
21 slides
29 views
PPTX
Comprehensive Overview of Coagulants and Anticoagulants in Blood Clotting
by
Ashish Umale
15 slides
51 views
PPTX
Comprehensive Overview of Circulatory System and Blood Pressure Regulation
by
gm750668
54 slides
69 views
PDF
Davidson's Principles and Practice of Medicine 24th Edition Ian Penman
by
skyusbook4
21 slides
68 views
PDF
Katzung's Basic and Clinical Pharmacology 16th Edition Todd Vanderah
by
caremed79
21 slides
22 views
PPTX
final sih.pptx aaaaaaaaaaaaaaaaaaaaaaaaaaaaaaaaaaaaaa
by
ankitkumar4ever07
12 slides
376 views
PDF
MRI Technologist Excellence Manual — Advancing Global Standards in MRI Safety...
by
Dr Jitu Lal Meena
57 slides
37 views
PPTX
Comprehensive Overview of Drugs Used in Shock Therapy and Management
by
Ashish Umale
12 slides
148 views
PPTX
Six Sigma Methodology for Quality Improvement in Pharmaceuticals
by
Parul University, Vadodara, Gujarat
29 slides
28 views
PPTX
Out of Specification (OOS) Results in Pharmaceutical Quality Control
by
Parul University, Vadodara, Gujarat
25 slides
46 views
PDF
Marks' Basic Medical Biochemistry 6th Edition Michael Lieberman
by
medestaya
21 slides
35 views
PPTX
Clinical Enzymology and Diagnostic Enzymes
by
Prof.Dr.Farukh Khan
25 slides
204 views
PPTX
Comprehensive Overview of Carbohydrates: Structure, Function, and Nutrition
by
Amit kumar Singh
12 slides
36 views
PDF
The Harriet Lane Handbook 24th Edition Tolulope Fatola
by
carebamed
21 slides
69 views
PPTX
Comprehensive Overview of Haematinics and Anaemia Management
by
Ashish Umale
20 slides
155 views
PDF
Gray's Anatomy for Students 5th Edition Drake, Vogl
by
macmorino7
21 slides
31 views
PDF
The Biology of Cancer 3rd Edition Robert Weinberg
by
carebamed
21 slides
192 views
PPTX
Comprehensive Guide to Proof Spirit and Pharmaceutical Compounding Techniques
by
Parul University, Vadodara, Gujarat
27 slides
52 views
Tablet part-2.Industrial Pharmacy, Pharmaceutics
by
Pragati Mahajan
54 slides
55 views
Introduction to Pharmacognosy: History, Sources, and Scope
by
PAWAN KUMAR SAHU
10 slides
46 views
Kaplan and Sadock’s Synopsis of Psychiatry 12th Edition Robert Boland
by
samiomedu
21 slides
29 views
Comprehensive Overview of Coagulants and Anticoagulants in Blood Clotting
by
Ashish Umale
15 slides
51 views
Comprehensive Overview of Circulatory System and Blood Pressure Regulation
by
gm750668
54 slides
69 views
Davidson's Principles and Practice of Medicine 24th Edition Ian Penman
by
skyusbook4
21 slides
68 views
Katzung's Basic and Clinical Pharmacology 16th Edition Todd Vanderah
by
caremed79
21 slides
22 views
final sih.pptx aaaaaaaaaaaaaaaaaaaaaaaaaaaaaaaaaaaaaa
by
ankitkumar4ever07
12 slides
376 views
MRI Technologist Excellence Manual — Advancing Global Standards in MRI Safety...
by
Dr Jitu Lal Meena
57 slides
37 views
Comprehensive Overview of Drugs Used in Shock Therapy and Management
by
Ashish Umale
12 slides
148 views
Six Sigma Methodology for Quality Improvement in Pharmaceuticals
by
Parul University, Vadodara, Gujarat
29 slides
28 views
Out of Specification (OOS) Results in Pharmaceutical Quality Control
by
Parul University, Vadodara, Gujarat
25 slides
46 views
Marks' Basic Medical Biochemistry 6th Edition Michael Lieberman
by
medestaya
21 slides
35 views
Clinical Enzymology and Diagnostic Enzymes
by
Prof.Dr.Farukh Khan
25 slides
204 views
Comprehensive Overview of Carbohydrates: Structure, Function, and Nutrition
by
Amit kumar Singh
12 slides
36 views
The Harriet Lane Handbook 24th Edition Tolulope Fatola
by
carebamed
21 slides
69 views
Comprehensive Overview of Haematinics and Anaemia Management
by
Ashish Umale
20 slides
155 views
Gray's Anatomy for Students 5th Edition Drake, Vogl
by
macmorino7
21 slides
31 views
The Biology of Cancer 3rd Edition Robert Weinberg
by
carebamed
21 slides
192 views
Comprehensive Guide to Proof Spirit and Pharmaceutical Compounding Techniques
by
Parul University, Vadodara, Gujarat
27 slides
52 views
Bioequivalence studies PK, GCP GLP and inspections
2.
Training in Bioequivalence
Analysis June 7-11, Dow Medical University, Karachi, Pakistan Instructor: Sarfaraz K. Niazi
3.
3 © 2017 USP
Bioequivalence Review Contract Research Organization – Good Clinical Practice – Good Laboratory Practice – 21 CFR 11 Compliance – Auditing by DRAP Protocol Review Statistical Review Report Writing Training in Bioequivalence Analysis Course Description
4.
4 © 2017 USP
Concept of bioavailability Historical cases of bio-inequivalence Bioequivalence testing : EMA and FDA guidelines Study designs Bioequivalence criteria Special issues Bioequivalence Review Discussion Topics
5.
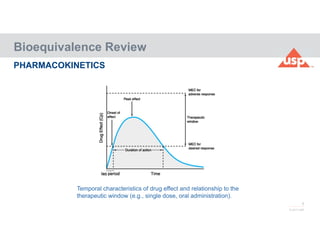
5 © 2017 USP PHARMACOKINETICS Bioequivalence
Review Temporal characteristics of drug effect and relationship to the therapeutic window (e.g., single dose, oral administration).
6.
6 © 2017 USP The
extent and the rate to which a drug substance or its therapeutic moiety is delivered from a pharmaceutical form into the general circulation absolute bioavailability relative bioavailability Bioequivalence Review
7.
7 © 2017 USP BIOAVAILABILITY Changes
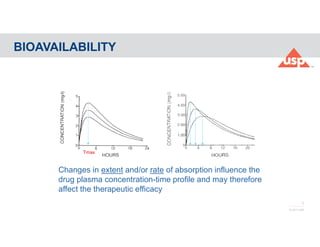
in extent and/or rate of absorption influence the drug plasma concentration-time profile and may therefore affect the therapeutic efficacy Tmax Cmax AUC1=AUC2=AUC3 AUC1AUC2AUC3
8.
8 © 2017 USP ABSOLUTE
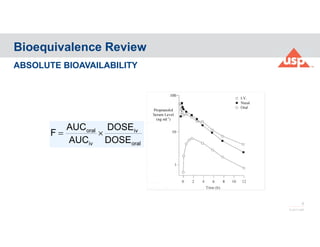
BIOAVAILABILITY Bioequivalence Review oral iv iv oral DOSE DOSE AUC AUC F
9.
9 © 2017 USP RELATIVE
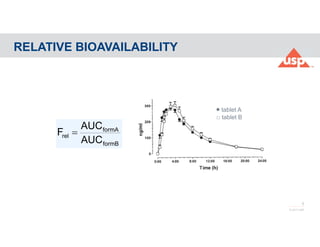
BIOAVAILABILITY □ tablet B formB formA rel AUC AUC F tablet A
10.
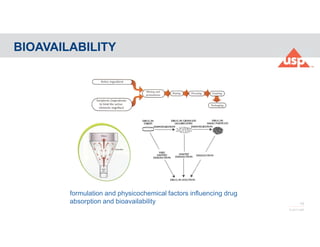
10 © 2017 USP BIOAVAILABILITY formulation
and physicochemical factors influencing drug absorption and bioavailability
11.
11 © 2017 USP
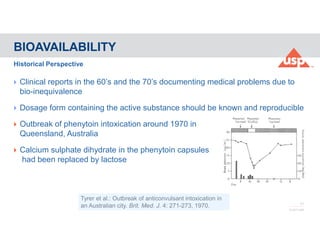
Clinical reports in the 60’s and the 70’s documenting medical problems due to bio-inequivalence Dosage form containing the active substance should be known and reproducible Outbreak of phenytoin intoxication around 1970 in Queensland, Australia Calcium sulphate dihydrate in the phenytoin capsules had been replaced by lactose BIOAVAILABILITY Historical Perspective Tyrer et al.: Outbreak of anticonvulsant intoxication in an Australian city. Brit. Med. J. 4: 271-273, 1970.
12.
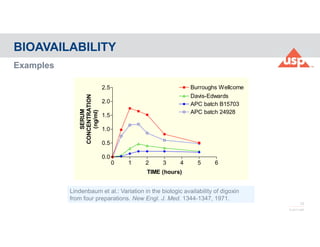
12 © 2017 USP Examples BIOAVAILABILITY Lindenbaum
et al.: Variation in the biologic availability of digoxin from four preparations. New Engl. J. Med. 1344-1347, 1971. 0 1 2 3 4 5 6 0.0 0.5 1.0 1.5 2.0 2.5 Burroughs Wellcome APC batch B15703 Davis-Edwards APC batch 24928 TIME (hours) SERUM CONCENTRATION (ng/ml)
13.
13 © 2017 USP
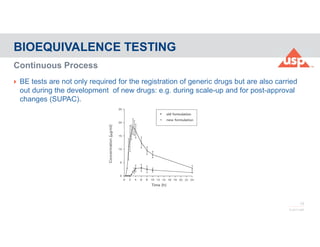
BE tests are not only required for the registration of generic drugs but are also carried out during the development of new drugs: e.g. during scale-up and for post-approval changes (SUPAC). BIOEQUIVALENCE TESTING Continuous Process
15.
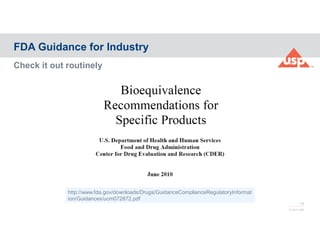
15 © 2017 USP Check
it out routinely FDA Guidance for Industry http://www.fda.gov/downloads/Drugs/GuidanceComplianceRegulatoryInformat ion/Guidances/ucm072872.pdf
16.
16 © 2017 USP
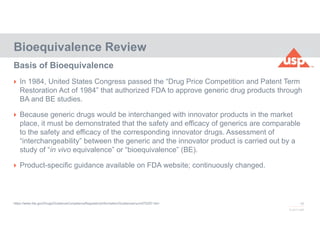
In 1984, United States Congress passed the “Drug Price Competition and Patent Term Restoration Act of 1984” that authorized FDA to approve generic drug products through BA and BE studies. Because generic drugs would be interchanged with innovator products in the market place, it must be demonstrated that the safety and efficacy of generics are comparable to the safety and efficacy of the corresponding innovator drugs. Assessment of “interchangeability” between the generic and the innovator product is carried out by a study of “in vivo equivalence” or “bioequivalence” (BE). Product-specific guidance available on FDA website; continuously changed. Bioequivalence Review Basis of Bioequivalence https://www.fda.gov/Drugs/GuidanceComplianceRegulatoryInformation/Guidances/ucm075207.htm
17.
17 © 2017 USP
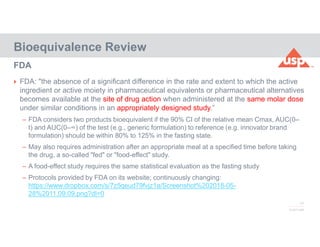
FDA: "the absence of a significant difference in the rate and extent to which the active ingredient or active moiety in pharmaceutical equivalents or pharmaceutical alternatives becomes available at the site of drug action when administered at the same molar dose under similar conditions in an appropriately designed study.” – FDA considers two products bioequivalent if the 90% CI of the relative mean Cmax, AUC(0– t) and AUC(0–∞) of the test (e.g., generic formulation) to reference (e.g. innovator brand formulation) should be within 80% to 125% in the fasting state. – May also requires administration after an appropriate meal at a specified time before taking the drug, a so-called "fed" or "food-effect" study. – A food-effect study requires the same statistical evaluation as the fasting study – Protocols provided by FDA on its website; continuously changing: https://www.dropbox.com/s/7z5qeud79fvjz1a/Screenshot%202018-05- 28%2011.09.09.png?dl=0 Bioequivalence Review FDA
18.
18 © 2017 USP
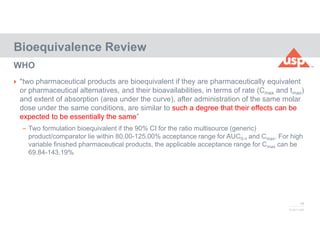
"two pharmaceutical products are bioequivalent if they are pharmaceutically equivalent or pharmaceutical alternatives, and their bioavailabilities, in terms of rate (Cmax and tmax) and extent of absorption (area under the curve), after administration of the same molar dose under the same conditions, are similar to such a degree that their effects can be expected to be essentially the same” – Two formulation bioequivalent if the 90% CI for the ratio multisource (generic) product/comparator lie within 80.00-125.00% acceptance range for AUC0–t and Cmax. For high variable finished pharmaceutical products, the applicable acceptance range for Cmax can be 69.84-143.19% Bioequivalence Review WHO
19.
19 © 2017 USP
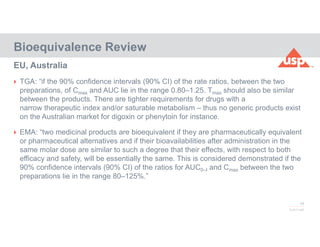
TGA: “if the 90% confidence intervals (90% CI) of the rate ratios, between the two preparations, of Cmax and AUC lie in the range 0.80–1.25. Tmax should also be similar between the products. There are tighter requirements for drugs with a narrow therapeutic index and/or saturable metabolism – thus no generic products exist on the Australian market for digoxin or phenytoin for instance. EMA: “two medicinal products are bioequivalent if they are pharmaceutically equivalent or pharmaceutical alternatives and if their bioavailabilities after administration in the same molar dose are similar to such a degree that their effects, with respect to both efficacy and safety, will be essentially the same. This is considered demonstrated if the 90% confidence intervals (90% CI) of the ratios for AUC0–t and Cmax between the two preparations lie in the range 80–125%.” Bioequivalence Review EU, Australia
20.
20 © 2017 USP
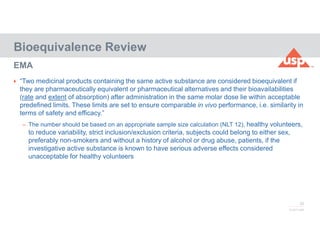
“Two medicinal products containing the same active substance are considered bioequivalent if they are pharmaceutically equivalent or pharmaceutical alternatives and their bioavailabilities (rate and extent of absorption) after administration in the same molar dose lie within acceptable predefined limits. These limits are set to ensure comparable in vivo performance, i.e. similarity in terms of safety and efficacy.” – The number should be based on an appropriate sample size calculation (NLT 12), healthy volunteers, to reduce variability, strict inclusion/exclusion criteria, subjects could belong to either sex, preferably non-smokers and without a history of alcohol or drug abuse, patients, if the investigative active substance is known to have serious adverse effects considered unacceptable for healthy volunteers Bioequivalence Review EMA
21.
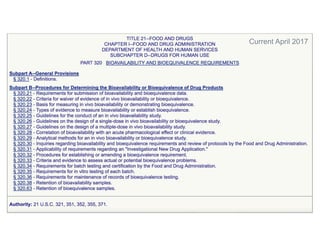
Current April 2017
22.
22 © 2017 USP –
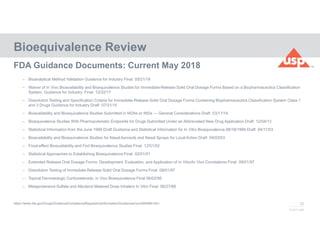
Bioanalytical Method Validation Guidance for Industry Final 05/21/18 – Waiver of In Vivo Bioavailability and Bioequivalence Studies for Immediate-Release Solid Oral Dosage Forms Based on a Biopharmaceutics Classification System. Guidance for Industry Final 12/22/17 – Dissolution Testing and Specification Criteria for Immediate-Release Solid Oral Dosage Forms Containing Biopharmaceutics Classification System Class 1 and 3 Drugs Guidance for Industry Draft 07/31/15 – Bioavailability and Bioequivalence Studies Submitted in NDAs or INDs — General Considerations Draft 03/17/14 – Bioequivalence Studies With Pharmacokinetic Endpoints for Drugs Submitted Under an Abbreviated New Drug Application Draft 12/04/13 – Statistical Information from the June 1999 Draft Guidance and Statistical Information for In Vitro Bioequivalence 08/18/1999 Draft 04/11/03 – Bioavailability and Bioequivalence Studies for Nasal Aerosols and Nasal Sprays for Local Action Draft 04/03/03 – Food-effect Bioavailability and Fed Bioequivalence Studies Final 12/01/02 – Statistical Approaches to Establishing Bioequivalence Final 02/01/01 – Extended Release Oral Dosage Forms: Development, Evaluation, and Application of In Vitro/In Vivo Correlations Final 09/01/97 – Dissolution Testing of Immediate Release Solid Oral Dosage Forms Final 08/01/97 – Topical Dermatologic Corticosteroids: in Vivo Bioequivalence Final 06/02/95 – Metaproterenol Sulfate and Albuterol Metered Dose Inhalers In Vitro Final 06/27/89 Bioequivalence Review FDA Guidance Documents: Current May 2018 https://www.fda.gov/Drugs/GuidanceComplianceRegulatoryInformation/Guidances/ucm064964.htm
23.
23 © 2017 USP
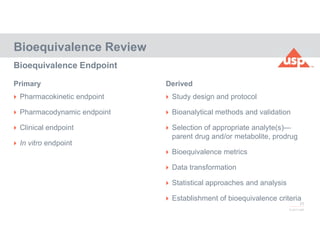
Pharmacokinetic endpoint Pharmacodynamic endpoint Clinical endpoint In vitro endpoint Primary Bioequivalence Endpoint Bioequivalence Review Derived Study design and protocol Bioanalytical methods and validation Selection of appropriate analyte(s)— parent drug and/or metabolite, prodrug Bioequivalence metrics Data transformation Statistical approaches and analysis Establishment of bioequivalence criteria
24.
24 © 2017 USP
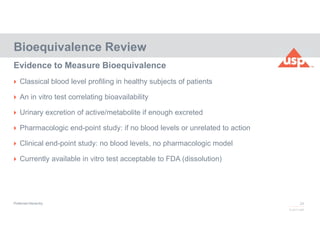
Classical blood level profiling in healthy subjects of patients An in vitro test correlating bioavailability Urinary excretion of active/metabolite if enough excreted Pharmacologic end-point study: if no blood levels or unrelated to action Clinical end-point study: no blood levels, no pharmacologic model Currently available in vitro test acceptable to FDA (dissolution) Bioequivalence Review Evidence to Measure Bioequivalence Preferred Hierarchy
25.
25 © 2017 USP
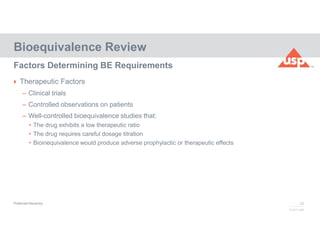
Therapeutic Factors – Clinical trials – Controlled observations on patients – Well-controlled bioequivalence studies that: • The drug exhibits a low therapeutic ratio • The drug requires careful dosage titration • Bioinequivalence would produce adverse prophylactic or therapeutic effects Bioequivalence Review Factors Determining BE Requirements Preferred Hierarchy
26.
26 © 2017 USP
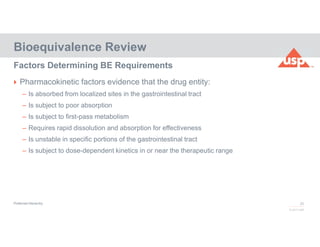
Pharmacokinetic factors evidence that the drug entity: – Is absorbed from localized sites in the gastrointestinal tract – Is subject to poor absorption – Is subject to first-pass metabolism – Requires rapid dissolution and absorption for effectiveness – Is unstable in specific portions of the gastrointestinal tract – Is subject to dose-dependent kinetics in or near the therapeutic range Bioequivalence Review Factors Determining BE Requirements Preferred Hierarchy
27.
27 © 2017 USP
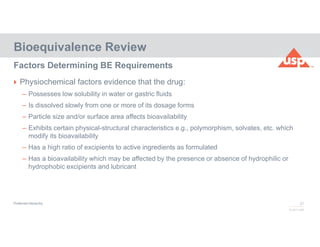
Physiochemical factors evidence that the drug: – Possesses low solubility in water or gastric fluids – Is dissolved slowly from one or more of its dosage forms – Particle size and/or surface area affects bioavailability – Exhibits certain physical-structural characteristics e.g., polymorphism, solvates, etc. which modify its bioavailability – Has a high ratio of excipients to active ingredients as formulated – Has a bioavailability which may be affected by the presence or absence of hydrophilic or hydrophobic excipients and lubricant Bioequivalence Review Factors Determining BE Requirements Preferred Hierarchy
28.
28 © 2017 USP
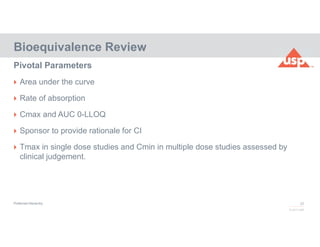
Area under the curve Rate of absorption Cmax and AUC 0-LLOQ Sponsor to provide rationale for CI Tmax in single dose studies and Cmin in multiple dose studies assessed by clinical judgement. Bioequivalence Review Pivotal Parameters Preferred Hierarchy
29.
29 © 2017 USP
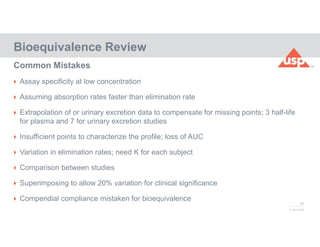
Assay specificity at low concentration Assuming absorption rates faster than elimination rate Extrapolation of or urinary excretion data to compensate for missing points; 3 half-life for plasma and 7 for urinary excretion studies Insufficient points to characterize the profile; loss of AUC Variation in elimination rates; need K for each subject Comparison between studies Superimposing to allow 20% variation for clinical significance Compendial compliance mistaken for bioequivalence Bioequivalence Review Common Mistakes
30.
30 © 2017 USP
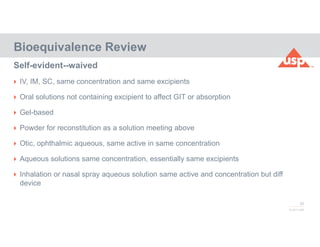
IV, IM, SC, same concentration and same excipients Oral solutions not containing excipient to affect GIT or absorption Gel-based Powder for reconstitution as a solution meeting above Otic, ophthalmic aqueous, same active in same concentration Aqueous solutions same concentration, essentially same excipients Inhalation or nasal spray aqueous solution same active and concentration but diff device Bioequivalence Review Self-evident--waived
31.
31 © 2017 USP
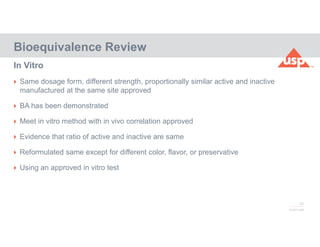
Same dosage form, different strength, proportionally similar active and inactive manufactured at the same site approved BA has been demonstrated Meet in vitro method with in vivo correlation approved Evidence that ratio of active and inactive are same Reformulated same except for different color, flavor, or preservative Using an approved in vitro test Bioequivalence Review In Vitro
32.
32 © 2017 USP
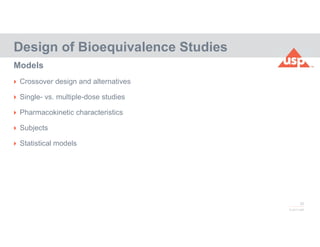
Crossover design and alternatives Single- vs. multiple-dose studies Pharmacokinetic characteristics Subjects Statistical models Design of Bioequivalence Studies Models
33.
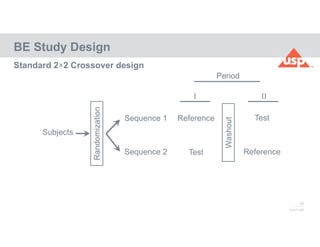
33 © 2017 USP BE
Study Design Standard 2×2 Crossover design Subjects Randomization Sequence 1 Sequence 2 Period I II Reference Test Test Reference Washout
34.
34 © 2017 USP
A bioequivalence study should be designed in such a way that the formulation effect can be distinguished from other effects. In the standard situation of comparing a test formulation (T) with a reference formulation (R), the two-period, two-sequence crossover design is the RT/TR design. Subjects are randomly allocated to two treatment sequences; in sequence 1, subjects receive the reference formulation and test formulation in periods 1 and 2, respectively, while in sequence 2, subjects receive the formulations in reverse order. Between period 1 and period 2 is a washout period, which has to be sufficiently long to ensure that the effect of the preceding formulation has been eliminated. BE Study Design Standard 2×2 Crossover design
35.
35 © 2017 USP BE
Study Design Two-group parallel design Subjects Randomization Group 1 Group 2 Reference Test
36.
36 © 2017 USP
Each subject receives one and only one formulation of a drug in a random fashion. Usually each group contains the same number of subjects. Higher subject numbers compared to a cross-over design, since the between-subject variability determines sample size (rather than within-subject variability). BE Study Design Two-group parallel design
37.
37 © 2017 USP
Advantages – Clinical part (sometimes) faster than crossover. – Straightforward statistical analysis. – Drugs with long half life. – Studies in patients. Disadvantages – Lower statistical power than crossover (rule of thumb: subject number should at least be doubled). – Phenotyping mandatory for drugs showing polymorphism BE Study Design Two-group parallel design
38.
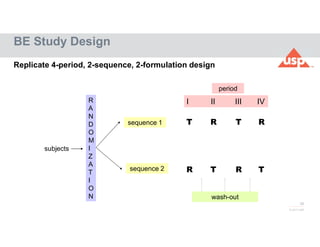
38 © 2017 USP Replicate
4-period, 2-sequence, 2-formulation design BE Study Design R A N D O M I Z A T I O N subjects sequence 1 sequence 2 R T T R period T R R T I II III IV wash-out
39.
39 © 2017 USP
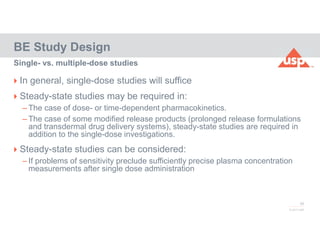
In general, single-dose studies will suffice Steady-state studies may be required in: – The case of dose- or time-dependent pharmacokinetics. – The case of some modified release products (prolonged release formulations and transdermal drug delivery systems), steady-state studies are required in addition to the single-dose investigations. Steady-state studies can be considered: – If problems of sensitivity preclude sufficiently precise plasma concentration measurements after single dose administration BE Study Design Single- vs. multiple-dose studies
40.
40 © 2017 USP
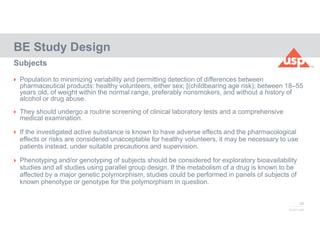
Population to minimizing variability and permitting detection of differences between pharmaceutical products: healthy volunteers, either sex; [(childbearing age risk); between 18–55 years old, of weight within the normal range, preferably nonsmokers, and without a history of alcohol or drug abuse. They should undergo a routine screening of clinical laboratory tests and a comprehensive medical examination. If the investigated active substance is known to have adverse effects and the pharmacological effects or risks are considered unacceptable for healthy volunteers, it may be necessary to use patients instead, under suitable precautions and supervision. Phenotyping and/or genotyping of subjects should be considered for exploratory bioavailability studies and all studies using parallel group design. If the metabolism of a drug is known to be affected by a major genetic polymorphism, studies could be performed in panels of subjects of known phenotype or genotype for the polymorphism in question. BE Study Design Subjects
41.
41 © 2017 USP
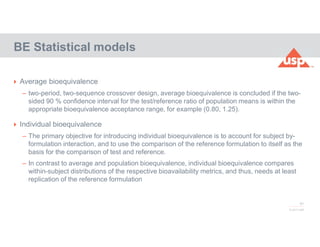
Average bioequivalence – two-period, two-sequence crossover design, average bioequivalence is concluded if the two- sided 90 % confidence interval for the test/reference ratio of population means is within the appropriate bioequivalence acceptance range, for example (0.80, 1.25). Individual bioequivalence – The primary objective for introducing individual bioequivalence is to account for subject by- formulation interaction, and to use the comparison of the reference formulation to itself as the basis for the comparison of test and reference. – In contrast to average and population bioequivalence, individual bioequivalence compares within-subject distributions of the respective bioavailability metrics, and thus, needs at least replication of the reference formulation BE Statistical models
42.
42 © 2017 USP
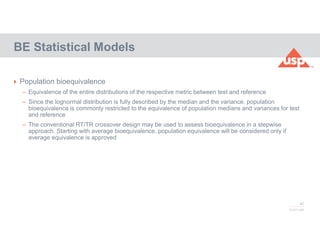
Population bioequivalence – Equivalence of the entire distributions of the respective metric between test and reference – Since the lognormal distribution is fully described by the median and the variance, population bioequivalence is commonly restricted to the equivalence of population medians and variances for test and reference – The conventional RT/TR crossover design may be used to assess bioequivalence in a stepwise approach. Starting with average bioequivalence, population equivalence will be considered only if average equivalence is approved BE Statistical Models
43.
43 © 2017 USP The
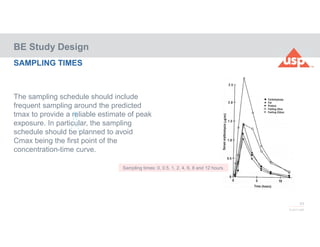
sampling schedule should include frequent sampling around the predicted tmax to provide a reliable estimate of peak exposure. In particular, the sampling schedule should be planned to avoid Cmax being the first point of the concentration-time curve. SAMPLING TIMES BE Study Design o Sampling times: 0, 0.5, 1, 2, 4, 6, 8 and 12 hours.
44.
44 © 2017 USP
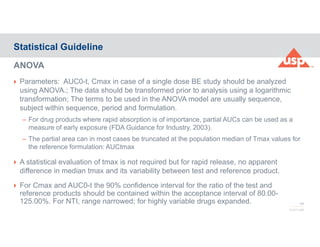
Parameters: AUC0-t, Cmax in case of a single dose BE study should be analyzed using ANOVA.; The data should be transformed prior to analysis using a logarithmic transformation; The terms to be used in the ANOVA model are usually sequence, subject within sequence, period and formulation. – For drug products where rapid absorption is of importance, partial AUCs can be used as a measure of early exposure (FDA Guidance for Industry, 2003). – The partial area can in most cases be truncated at the population median of Tmax values for the reference formulation: AUCtmax A statistical evaluation of tmax is not required but for rapid release, no apparent difference in median tmax and its variability between test and reference product. For Cmax and AUC0-t the 90% confidence interval for the ratio of the test and reference products should be contained within the acceptance interval of 80.00- 125.00%. For NTI, range narrowed; for highly variable drugs expanded. Statistical Guideline ANOVA
45.
45 © 2017 USP 90%
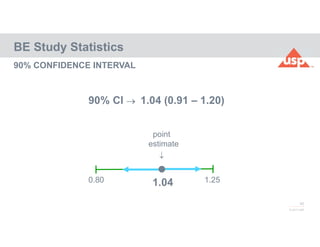
CONFIDENCE INTERVAL BE Study Statistics 0.80 1.25 point estimate 1.04 90% CI 1.04 (0.91 – 1.20)
46.
46 © 2017 USP Solubility,
Dissolution and Permeability are the 3 major factors controlling the oral absorption of drug substances from IR oral medicinal products BIOPHARMACEUTICS CLASSIFICATION SYSTEM (BCS) solubility dissolution permeability
47.
47 © 2017 USP
Final guidance in December 2017* Three major factors for Immediate Release (IR) dosage forms: – Dissolution: Very rapid dissolution when 85% or more dissolves within 15 minutes – Solubility: Highly soluble when highest strength is soluble in 250 mL or less of aqueous media, pH 1-4 at 37C – intestinal permeability: High permeability when 85% or more is absorbed compared to IV (bioavailability) • Mass balance studies, • Absolute BA studies, • Intestinal permeability methods; • FDA identified markers (0-85%+) Bioequivalence Review BCS-Update and Basics: IR products https://www.fda.gov/downloads/Drugs/GuidanceComplianceRegulatoryInformation/Guidances/UCM070246.pdf
48.
48 © 2017 USP
Class 1: High solubility—high permeability – Waived if inactive do not affect Class 2: Low solubility-high permeability: – Not waived Class 3: High solubility—Low permeability – Waived if same inactive chemical and same quantity (within a range) Class 4: Low Solubility—Low Permeability – Not waived Narrow therapeutic index or absorbed in oral cavity: Not waived Bioequivalence Review BCS Classes: IR products Amidon et al.: A theoretical basis for a biopharmaceutic drug classification: the correlation of in vitro drug product dissolution and in vivo bioavailability. Pharm. Res. 12: 413-420, 1995.
49.
Good Laboratory Practice CFR
21 Part 58
50.
50 © 2017 USP GLP
is a formal regulation that was created by the FDA (United states food and drug administration) in 1978. Although GLP originated in the United States, it had a world wide impact. Non-US companies that wanted to do business with the United states or register their pharmacies in the United States had to comply with the United States GLP regulations. They eventually started making GLP regulations in their home countries. In 1981 an organization named OECD (organization for economic co-operation and development ) produced GLP principles that are international standard. HISTORY
51.
51 © 2017 USP WHY
WAS GLP CREATED? In the early 70’s FDA became aware of cases of poor laboratory practice all over the United States. FDA decided to do an in-depth investigation on 40 toxicology labs. They discovered a lot fraudulent activities and a lot of poor lab practices. Examples of some of these poor lab practices found were 1. Equipment not been calibrated to standard form , therefore giving wrong measurements. 2. Incorrect/inaccurate accounts of the actual lab study 3. Inadequate test systems
52.
52 © 2017 USP
Describes good practices for non-clinical lab studies that support research or marketing approvals for FDA-regulated products GLP What It Is
53.
53 © 2017 USP Appropriately
qualified personnel Adequate resources Appropriate procedures for: – Sanitation, health precautions, clothing – Test protocol development, test methods – Data analysis, report development Appropriately qualified study director Quality assurance function GLP General Requirements
54.
54 © 2017 USP Suitable
size, construction, segregation – Animal care – Animal supplies – Test & control products maintained in a secure area – Operating “suite” – Specimen & data storage GLP Facilities Requirements
55.
55 © 2017 USP Appropriately
designed Adequate thru-put capacity Appropriately located Routinely maintained & calibrated GLP Equipment Requirements
56.
56 © 2017 USP Animal
room prep Animal care Receipt, ID, storage, handling, mixing & sampling of test & control articles Test system observations Lab tests Handling of moribund or dead animals Necropsy or postmortem exams of animals GLP Standard Operating Procedures
57.
57 © 2017 USP Collection
& ID of specimens Histopathology Data handling, storage & retrieval Equipment maintenance & calibration Transfer, proper placement & ID of animals GLP Standard Operating Procedures
58.
58 © 2017 USP Adequate
labeling – Identity – Concentration – Storage requirements – Expiration date GLP Reagents & Solutions
59.
59 © 2017 USP Adequate
characterization Proper receipt, storage, distribution When mixed with a carrier, adequate methods to confirm – Mixture uniformity – Article concentration – Article stability GLP Test & Control Articles
60.
60 © 2017 USP Written,
approved protocol indicating test objectives and methods Study conducted in accordance with protocol Study monitoring to confirm protocol compliance Appropriate labeling of specimens by test system, study, nature and collection date Records of gross findings from postmortems available to pathologist for specimen histopathology GLP Study Implementation
61.
61 © 2017 USP Standard
data capture/recording requirements – Legibility – Permanence – Accountability – Changes GLP Study Implementation
62.
62 © 2017 USP Final
report of results Study records & data methodically archived to facilitate expedient retrieval – Study documents – Raw data – Specimens – Protocols – QA inspections – Personnel training & qualifications – Calibration & maintenance records GLP Records & Reports
63.
63 © 2017 USP Records
retention (shortest of): – ≥ 2 yr after FDA marketing clearance – ≥ 5 yr after data submitted to FDA in support of marketing application – ≥ 2 yr after Sponsor decision not to proceed with marketing application – Wet specimens hold as long as viable Records transferable with written FDA notification GLP Records & Reports
64.
64 © 2017 USP Grounds
for disqualification: – Failure to comply with regulations – Noncompliance adversely affects study validity – Previous regulatory actions have been unsuccessful in modifying facility operations GLP Facility Disqualification
65.
65 © 2017 USP Basic
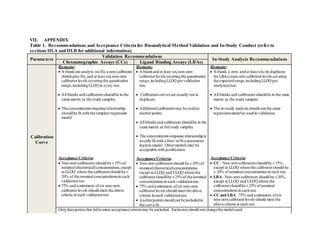
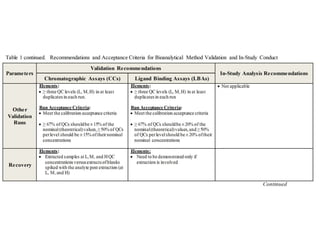
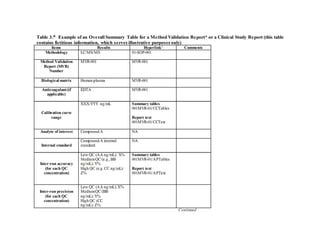
Requirements: FDA Guidance Finalized May 2018 https://www.fda.gov/downloads/Drugs/Guidance/ucm070107.pdf Bioanalytical Methods Quantitative measurement in a biological matrix (blood, plasma, serum or urine): Accuracy, Precision, Selectivity, Sensitivity, Reproducibility, Stability Written SOP to include record keeping, security and chain of sample custody, sample preparation, analytical tools, reagents, equipment, instrumentation, QC procedures and result verification. 21 CRR Part 11 recommended. Adhere to FDA's Good Laboratory Practices (GLPs) requirements7 (21 CFR 135 Part 58). The bioanalytical must meet the criteria specified in 21 CFR 320.29. Method validation experiments should include a minimum of six runs conducted over several days, with at least four concentrations (including LLOQ, low, medium, and high) analyzed in duplicate in each run.
66.
66 © 2017 USP –
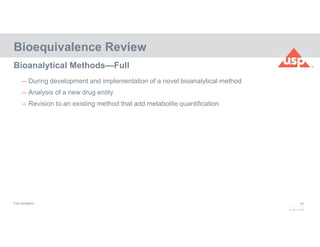
During development and implementation of a novel bioanalytical method – Analysis of a new drug entity – Revision to an existing method that add metabolite quantification Bioequivalence Review Bioanalytical Methods—Full Full validation
67.
67 © 2017 USP
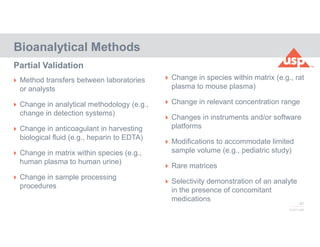
Method transfers between laboratories or analysts Change in analytical methodology (e.g., change in detection systems) Change in anticoagulant in harvesting biological fluid (e.g., heparin to EDTA) Change in matrix within species (e.g., human plasma to human urine) Change in sample processing procedures Partial Validation Bioanalytical Methods Change in species within matrix (e.g., rat plasma to mouse plasma) Change in relevant concentration range Changes in instruments and/or software platforms Modifications to accommodate limited sample volume (e.g., pediatric study) Rare matrices Selectivity demonstration of an analyte in the presence of concomitant medications
68.
68 © 2017 USP
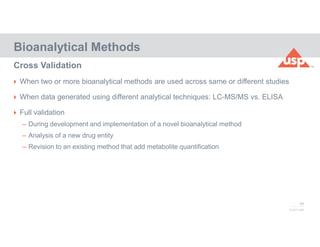
When two or more bioanalytical methods are used across same or different studies When data generated using different analytical techniques: LC-MS/MS vs. ELISA Full validation – During development and implementation of a novel bioanalytical method – Analysis of a new drug entity – Revision to an existing method that add metabolite quantification Bioanalytical Methods Cross Validation
69.
69 © 2017 USP
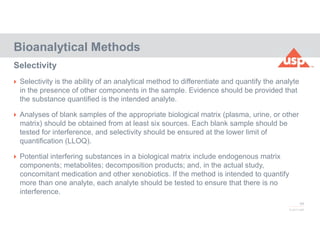
Selectivity is the ability of an analytical method to differentiate and quantify the analyte in the presence of other components in the sample. Evidence should be provided that the substance quantified is the intended analyte. Analyses of blank samples of the appropriate biological matrix (plasma, urine, or other matrix) should be obtained from at least six sources. Each blank sample should be tested for interference, and selectivity should be ensured at the lower limit of quantification (LLOQ). Potential interfering substances in a biological matrix include endogenous matrix components; metabolites; decomposition products; and, in the actual study, concomitant medication and other xenobiotics. If the method is intended to quantify more than one analyte, each analyte should be tested to ensure that there is no interference. Bioanalytical Methods Selectivity
70.
70 © 2017 USP
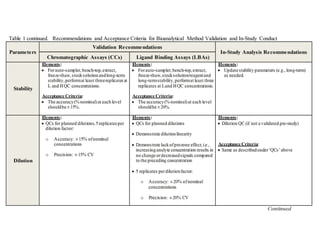
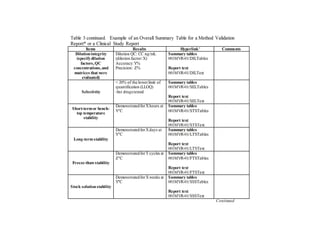
Closeness of mean test results obtained by the method to the actual value (concentration) of the analyte. Determined by replicate analysis of samples containing known amounts of the analyte (i.e., QCs). Measured using a minimum of five determinations per concentration. A minimum of three concentrations in the range of expected study sample concentrations is recommended. The mean value should be within 15% of the nominal value except at LLOQ, where it should not deviate by more than 20%. The deviation of the mean from the nominal value serves as the measure of accuracy. Bioanalytical Methods Accuracy
71.
71 © 2017 USP
Closeness of individual measures of an analyte when the procedure is applied repeatedly to multiple aliquots of a single homogeneous volume of biological matrix. Measured using a minimum of five determinations per concentration.; minimum of three concentrations in the range of expected study sample concentrations is recommended. Precision at each concentration level should not exceed 15% of the coefficient of variation (CV) except for the LLOQ, where it should not exceed 20% of the CV. Within-run precision (intra-batch precision or within-run repeatability) is an assessment of precision during a single analytical run. Between-run precision (inter-batch precision or between-run repeatability) is an assessment of precision over time and may involve different analysts, equipment, reagents, and laboratories. Bioanalytical Methods Precision
72.
72 © 2017 USP
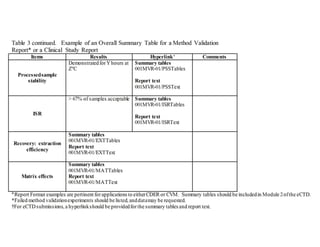
Sample concentrations above the upper limit of the standard curve should be diluted. The accuracy and precision of these diluted samples should be demonstrated in the method validation. The recovery of an analyte in an assay is the detector response obtained from an amount of the analyte added to and extracted from the biological matrix, compared to the detector response obtained for the true concentration of the analyte in solvent. Recovery pertains to the extraction efficiency of an analytical method within the limits of variability. Recovery of the analyte need not be 100%, but the extent of recovery of an analyte and of the internal standard should be consistent, precise, and reproducible. Recovery experiments should be performed by comparing the analytical results for extracted samples at three concentrations (low, medium, and high) with unextracted standards that represent 100% recovery. Bioanalytical Methods Recovery
73.
73 © 2017 USP
Relationship between instrument response and known concentrations of the analyte— should continuous and reproducible. A calibration curve should be generated for each analyte in the sample in the same biological matrix as the samples in the intended study by spiking the matrix with known concentrations of the analyte. The calibration standards can contain more than one analyte; concentrations of standards should be chosen on the basis of the concentration range expected. – Matrices may be difficult to obtain (e.g., cerebrospinal fluid)—use surrogate matrices. – Blank sample (matrix sample processed without analyte or internal standard), a zero sample (matrix sample processed without analyte but with internal standard), and at least six non- zero samples (matrix samples processed with analyte and internal standard) covering the expected range, including LLOQ. . Bioanalytical Methods Calibration
74.
74 © 2017 USP
Calibration standards and QC samples spiked with reference standard. Identity and purity of RS confirmed. Should be same as analyte—otherwise an established chemical form (free base, acid or salt, or ester. Certified standards (e.g., USP; commercially supplied; other substances Internal standard Discard solutions beyond expiry unless purity established Bioanalytical Methods Reference Standards
75.
75 © 2017 USP
LLOQ: response at least 5x the blank; analyte peak identified and secrete and reproducible, precision not exceeding 20% of CV and accuracy within 20% of nominal concentration. [LLOQ is NOT limit of detection] – Established using at least 5 samples and determining the CV and/or appropriate confidence interval ULOQ: analyte peak should be reproducible and back calculated concentration precision not to exceed 15% of the CV and accuracy within 15% of nominal concentration Standard/calibrator should not deviate more than 20%; standard curve at least 75% of non-zero standards meet this criteria QC samples: at least 3 concentrations in duplicate in each run, one three times the LLOQ, one mid-range and one high end. Bioanalytical Methods Limits
76.
76 © 2017 USP
QCs provide basis of accepting or rejecting – At least 67% should be within 15% – At least 50% of QCs within 15% of their nominal concentration; or use CI approach – Minimum number of QCs be at least 5% of the number of unknown sample or six total whichever is greater. Calibration standard and QCs prepared from separate stock solutions but can be same spiking solution, if stability verified. A single source of blank matrix provided absence of matrix effect. At least one demonstration of precision and accuracy of calibrators and QCs prepared from separate stock solution is expected. Bioanalytical Methods Limits
77.
77 © 2017 USP
Sensitivity, lowest concentration with acceptance accuracy and precision: LLOQ Reproducibility: Replicate measurements using the assay, including QCs and possibly incurred samples; reinjection reproducibility evaluated if instrument interruption. Stability: pre-study stability for sample handling times and storage conditions during study conduct; data specific to matrix and container system—do not extrapolate. Analyte stability in stock solution; freeze-thaw stability, bench=top stability, long-term stability, stock solution stability; stability during processing (e.g., in autosampler) Bioanalytical Methods Sensitivity, Reproducibility, Stability
78.
78 © 2017 USP
System suitability using spiked samples independent of calibrators QCs or study samples Calibration curves and QCs in all analytical runs. Response function determined by statistical tests based on actual standard points QCs used to accept or reject and also if calibration standards fall outside range Repeat analysis SOP most important Sample Data Reintegration: SOP established a priori; audits maintained and original and reintegration data reported. Bioanalytical Methods Use, Data Analysis and Reporting
79.
79 © 2017 USP
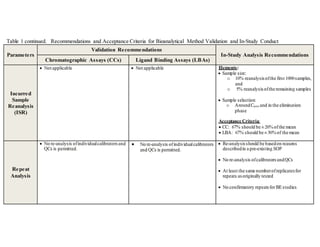
Reliability of the reported subject sample analyte concentration; required for BE studies; for non-clinical conduct ISR once a month for each method and each species. Repeat analysis of a subset of subject samples in separate runs on different days— supporting precision and accuracy with spiked QCs. Compared to freshly prepared calibrators; total ISR sample 7% of the study sample size; samples to include around Cmax and in elimination phase 67% of repeat results be within 20% for small molecule and 30% for large molecules. Percentage difference determined by (Repeat-Original)*100/ Mean Bioanalytical Methods Incurred Sample Reanalysis
80.
80 © 2017 USP
Most requirements for chromatography Labeled analytes: binding reoptimized, performance verified with standard curves and QCs Antibodies: key cross-reactivities checked; tracer experiment repeated. Matrices: tracer experiments repeated Bioanalytical Methods Ligand Binding Assays
81.
81 © 2017 USP
Distinguishing between endogenous and therapeutic Biological matrix for calibration standards same as study sample without endogenous Alternate matrices not recommended unless analyte-free matrix not available QCs prepared by spiking known quantity of analyte in the same biological matrix as study samples; endogenous concentrate measured prior to QC preparation (e.g., by replicate analysis). Concentration for the QCs account for endogenous in biological matrix and representative of study concentration. Bioanalytical Methods Endogenous Compounds
82.
82 © 2017 USP
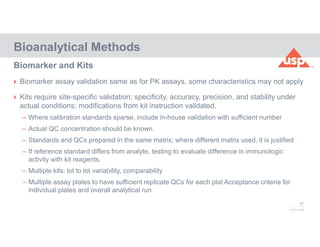
Biomarker assay validation same as for PK assays, some characteristics may not apply Kits require site-specific validation; specificity, accuracy, precision, and stability under actual conditions; modifications from kit instruction validated. – Where calibration standards sparse, include in-house validation with sufficient number – Actual QC concentration should be known. – Standards and QCs prepared in the same matrix; where different matrix used, it is justified – If reference standard differs from analyte, testing to evaluate difference in immunologic activity with kit reagents. – Multiple kits: lot to lot variability, comparability – Multiple assay plates to have sufficient replicate QCs for each plat Acceptance criteria for individual plates and overall analytical run Bioanalytical Methods Biomarker and Kits
83.
83 © 2017 USP
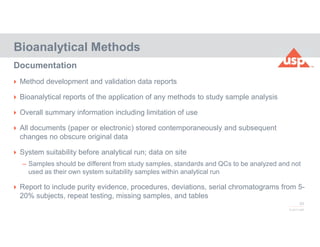
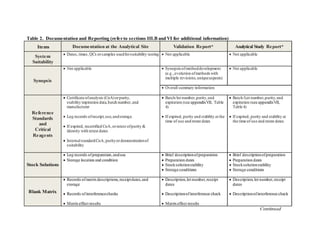
Method development and validation data reports Bioanalytical reports of the application of any methods to study sample analysis Overall summary information including limitation of use All documents (paper or electronic) stored contemporaneously and subsequent changes no obscure original data System suitability before analytical run; data on site – Samples should be different from study samples, standards and QCs to be analyzed and not used as their own system suitability samples within analytical run Report to include purity evidence, procedures, deviations, serial chromatograms from 5- 20% subjects, repeat testing, missing samples, and tables Bioanalytical Methods Documentation
84.
84 © 2017 USP
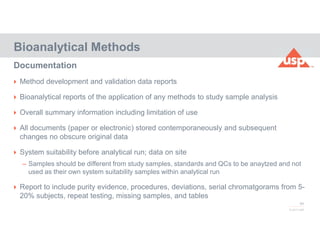
Method development and validation data reports Bioanalytical reports of the application of any methods to study sample analysis Overall summary information including limitation of use All documents (paper or electronic) stored contemporaneously and subsequent changes no obscure original data System suitability before analytical run; data on site – Samples should be different from study samples, standards and QCs to be anaytzed and not used as their own system suitability samples within analytical run Report to include purity evidence, procedures, deviations, serial chromatgorams from 5- 20% subjects, repeat testing, missing samples, and tables Bioanalytical Methods Documentation