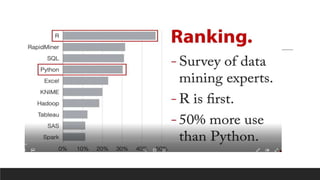
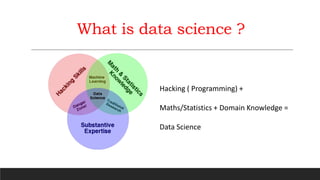
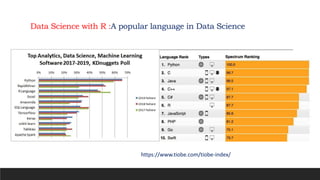
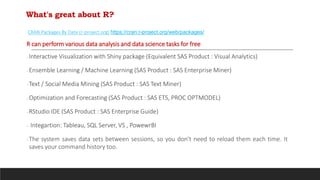
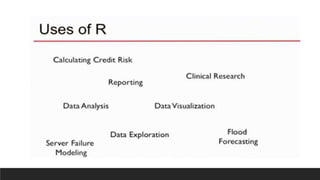
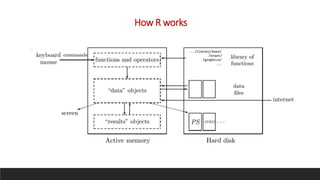
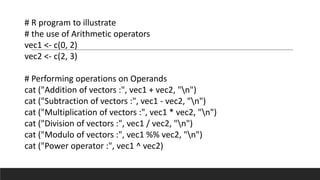
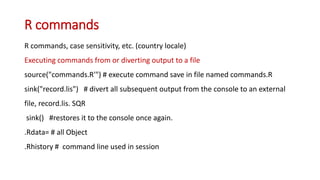
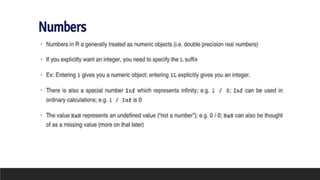
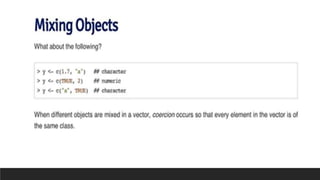
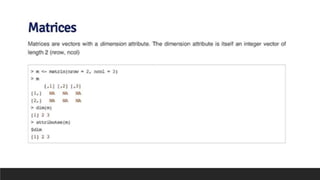
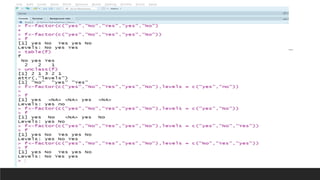
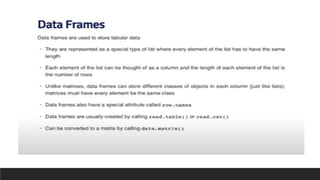
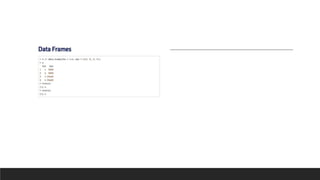
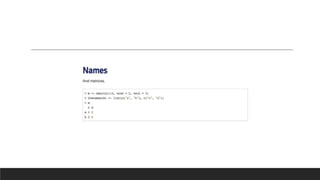
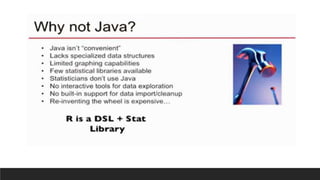
R can perform various data analysis and data science tasks for free through its extensive packages and community support. It is an open-source statistical programming language that is widely used for data manipulation, visualization, and machine learning. Some key features of R include its ability to perform interactive visualization, ensemble learning, text/social media mining, and integration with other languages and technologies like SQL, Python, and Tableau. While powerful, R does have some limitations like a steep learning curve and slower execution compared to other languages.


![It connects with other languages: R package foreign
http://cran.rproject.org/web/packages/foreign/index.html SPSS, SAS, Stata.
RODBC, ROracle
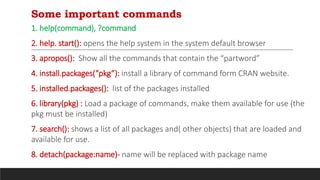
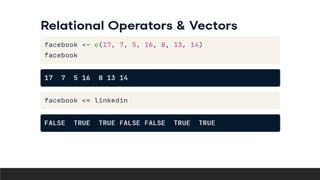
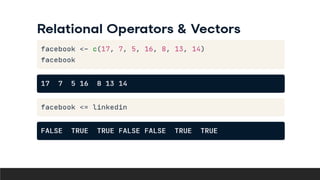
Unique Features: Performing multiple
calculations with vectors: R is Vector
based language
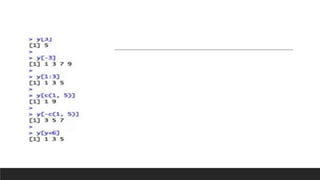
Ex: x<- 1:5
Call x
> x [1] 1 2 3 4 5
> x+2
> x+ 6:10 ( Two Vector)
Processing more than just statistics :
data processing, graphic visualization,
and analysis of all sort
Running code without a compiler-
Development cycle easy- downside of
interptreted language –slow
Object oriented and Functional
Programming](https://image.slidesharecdn.com/rl1-aug-2022-221118094009-8f7ee785/85/R_L1-Aug-2022-pptx-30-320.jpg)
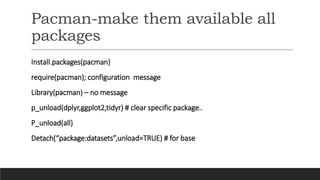


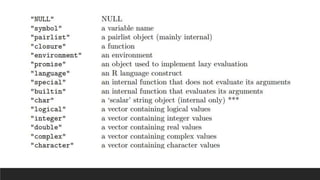
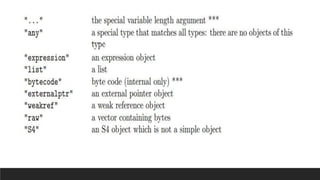
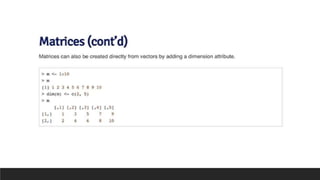
![Entering Input
• At the R prompt we type expression.
> x<-1
Print(x) S<-rep(obj,times=10)
[1] 1 seq(length=100,from=4 by=1)
> msg<- “Welcome”
The grammar of the language determine whether an expression is
complete or not. > X<- # incomplete expression](https://image.slidesharecdn.com/rl1-aug-2022-221118094009-8f7ee785/85/R_L1-Aug-2022-pptx-63-320.jpg)
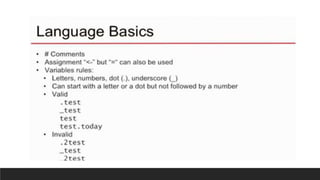
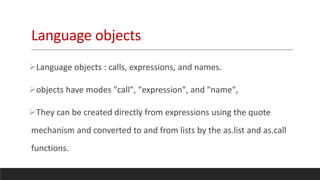
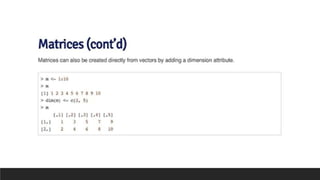
![properties of an object are usually provided by attributes(object)
As.character(_) As.complex(object)
Empty object
emp-obje<-character()
emp_obj[6]<-57
Changing the length of an object](https://image.slidesharecdn.com/rl1-aug-2022-221118094009-8f7ee785/85/R_L1-Aug-2022-pptx-67-320.jpg)


![[DSC Europe 25] Andrzej Kowalczyk - AI - how to start small and grow in the f...](https://cdn.slidesharecdn.com/ss_thumbnails/oy1zmo94qv6vpcqjvno2-andrzej-kowalczyk-ai-how-to-start-small-and-grow-in-the-future-1-260119121559-cf093b23-thumbnail.jpg?width=640&height=640&fit=bounds)


![[DSC Europe 25] Paula Garcia Esteban -Building the Future: The Role of Data S...](https://cdn.slidesharecdn.com/ss_thumbnails/9ld1r1bsqpwve8qfvphy-paula-garcia-esteban-building-the-future-260122103838-4171f5cb-thumbnail.jpg?width=640&height=640&fit=bounds)


![[DSC Europe 25] Egor Krasheninnikov - The Control Stack: Building Guardrails ...](https://cdn.slidesharecdn.com/ss_thumbnails/3lzcz7hxqmo51mtalv4u-the-control-stack-260119101520-ea90841a-thumbnail.jpg?width=640&height=640&fit=bounds)
![[DSC Europe 25] Tali Fulman - Guild Meetings, Then What? Building Data Commun...](https://cdn.slidesharecdn.com/ss_thumbnails/fgohhi33rwmhqdowdj5k-tali-fulman-guild-meetings-then-what-building-data-communities-that-actually-ch-260120105855-528492c3-thumbnail.jpg?width=640&height=640&fit=bounds)


![[DSC Europe 25] Dubravko Culibrk - Deep Learning for Mammography.pptx](https://cdn.slidesharecdn.com/ss_thumbnails/yiscimuktacgqoiu4dkp-deep-learning-for-mammography-260119121559-aad59182-thumbnail.jpg?width=640&height=640&fit=bounds)
![[DSC Europe 25] Bojan Banjac - AI is always right when it comes to the matter...](https://cdn.slidesharecdn.com/ss_thumbnails/syoxtqierpydwxm5srcb-4-bojan-banjac-ai-is-always-right-when-it-comes-to-the-matters-of-taste-260119101519-694ee7d7-thumbnail.jpg?width=640&height=640&fit=bounds)
![[DSC Europe 25] Josip Saban - Career building for data professionals.pptx](https://cdn.slidesharecdn.com/ss_thumbnails/zroflcttkm1vmli0txea-josip-saban-career-building-for-data-professionals-260123083019-587cdb8c-thumbnail.jpg?width=640&height=640&fit=bounds)


