Download to read offline

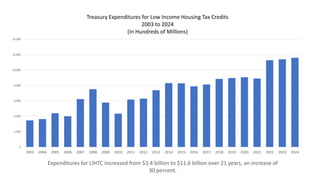
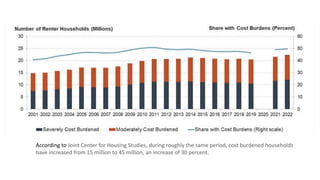
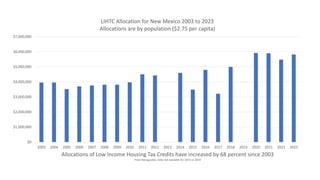

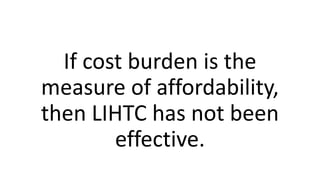
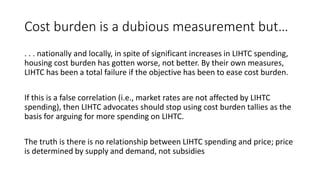
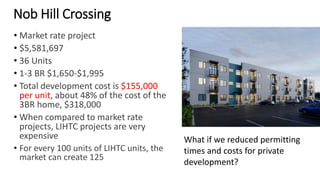
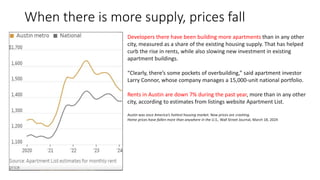

The document analyzes the effectiveness of the Low Income Housing Tax Credit (LIHTC) over the past two decades, highlighting a significant increase in expenditures but a simultaneous rise in cost-burdened households, suggesting that LIHTC has not successfully alleviated housing affordability issues. Data indicates that despite increased funding and allocations, many households remain overburdened by housing costs, challenging the argument for further LIHTC spending. The document calls into question the correlation between LIHTC spending and housing prices, implying that market forces of supply and demand play a more critical role in determining housing costs.


![Hacking-Uncovered-How-People-Get-Hacked-and-How-to-Stay-Safe[1].pptx](https://cdn.slidesharecdn.com/ss_thumbnails/hacking-uncovered-how-people-get-hacked-and-how-to-stay-safe1-260130170011-4883a9c7-thumbnail.jpg?width=640&height=640&fit=bounds)

![제 23회 보아즈(BOAZ) 빅데이터 컨퍼런스 - [MBOAX] : ABSA를 활용한 소비자 반응 분석 기반 운영 효율화 대시보드 설계](https://cdn.slidesharecdn.com/ss_thumbnails/3-1boaz23rdconferencemboax-260203102709-9d519923-thumbnail.jpg?width=640&height=640&fit=bounds)


