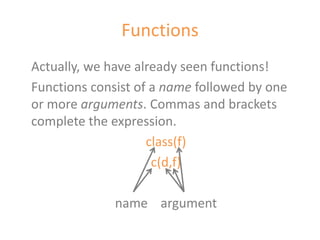
Getting started with RJacob van Etten
What is R?“R is a free software environment for statistical computing and graphics.”www.r-project.org
Why R?R takes time to learn and use.So why should I bother?There are more user-friendly programmes, right?
12 reasons to learn R1. Rigour and strategy in data analysis – not “thinking after clicking”.2. Automatizing repeated calculations can save time in the end.3. A lot of stuff is simply not feasible in menu driven software.
12 reasons to learn R4. R is not only about software, it is also an online community of user support and collaboration.5. Scripts make it easy to communicate about your problem. Important for collaborative research!6. Research becomes replicable when scripts are published.
12 reasons to learn R7. R packages represent state-of-the-art in many academic fields. 8. Graphics in R are very good.9. R stimulates learning – graduation from user to developer.
12 reasons to learn R10. R is free, which saves you money. Or R may be the only option when budgets are restricted.11. R encourages to freely explore new methods and learn about them.12. Knowing to work with R is a valuable and transferable skill.
It’s the long way but it’s worth it...
Resources to learn R My two picks for youhttp://pj.freefaculty.org/R/Rtips.html
Some R packages of interestRNCEP – Reanalysis dataclim.pact– Downscaling climate dataGhcnDaily – dailyweather dataweatherData(R-Forge) – Daily weather data and derived bioclimatic variables relevant to plant growthraster – gives access to WorldClim data
And a lot more here...http://cran.r-project.org/other-docs.html
Downloading R
Choose a mirror nearby and then...Binaries“When downloading, a completely functional program without any installer is also often called program binary, or binaries (as opposed to the source code).”(Wikipedia)
And finally,you can download R...When downloading has finished, run the installer
The bare R interface
RStudio makes life easierRstudio.org
Four partsCreate a new R script: File – New – R ScriptScripts, documentationWorkspace/historyFiles, plots, packages and helpConsole
Our first code...Type1 + 1into the script area.Then click “Run”.What happens?
Exercises: running codeType a second line with another calculation (use “-”, “/”, or “*”) and click “Run” again.Select only one line with the mouse or Shift + arrows. Then click “Run”.Save your first code to a separate folder “Rexercises”.
Following exercisesIn the next exercises, we will develop a script.Just copy every new line and add it to your script, without erasing the previous part.If you want to make a comment in your script, put a # before that line. Like this:#important to remember: use # to comment
If the exercises are a bit silly......that’s because you are learning.
VectorType a new line with the expression1:10in the script and run this line.A concatenation of values is called a  vector.
Making a new variableIf we send 1:10 into the console it will only print the outcome. To “store” this vector, we need to do the following.a <- 1:10new variable “a”      assign       vector values 1 to 10
Operations with vectorsTry the following and see what happens.aa * 2a * ab <- a * abprint(b)
Other ways of making vectorsd <- c(1, 6, 9)dclass(d)f <- LETTERSfclass(f)What is the difference between d and f?
FunctionsActually, we have already seen functions!Functions consist of a name followed by one or more arguments. Commas and brackets complete the expression.class(f)c(d,f)name    argument
Cheat sheetWhen you use R, you will become familiar with the most common functions.If you need a less common function, there are ways to discover the right one.For now, use the cheat sheet to look up the functions you need.
Getting help on functionsThis will open help pages for the functions in your browser.?c?classEspecially the examples are often helpful. Just copy and paste the code into the console and see with your own eyes what happens!
MatricesWe have already met the vector.If we put two or more vector together as columns, we get a matrix.X <- c(1,2,3)Y <- c(8,9,7)Z <- c(4,2,8)M <- cbind(X, Y, Z)How many columns and rows does M have?
Data framesMatrices must consist of values of the same class. But often datasets consist of a mix of different types of variables (real numbers and groups). This is the job of data frames.L <- c(“a”, “b”, “c”)Df <- data.frame(X,Y,Z,L)Visualize Df like this: str(Df)What would happen if you tried to make a matrix out of these same vectors instead? Try and see.
Getting data into R?read.csvCSV files are a relatively trouble-free way of getting data into R.It is a fairly common format.You can make a CSV file in any spreadsheet software.
Create a CSV fileAdd your own favorite actor, too.Open the file with Notepad. Make sure the values are separated by commas.
Now use R to read itNow read it into R.actors <- read.csv(yourfile.csv)str(actors)
SubsettingThere are many ways of selecting only part of a data frame. Observe carefully what happens.actors[1:2,]actors[,1:2]actors[“Age”]actors[c(“Name”, “Age”)]subset(actors, Age> 40)Now create a new data frame with the actors younger than 45.
GraphicsThe plot function makes graphs.plot(actors[c(“sex”, “Age”)])
SummaryYou now know about:VariablesFunctionsVectorsMatricesData framesGetting tabular data into RSubsettingSimple plotting
Time for your first fight...

Getting started with R

  • 1.
    Getting started withRJacob van Etten
  • 2.
    What is R?“Ris a free software environment for statistical computing and graphics.”www.r-project.org
  • 3.
    Why R?R takestime to learn and use.So why should I bother?There are more user-friendly programmes, right?
  • 4.
    12 reasons tolearn R1. Rigour and strategy in data analysis – not “thinking after clicking”.2. Automatizing repeated calculations can save time in the end.3. A lot of stuff is simply not feasible in menu driven software.
  • 5.
    12 reasons tolearn R4. R is not only about software, it is also an online community of user support and collaboration.5. Scripts make it easy to communicate about your problem. Important for collaborative research!6. Research becomes replicable when scripts are published.
  • 6.
    12 reasons tolearn R7. R packages represent state-of-the-art in many academic fields. 8. Graphics in R are very good.9. R stimulates learning – graduation from user to developer.
  • 7.
    12 reasons tolearn R10. R is free, which saves you money. Or R may be the only option when budgets are restricted.11. R encourages to freely explore new methods and learn about them.12. Knowing to work with R is a valuable and transferable skill.
  • 8.
    It’s the longway but it’s worth it...
  • 9.
    Resources to learnR My two picks for youhttp://pj.freefaculty.org/R/Rtips.html
  • 10.
    Some R packagesof interestRNCEP – Reanalysis dataclim.pact– Downscaling climate dataGhcnDaily – dailyweather dataweatherData(R-Forge) – Daily weather data and derived bioclimatic variables relevant to plant growthraster – gives access to WorldClim data
  • 11.
    And a lotmore here...http://cran.r-project.org/other-docs.html
  • 12.
  • 13.
    Choose a mirrornearby and then...Binaries“When downloading, a completely functional program without any installer is also often called program binary, or binaries (as opposed to the source code).”(Wikipedia)
  • 14.
    And finally,you candownload R...When downloading has finished, run the installer
  • 15.
    The bare Rinterface
  • 16.
    RStudio makes lifeeasierRstudio.org
  • 17.
    Four partsCreate anew R script: File – New – R ScriptScripts, documentationWorkspace/historyFiles, plots, packages and helpConsole
  • 18.
    Our first code...Type1+ 1into the script area.Then click “Run”.What happens?
  • 19.
    Exercises: running codeTypea second line with another calculation (use “-”, “/”, or “*”) and click “Run” again.Select only one line with the mouse or Shift + arrows. Then click “Run”.Save your first code to a separate folder “Rexercises”.
  • 20.
    Following exercisesIn thenext exercises, we will develop a script.Just copy every new line and add it to your script, without erasing the previous part.If you want to make a comment in your script, put a # before that line. Like this:#important to remember: use # to comment
  • 21.
    If the exercisesare a bit silly......that’s because you are learning.
  • 22.
    VectorType a newline with the expression1:10in the script and run this line.A concatenation of values is called a vector.
  • 23.
    Making a newvariableIf we send 1:10 into the console it will only print the outcome. To “store” this vector, we need to do the following.a <- 1:10new variable “a” assign vector values 1 to 10
  • 24.
    Operations with vectorsTrythe following and see what happens.aa * 2a * ab <- a * abprint(b)
  • 25.
    Other ways ofmaking vectorsd <- c(1, 6, 9)dclass(d)f <- LETTERSfclass(f)What is the difference between d and f?
  • 26.
    FunctionsActually, we havealready seen functions!Functions consist of a name followed by one or more arguments. Commas and brackets complete the expression.class(f)c(d,f)name argument
  • 27.
    Cheat sheetWhen youuse R, you will become familiar with the most common functions.If you need a less common function, there are ways to discover the right one.For now, use the cheat sheet to look up the functions you need.
  • 28.
    Getting help onfunctionsThis will open help pages for the functions in your browser.?c?classEspecially the examples are often helpful. Just copy and paste the code into the console and see with your own eyes what happens!
  • 29.
    MatricesWe have alreadymet the vector.If we put two or more vector together as columns, we get a matrix.X <- c(1,2,3)Y <- c(8,9,7)Z <- c(4,2,8)M <- cbind(X, Y, Z)How many columns and rows does M have?
  • 30.
    Data framesMatrices mustconsist of values of the same class. But often datasets consist of a mix of different types of variables (real numbers and groups). This is the job of data frames.L <- c(“a”, “b”, “c”)Df <- data.frame(X,Y,Z,L)Visualize Df like this: str(Df)What would happen if you tried to make a matrix out of these same vectors instead? Try and see.
  • 31.
    Getting data intoR?read.csvCSV files are a relatively trouble-free way of getting data into R.It is a fairly common format.You can make a CSV file in any spreadsheet software.
  • 32.
    Create a CSVfileAdd your own favorite actor, too.Open the file with Notepad. Make sure the values are separated by commas.
  • 33.
    Now use Rto read itNow read it into R.actors <- read.csv(yourfile.csv)str(actors)
  • 34.
    SubsettingThere are manyways of selecting only part of a data frame. Observe carefully what happens.actors[1:2,]actors[,1:2]actors[“Age”]actors[c(“Name”, “Age”)]subset(actors, Age> 40)Now create a new data frame with the actors younger than 45.
  • 35.
    GraphicsThe plot functionmakes graphs.plot(actors[c(“sex”, “Age”)])
  • 36.
    SummaryYou now knowabout:VariablesFunctionsVectorsMatricesData framesGetting tabular data into RSubsettingSimple plotting
  • 37.
    Time for yourfirst fight...