Downloaded 254 times


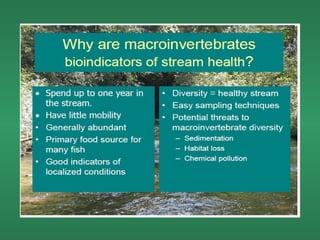
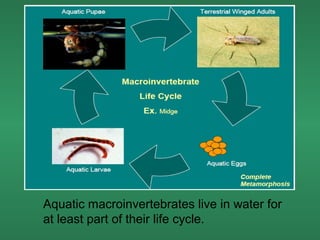
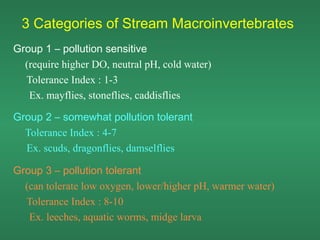
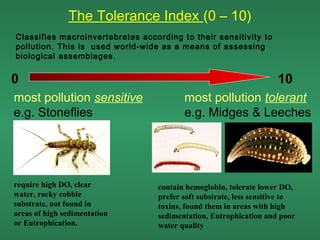
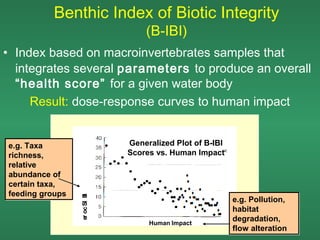
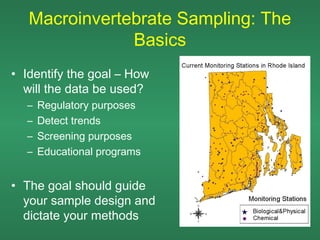
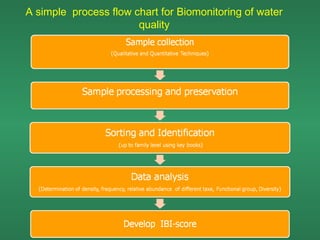
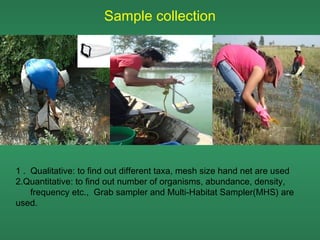
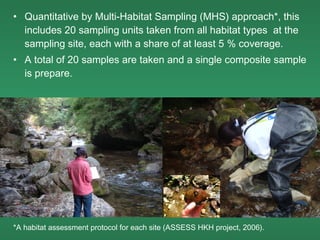
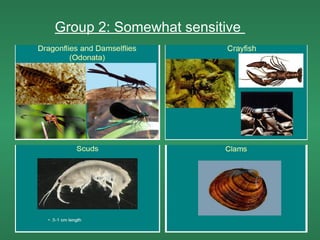
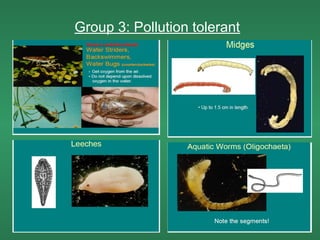


This document discusses using aquatic macroinvertebrates to monitor water quality. It outlines how macroinvertebrates can indicate the health of bodies of water, explains how they are classified by their tolerance to pollution, and describes how to sample, sort, identify, and calculate a Benthic Index of Biotic Integrity score. The sampling process involves collecting macroinvertebrates from different habitats using nets and grab samplers, preserving the samples, sorting and identifying the organisms, and calculating the score to assess the water quality and detect problems.


