Downloaded 805 times

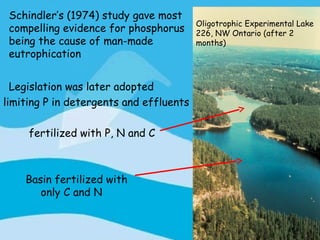
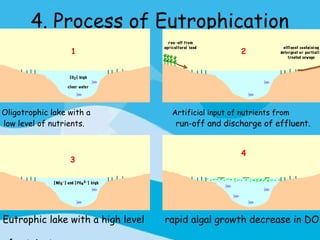
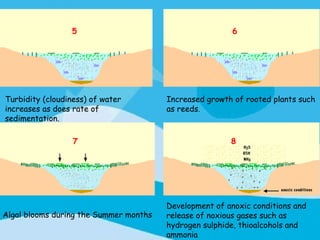
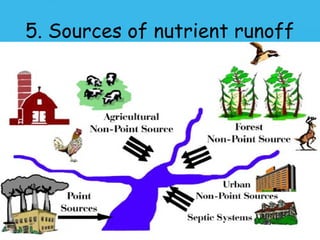
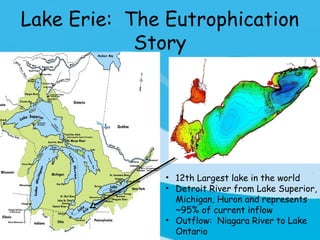
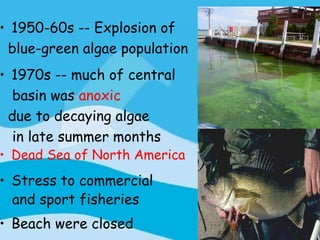
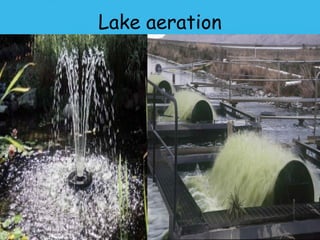


Eutrophication is the process by which a body of water becomes overly enriched with minerals and nutrients which induces excessive growth of algae. This document discusses the history, causes, process, sources, effects and prevention/control of eutrophication. It provides Lake Erie as an example where phosphorus runoff from sewage and agriculture caused severe algal blooms and hypoxia, but $7.5 billion in controls have helped reduce phosphorus levels and improve conditions. Prevention focuses on identifying and controlling nutrient sources, minimizing nonpoint pollution through riparian buffers and laws, and nitrogen testing to optimize fertilizer use. Control methods within lakes include reducing nutrient release from sediments through dredging, harvesting, and aeration.


