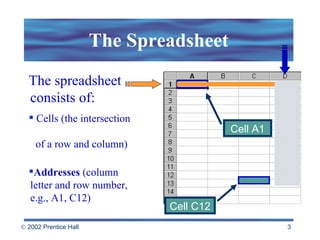
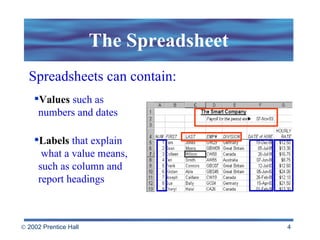
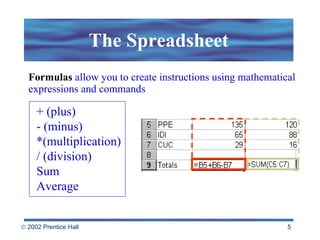
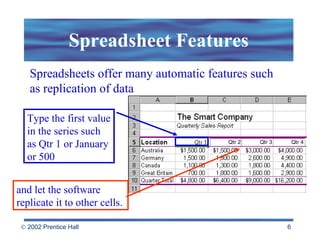
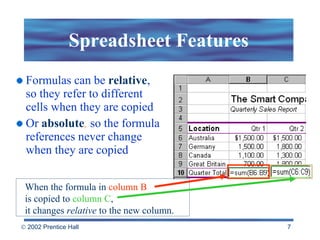
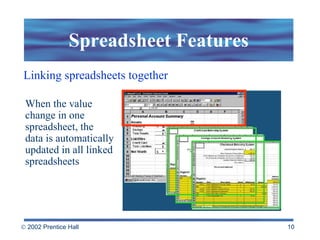
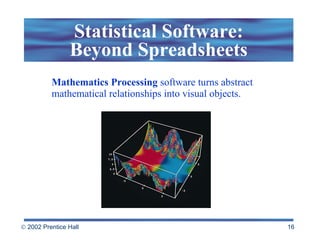
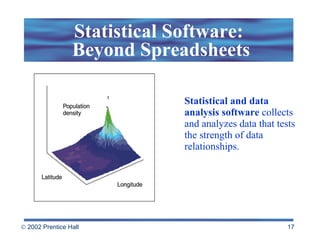
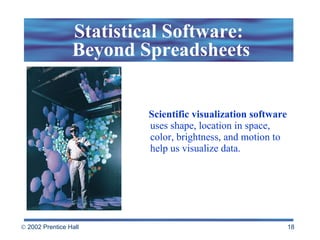
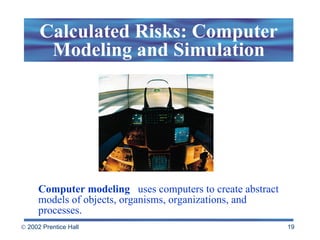
Chapter 6 Calculations, Visualization,  and  Simulation
Topics The Spreadsheet: Software for Simulation and Speculation Statistical Software: Beyond Spreadsheets Statistics and Data Analysis Scientific Visualization Calculated Risks: Computer  Modeling and Simulation “ The purpose of computation is not numbers but insight.” R. W. Hamming..
The Spreadsheet Cell A1 The spreadsheet  consists of: Cells (the intersection    of a row and column) Addresses  (column letter and row number, e.g., A1, C12) Cell C12
The Spreadsheet Spreadsheets can contain: Values  such as  numbers and dates Labels  that explain    what a value means,  such as column and  report headings
The Spreadsheet Formulas  allow you to create instructions using mathematical expressions and commands + (plus) - (minus)  *(multiplication) / (division)  Sum Average
Spreadsheet Features Spreadsheets offer many automatic features such as replication of data and let the software  replicate it to other cells. Type the first value in the series such as Qtr 1 or January or 500
Spreadsheet Features Formulas can be  relative , so they refer to different cells when they are copied Or  absolute ,  so the formula references never change when they are copied When the formula in  column B   is copied to  column C ,  it changes  relative  to the new column.
Spreadsheet Features Automatic recalculation Any time a change is entered into the spreadsheet, all data related to the change automatically updates.
Spreadsheet Features Functions   (e.g., SUM, AVG, SQRT) are used to automate complex calculations Macros  let you store keystrokes and commands so they can be played back automatically Templates  offer ready-to-use worksheets with labels and formulas already entered
Spreadsheet Features Linking spreadsheets together When the value change in one spreadsheet, the  data is automatically updated in all linked spreadsheets
Spreadsheet Features Database capabilities Search for information Sort the data by a specific criteria Merge the data with a word processor Generate reports
Spreadsheets allow you to change numbers and instantly see the effects of those changes. “ What if I enter this value ?” Equation solvers Some spreadsheets generate data needed to fit a given equation and target value. “What If?”
Charts allow you to turn numbers into visual data:  Pie charts (show relative proportions  to the whole) Line charts (show trends or relationships over time) Spreadsheet Graphics:  From Digits to Drawings
Spreadsheet Graphics:  From Digits to Drawings Bar charts  (use if data falls into a few categories) Scatter charts (use to discover, rather than to display, a relationship between two variables)
Accounting  and  Financial   Management  software allows you to do electronically handle routine transactions such as: writing checks balancing accounts creating budgets Statistical Software: Beyond Spreadsheets
Statistical Software: Beyond Spreadsheets Mathematics Processing  software turns abstract mathematical relationships into visual objects.
Statistical Software:  Beyond Spreadsheets Statistical and data analysis software  collects and analyzes data that tests the strength of data relationships.
Statistical Software:  Beyond Spreadsheets Scientific visualization   software  uses shape, location in space, color, brightness, and motion to help us visualize data.
Computer modeling   uses computers to create abstract models of objects, organisms, organizations, and processes. Calculated Risks: Computer Modeling and Simulation
Computer Modeling and Simulation Examples: computer games (chess boards, sports arenas, and mythological societies) computer models of organisms, objects, and organizations flight simulators and  simulations of science lab activities managing a business, city, or nation
Computer Simulations  are widely used for research in the physical, biological, and social sciences, and in engineering. Computer Simulation
Schools, businesses, and the military use simulations for training because: Safety : non-threatening environments Economy : less expensive than real life Projection : less threatening to systems  Visualization : allows to see and understand Replication : allows repetition of projects Computer Modeling  and Simulation
Computer Simulation: The Risks Risks: Simulation isn’t reality. Not all factors can be entered into the model or simulation.
 

Beekman5 std ppt_06

  • 1.
    Chapter 6 Calculations,Visualization, and Simulation
  • 2.
    Topics The Spreadsheet:Software for Simulation and Speculation Statistical Software: Beyond Spreadsheets Statistics and Data Analysis Scientific Visualization Calculated Risks: Computer Modeling and Simulation “ The purpose of computation is not numbers but insight.” R. W. Hamming..
  • 3.
    The Spreadsheet CellA1 The spreadsheet consists of: Cells (the intersection of a row and column) Addresses (column letter and row number, e.g., A1, C12) Cell C12
  • 4.
    The Spreadsheet Spreadsheetscan contain: Values such as numbers and dates Labels that explain what a value means, such as column and report headings
  • 5.
    The Spreadsheet Formulas allow you to create instructions using mathematical expressions and commands + (plus) - (minus) *(multiplication) / (division) Sum Average
  • 6.
    Spreadsheet Features Spreadsheetsoffer many automatic features such as replication of data and let the software replicate it to other cells. Type the first value in the series such as Qtr 1 or January or 500
  • 7.
    Spreadsheet Features Formulascan be relative , so they refer to different cells when they are copied Or absolute , so the formula references never change when they are copied When the formula in column B is copied to column C , it changes relative to the new column.
  • 8.
    Spreadsheet Features Automaticrecalculation Any time a change is entered into the spreadsheet, all data related to the change automatically updates.
  • 9.
    Spreadsheet Features Functions (e.g., SUM, AVG, SQRT) are used to automate complex calculations Macros let you store keystrokes and commands so they can be played back automatically Templates offer ready-to-use worksheets with labels and formulas already entered
  • 10.
    Spreadsheet Features Linkingspreadsheets together When the value change in one spreadsheet, the data is automatically updated in all linked spreadsheets
  • 11.
    Spreadsheet Features Databasecapabilities Search for information Sort the data by a specific criteria Merge the data with a word processor Generate reports
  • 12.
    Spreadsheets allow youto change numbers and instantly see the effects of those changes. “ What if I enter this value ?” Equation solvers Some spreadsheets generate data needed to fit a given equation and target value. “What If?”
  • 13.
    Charts allow youto turn numbers into visual data: Pie charts (show relative proportions to the whole) Line charts (show trends or relationships over time) Spreadsheet Graphics: From Digits to Drawings
  • 14.
    Spreadsheet Graphics: From Digits to Drawings Bar charts (use if data falls into a few categories) Scatter charts (use to discover, rather than to display, a relationship between two variables)
  • 15.
    Accounting and Financial Management software allows you to do electronically handle routine transactions such as: writing checks balancing accounts creating budgets Statistical Software: Beyond Spreadsheets
  • 16.
    Statistical Software: BeyondSpreadsheets Mathematics Processing software turns abstract mathematical relationships into visual objects.
  • 17.
    Statistical Software: Beyond Spreadsheets Statistical and data analysis software collects and analyzes data that tests the strength of data relationships.
  • 18.
    Statistical Software: Beyond Spreadsheets Scientific visualization software uses shape, location in space, color, brightness, and motion to help us visualize data.
  • 19.
    Computer modeling uses computers to create abstract models of objects, organisms, organizations, and processes. Calculated Risks: Computer Modeling and Simulation
  • 20.
    Computer Modeling andSimulation Examples: computer games (chess boards, sports arenas, and mythological societies) computer models of organisms, objects, and organizations flight simulators and simulations of science lab activities managing a business, city, or nation
  • 21.
    Computer Simulations are widely used for research in the physical, biological, and social sciences, and in engineering. Computer Simulation
  • 22.
    Schools, businesses, andthe military use simulations for training because: Safety : non-threatening environments Economy : less expensive than real life Projection : less threatening to systems Visualization : allows to see and understand Replication : allows repetition of projects Computer Modeling and Simulation
  • 23.
    Computer Simulation: TheRisks Risks: Simulation isn’t reality. Not all factors can be entered into the model or simulation.
  • 24.