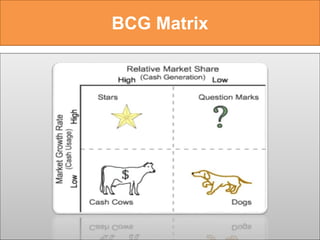
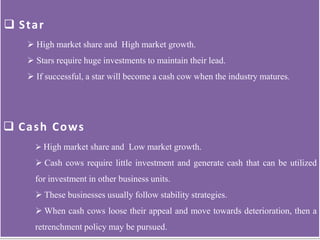
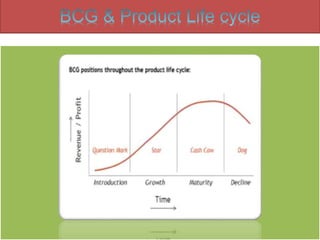
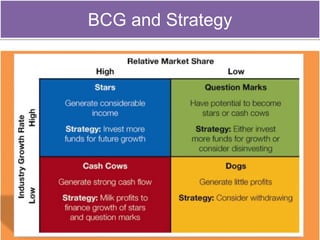
BCG MATRIX
BY:
NEHA SINGH
INTRODUCTION
• It was developed in early 1970.
• Boston Consulting Group (BCG) Matrix is a four celled matrix (2*2
matrix) developed by BCG, USA.
• It is the most renowned corporate portfolio analysis tool.
• It provides a graphic representation for an organization to examine
different businesses in it’s portfolio on the basis of their related market
share and industry growth rates.
• It is a two dimensional analysis on management of SBU’s (Strategic
Business Units).
• It is a comparative analysis of business potential and the evaluation of
environment.
• According to this matrix, business could be classified as high or low
according to their industry growth rate and relative market share.
Relative Market Share = SBU Sales this year - leading competitors sales this
year.
Market Growth Rate = Industry sales this year - Industry Sales last year.
BCG Matrix
 High market share and High market growth.
 Stars require huge investments to maintain their lead.
 If successful, a star will become a cash cow when the industry matures.
 Star
 Cash Cows
 High market share and Low market growth.
 Cash cows require little investment and generate cash that can be utilized
for investment in other business units.
 These businesses usually follow stability strategies.
 When cash cows loose their appeal and move towards deterioration, then a
retrenchment policy may be pursued.
 Question Marks
 Low market share and High market growth.
 They require huge amount of cash to maintain or gain market share. Most
businesses start as question marks as the company tries to enter a high
growth market in which there is already a market-share.
 If ignored, then question marks may become dogs, while if huge
investment is made, then they have potential of becoming stars.
 Dog
 Low market share and Low market growth.
 Retrenchment strategies are adopted because these firms can gain market
share only at the expense of competitor’s/rival firms.
BCG and Strategy
Limitations of BCG Matrix
• BCG matrix classifies businesses as low and high, but generally businesses can be
medium also. Thus, the true nature of business may not be reflected.
• Market is not clearly defined in this model.
• High market share does not always leads to high profits. There are high costs also
involved with high market share.
• Growth rate and relative market share are not the only indicators of profitability.
This model ignores and overlooks other indicators of profitability.
• At times, dogs may help other businesses in gaining competitive advantage. They
can earn even more than cash cows sometimes.
• This four-celled approach is considered as to be too simplistic.
Bcg matricx

Bcg matricx

  • 1.
  • 2.
    INTRODUCTION • It wasdeveloped in early 1970. • Boston Consulting Group (BCG) Matrix is a four celled matrix (2*2 matrix) developed by BCG, USA. • It is the most renowned corporate portfolio analysis tool. • It provides a graphic representation for an organization to examine different businesses in it’s portfolio on the basis of their related market share and industry growth rates. • It is a two dimensional analysis on management of SBU’s (Strategic Business Units).
  • 3.
    • It isa comparative analysis of business potential and the evaluation of environment. • According to this matrix, business could be classified as high or low according to their industry growth rate and relative market share. Relative Market Share = SBU Sales this year - leading competitors sales this year. Market Growth Rate = Industry sales this year - Industry Sales last year.
  • 4.
  • 5.
     High marketshare and High market growth.  Stars require huge investments to maintain their lead.  If successful, a star will become a cash cow when the industry matures.  Star  Cash Cows  High market share and Low market growth.  Cash cows require little investment and generate cash that can be utilized for investment in other business units.  These businesses usually follow stability strategies.  When cash cows loose their appeal and move towards deterioration, then a retrenchment policy may be pursued.
  • 6.
     Question Marks Low market share and High market growth.  They require huge amount of cash to maintain or gain market share. Most businesses start as question marks as the company tries to enter a high growth market in which there is already a market-share.  If ignored, then question marks may become dogs, while if huge investment is made, then they have potential of becoming stars.  Dog  Low market share and Low market growth.  Retrenchment strategies are adopted because these firms can gain market share only at the expense of competitor’s/rival firms.
  • 8.
  • 9.
    Limitations of BCGMatrix • BCG matrix classifies businesses as low and high, but generally businesses can be medium also. Thus, the true nature of business may not be reflected. • Market is not clearly defined in this model. • High market share does not always leads to high profits. There are high costs also involved with high market share. • Growth rate and relative market share are not the only indicators of profitability. This model ignores and overlooks other indicators of profitability. • At times, dogs may help other businesses in gaining competitive advantage. They can earn even more than cash cows sometimes. • This four-celled approach is considered as to be too simplistic.