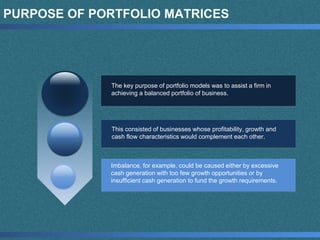
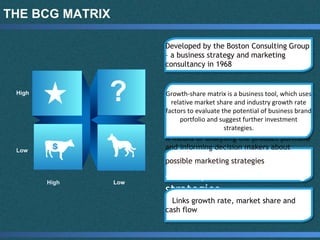
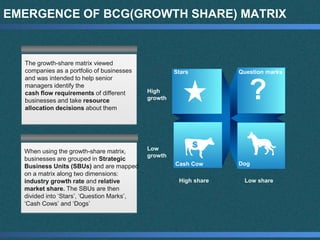
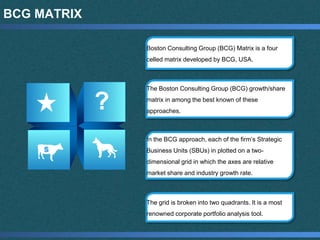
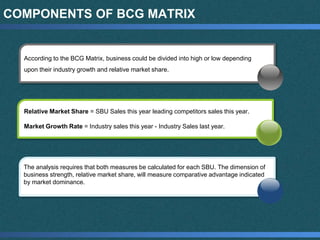
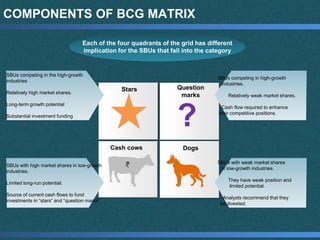
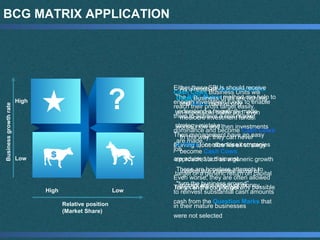
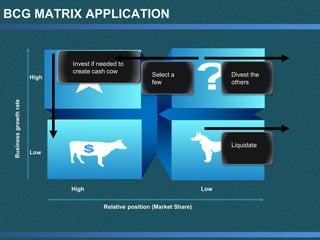
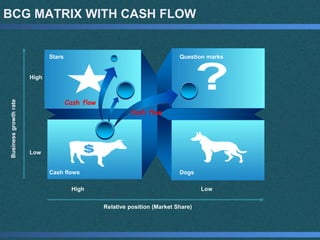
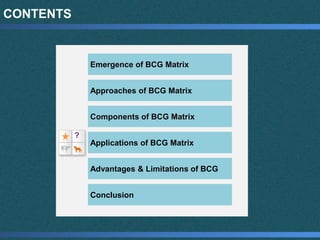
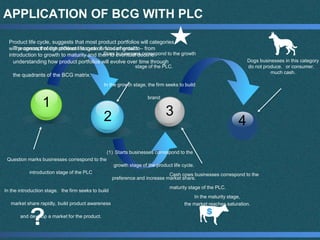
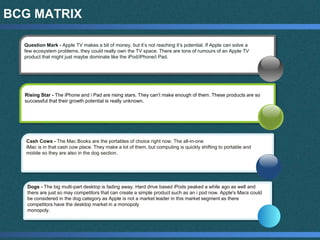
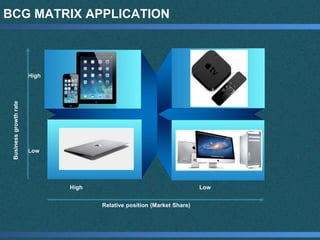
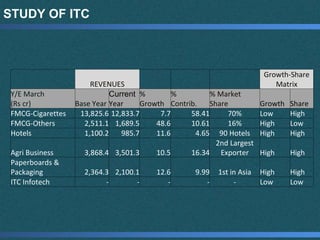
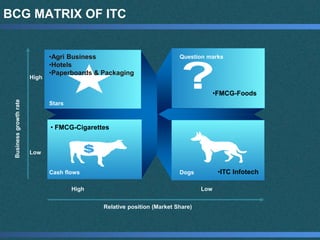
BCG Matrix
BY SAYALI WARE 111
YOGITA ZOPE 119
NIRAJ TRIVEDI 103
SHASHANK SHAH 106
DHERAJ KANCHAN 77
RAHUL SRIVASTAV 99
CONTENTS
Emergence of BCG Matrix
Approaches of BCG Matrix
Components of BCG Matrix
Applications of BCG Matrix
Advantages & Limitations of BCG
Conclusion
?
EMERGENCE OF PORTFOLIO MATRICES
During the 1979’s and early 1980’s, several leading
consulting firms developed the concept of portfolio
matrices to achieve a better understanding of the
competitive position of an overall portfolio of
businesses, to suggest alternatives for each of the
businesses, and to identify priorities for the
allocation of resources.
PURPOSE OF PORTFOLIO MATRICES
The key purpose of portfolio models was to assist a firm in
achieving a balanced portfolio of business.
This consisted of businesses whose profitability, growth and
cash flow characteristics would complement each other.
Imbalance, for example, could be caused either by excessive
cash generation with too few growth opportunities or by
insufficient cash generation to fund the growth requirements.
THE BCG MATRIX
High Low
Low
High
A means of analysing the product portfolio
and informing decision makers about
possible marketing strategies makers
about possible marketing
strategies
Growth-share matrix is a business tool, which uses
relative market share and industry growth rate
factors to evaluate the potential of business brand
portfolio and suggest further investment
strategies.
Links growth rate, market share and
cash flow
Developed by the Boston Consulting Group
– a business strategy and marketing
consultancy in 1968
EMERGENCE OF BCG(GROWTH SHARE) MATRIX
The growth-share matrix viewed
companies as a portfolio of businesses
and was intended to help senior
managers identify the
cash flow requirements of different
businesses and take resource
allocation decisions about them
When using the growth-share matrix,
businesses are grouped in Strategic
Business Units (SBUs) and are mapped
on a matrix along two dimensions:
industry growth rate and relative
market share. The SBUs are then
divided into ‘Stars’, ‘Question Marks’,
‘Cash Cows’ and ‘Dogs’
High share Low share
Low
growth
High
growth
Stars Question marks
Cash Cow Dog
CONTENTS
Emergence of BCG Matrix
Approaches of BCG Matrix
Components of BCG Matrix
Applications of BCG Matrix
Advantages & Limitations of BCG
Conclusion
?
BCG MATRIX
Boston Consulting Group (BCG) Matrix is a four
celled matrix developed by BCG, USA.
The Boston Consulting Group (BCG) growth/share
matrix in among the best known of these
approaches.
In the BCG approach, each of the firm’s Strategic
Business Units (SBUs) in plotted on a two-
dimensional grid in which the axes are relative
market share and industry growth rate.
The grid is broken into two quadrants. It is a most
renowned corporate portfolio analysis tool.
RELATIVE MARKET SHARE
Relative market share
indicates cash generation.
Higher the market share,
the cash generated will be
more.
According to the BCG
Matrix, it is assumed that
these earnings will grow
faster the higher the share.
The question of what is a
‘high market share’ is a
debate.
The best evidence is that
the most stable position is
for the brand leader to
have a share double that of
the second brand, and
triple that of the third.
By choosing the relative
market share, it shows
where the brand is
positioned against its
competitors.
It indicates about the
future of the
product/brand as well.
MARKET GROWTH RATE
Organisations strive for rapid growth in the competitive market.
They require huge investment for this.
The theory behind the matrix assumes, therefore, that a higher
growth rate is indicative of accompanying demands on
investment.
The cut-off point is chosen as 10% per annum and the growth
beyond this point is considered as significant.
Market Growth Rate =
(Current market size - Original market size) / (Original market size)
COMPONENTS OF BCG MATRIX
According to the BCG Matrix, business could be divided into high or low depending
upon their industry growth and relative market share.
Relative Market Share = SBU Sales this year leading competitors sales this year.
Market Growth Rate = Industry sales this year - Industry Sales last year.
The analysis requires that both measures be calculated for each SBU. The dimension of
business strength, relative market share, will measure comparative advantage indicated
by market dominance.
CONTENTS
Emergence of BCG Matrix
Approaches of BCG Matrix
Components of BCG Matrix
Applications of BCG Matrix
Advantages & Limitations of BCG
Conclusion
?
COMPONENTS OF BCG MATRIX
Each of the four quadrants of the grid has different
implication for the SBUs that fall into the category
Stars
?
Question
marks
Dogs
SBUs competing in the high-growth
industries
Relatively high market shares.
Long-term growth potential
Substantial investment funding
SBUs competing in high-growth
industries.
Relatively weak market shares.
Cash flow required to enhance
their competitive positions.
SBUs with weak market shares
in low-growth industries.
They have weak position and
limited potential.
Analysts recommend that they
be divested.
SBUs with high market shares in low-growth
industries.
Limited long-run potential.
Source of current cash flows to fund
investments in “stars” and “question marks”
BCG MATRIX APPLICATION
High Low
Relative position
(Market Share)
Low
High
Businessgrowthrate
The BCG Matrix method can help to
understand a frequently made
strategy mistake:
Having a one size fits all strategy
approach, such as a generic growth
target or a generic return on capital
for an entire corporation.
Cash Cows Business Units will
reach their profit target easily.
Their management have an easy
job.
Even worse, they are often allowed
to reinvest substantial cash amounts
in their mature businesses
Dogs Business Units are fighting
an impossible battle and, even
worse, now and then investments
are made.
These are hopeless attempts to
"turn the business around”
As a result all Question Marks
and Stars receive only
mediocre investment funds.
In this way, they can never
become Cash Cows.
Inadequate invested sums of
money are a waste of money.
Either these SBUs should receive
enough investment funds to enable
them to achieve a real market
dominance and become Cash Cows
(or Stars), or otherwise companies
are advised to disinvest.
They can then try to get any possible
cash from the Question Marks that
were not selected
BCG MATRIX APPLICATION
High Low
Relative position (Market Share)
Low
High
Businessgrowthrate
Invest if needed to
create cash cow
Select a
few
Divest the
others
Liquidate
BCG MATRIX WITH CASH FLOW
High Low
Relative position (Market Share)
Low
High
Businessgrowthrate
Stars Question marks
Cash flows Dogs
Cash flow
Cash flow
BCG MATRIX APPLICATION
Companies that followed these recommendations
blindly made important strategic errors
Even ‘Cash cows’ may require substantial investment
to keep competitive
The Motor Vehicle industry is indeed low-growth and relatively
consolidated, but it is also characterised by cut-throat
competition.
If the leading competitors reduce their investment in new vehicle
designs, and product or process innovations in general, they are
likely to be quickly overtaken by more capable competitors.
Lastly, portfolio planning techniques tend to view businesses as
free-stranding entities, and this ignore any potential or actual
synergies between them.
CONTENTS
Emergence of BCG Matrix
Approaches of BCG Matrix
Components of BCG Matrix
Applications of BCG Matrix
Advantages & Limitations of BCG
Conclusion
?
APPLICATION OF BCG WITH PLC
1
2 3
Product life cycle, suggests that most product portfolios will categories
will progress through different stages of rates of growth – from
introduction to growth to maturity and then to eventual decline.
The concept of the product life cycle is fundamental to
understanding how product portfolios will evolve over time through
the quadrants of the BCG matrix.
4
Question marks businesses correspond to the
introduction stage of the PLC
In the introduction stage,the firm seeks to build
market share rapidly, build product awareness
and develop a market for the product.
Stars businesses correspond to the growth
stage of the PLC.
In the growth stage, the firm seeks to build
brand
(1) Starts businesses correspond to the
growth stage of the product life cycle.
preference and increase market share.
Cash cows businesses correspond to the
maturity stage of the PLC.
In the maturity stage,
the market reaches saturation.
Dogs businesses in this category
do not produce,or consumer,
much cash.
BCG MATRIX
Question Mark - Apple TV makes a bit of money, but it’s not reaching it’s potential. If Apple can solve a
few ecosystem problems, they could really own the TV space. There are tons of rumours of an Apple TV
product that might just maybe dominate like the iPod/iPhone/i Pad.
Rising Star - The iPhone and i Pad are rising stars. They can’t make enough of them. These products are so
successful that their growth potential is really unknown.
Cash Cows - The Mac Books are the portables of choice right now. The all-in-one
iMac is in that cash cow place. They make a lot of them, but computing is quickly shifting to portable and
mobile so they are also in the dog section.
Dogs - The big multi-part desktop is fading away. Hard drive based iPods peaked a while ago as well and
there are just so may competitors that can create a simple product such as an i pod now. Apple's Macs could
be considered in the dog category as Apple is not a market leader in this market segment as there
competitors have the desktop market in a monopoly
monopoly.
BCG MATRIX APPLICATION
High Low
Relative position (Market Share)
Low
High
Businessgrowthrate
STUDY OF ITC
REVENUES
Growth-Share
Matrix
Y/E March
(Rs cr) Base Year
Current
Year
%
Growth
%
Contrib.
% Market
Share Growth Share
FMCG-Cigarettes 13,825.6 12,833.7 7.7 58.41 70% Low High
FMCG-Others 2,511.1 1,689.5 48.6 10.61 16% High Low
Hotels 1,100.2 985.7 11.6 4.65 90 Hotels High High
Agri Business 3,868.4 3,501.3 10.5 16.34
2nd Largest
Exporter High High
Paperboards &
Packaging 2,364.3 2,100.1 12.6 9.99 1st in Asia High High
ITC Infotech - - - - - Low Low
BCG MATRIX OF ITC
High Low
Relative position (Market Share)
Low
High
Businessgrowthrate
Stars
Question marks
Cash flows Dogs
•Agri Business
•Hotels
•Paperboards & Packaging
•FMCG-Foods
• FMCG-Cigarettes
•ITC Infotech
CONTENTS
Emergence of BCG Matrix
Approaches of BCG Matrix
Components of BCG Matrix
Applications of BCG Matrix
Advantages & Limitations of BCG
Conclusion
?
ADVANTAGES OF BCG MATRIX
• BCG Matrix is simple and easy to understand.
• It helps you to quickly and simply screen the
opportunities open to you.
• It is used to identify how corporate cash
resources can best be used to maximise a
company’s future growth and profitability.
• BCG method is applicable to large companies
that seek volume and experience effects.
• It provides a base for management to decide
and prepare for future actions.
LIMITATIONS OF BCG MATRIX
• BCG matrix uses only two dimensions:
Relative Market Share and Market
Growth Rate.
• High market share does not mean profits
all the time.
• Business with low market share can be
profitable too.
• Market growth is not the only indicator for
attractiveness of a market.
• There is no clear definition of what
constitutes a “market”.
CONTENTS
Emergence of BCG Matrix
Approaches of BCG Matrix
Components of BCG Matrix
Applications of BCG Matrix
Advantages & Limitations of BCG
Conclusion
?
CONCLUSION
Though BCG matrix has its limitation it is one of the most famous
& simple portfolio planning matrix, used by large companies
having multi-products.
BCG focuses on the product portfolio as the major component for
companies to thrive for market capitalisation.
BCG matrix

BCG matrix

  • 1.
    BCG Matrix BY SAYALIWARE 111 YOGITA ZOPE 119 NIRAJ TRIVEDI 103 SHASHANK SHAH 106 DHERAJ KANCHAN 77 RAHUL SRIVASTAV 99
  • 2.
    CONTENTS Emergence of BCGMatrix Approaches of BCG Matrix Components of BCG Matrix Applications of BCG Matrix Advantages & Limitations of BCG Conclusion ?
  • 3.
    EMERGENCE OF PORTFOLIOMATRICES During the 1979’s and early 1980’s, several leading consulting firms developed the concept of portfolio matrices to achieve a better understanding of the competitive position of an overall portfolio of businesses, to suggest alternatives for each of the businesses, and to identify priorities for the allocation of resources.
  • 4.
    PURPOSE OF PORTFOLIOMATRICES The key purpose of portfolio models was to assist a firm in achieving a balanced portfolio of business. This consisted of businesses whose profitability, growth and cash flow characteristics would complement each other. Imbalance, for example, could be caused either by excessive cash generation with too few growth opportunities or by insufficient cash generation to fund the growth requirements.
  • 5.
    THE BCG MATRIX HighLow Low High A means of analysing the product portfolio and informing decision makers about possible marketing strategies makers about possible marketing strategies Growth-share matrix is a business tool, which uses relative market share and industry growth rate factors to evaluate the potential of business brand portfolio and suggest further investment strategies. Links growth rate, market share and cash flow Developed by the Boston Consulting Group – a business strategy and marketing consultancy in 1968
  • 6.
    EMERGENCE OF BCG(GROWTHSHARE) MATRIX The growth-share matrix viewed companies as a portfolio of businesses and was intended to help senior managers identify the cash flow requirements of different businesses and take resource allocation decisions about them When using the growth-share matrix, businesses are grouped in Strategic Business Units (SBUs) and are mapped on a matrix along two dimensions: industry growth rate and relative market share. The SBUs are then divided into ‘Stars’, ‘Question Marks’, ‘Cash Cows’ and ‘Dogs’ High share Low share Low growth High growth Stars Question marks Cash Cow Dog
  • 7.
    CONTENTS Emergence of BCGMatrix Approaches of BCG Matrix Components of BCG Matrix Applications of BCG Matrix Advantages & Limitations of BCG Conclusion ?
  • 8.
    BCG MATRIX Boston ConsultingGroup (BCG) Matrix is a four celled matrix developed by BCG, USA. The Boston Consulting Group (BCG) growth/share matrix in among the best known of these approaches. In the BCG approach, each of the firm’s Strategic Business Units (SBUs) in plotted on a two- dimensional grid in which the axes are relative market share and industry growth rate. The grid is broken into two quadrants. It is a most renowned corporate portfolio analysis tool.
  • 9.
    RELATIVE MARKET SHARE Relativemarket share indicates cash generation. Higher the market share, the cash generated will be more. According to the BCG Matrix, it is assumed that these earnings will grow faster the higher the share. The question of what is a ‘high market share’ is a debate. The best evidence is that the most stable position is for the brand leader to have a share double that of the second brand, and triple that of the third. By choosing the relative market share, it shows where the brand is positioned against its competitors. It indicates about the future of the product/brand as well.
  • 10.
    MARKET GROWTH RATE Organisationsstrive for rapid growth in the competitive market. They require huge investment for this. The theory behind the matrix assumes, therefore, that a higher growth rate is indicative of accompanying demands on investment. The cut-off point is chosen as 10% per annum and the growth beyond this point is considered as significant. Market Growth Rate = (Current market size - Original market size) / (Original market size)
  • 11.
    COMPONENTS OF BCGMATRIX According to the BCG Matrix, business could be divided into high or low depending upon their industry growth and relative market share. Relative Market Share = SBU Sales this year leading competitors sales this year. Market Growth Rate = Industry sales this year - Industry Sales last year. The analysis requires that both measures be calculated for each SBU. The dimension of business strength, relative market share, will measure comparative advantage indicated by market dominance.
  • 12.
    CONTENTS Emergence of BCGMatrix Approaches of BCG Matrix Components of BCG Matrix Applications of BCG Matrix Advantages & Limitations of BCG Conclusion ?
  • 13.
    COMPONENTS OF BCGMATRIX Each of the four quadrants of the grid has different implication for the SBUs that fall into the category Stars ? Question marks Dogs SBUs competing in the high-growth industries Relatively high market shares. Long-term growth potential Substantial investment funding SBUs competing in high-growth industries. Relatively weak market shares. Cash flow required to enhance their competitive positions. SBUs with weak market shares in low-growth industries. They have weak position and limited potential. Analysts recommend that they be divested. SBUs with high market shares in low-growth industries. Limited long-run potential. Source of current cash flows to fund investments in “stars” and “question marks”
  • 14.
    BCG MATRIX APPLICATION HighLow Relative position (Market Share) Low High Businessgrowthrate The BCG Matrix method can help to understand a frequently made strategy mistake: Having a one size fits all strategy approach, such as a generic growth target or a generic return on capital for an entire corporation. Cash Cows Business Units will reach their profit target easily. Their management have an easy job. Even worse, they are often allowed to reinvest substantial cash amounts in their mature businesses Dogs Business Units are fighting an impossible battle and, even worse, now and then investments are made. These are hopeless attempts to "turn the business around” As a result all Question Marks and Stars receive only mediocre investment funds. In this way, they can never become Cash Cows. Inadequate invested sums of money are a waste of money. Either these SBUs should receive enough investment funds to enable them to achieve a real market dominance and become Cash Cows (or Stars), or otherwise companies are advised to disinvest. They can then try to get any possible cash from the Question Marks that were not selected
  • 15.
    BCG MATRIX APPLICATION HighLow Relative position (Market Share) Low High Businessgrowthrate Invest if needed to create cash cow Select a few Divest the others Liquidate
  • 16.
    BCG MATRIX WITHCASH FLOW High Low Relative position (Market Share) Low High Businessgrowthrate Stars Question marks Cash flows Dogs Cash flow Cash flow
  • 17.
    BCG MATRIX APPLICATION Companiesthat followed these recommendations blindly made important strategic errors Even ‘Cash cows’ may require substantial investment to keep competitive The Motor Vehicle industry is indeed low-growth and relatively consolidated, but it is also characterised by cut-throat competition. If the leading competitors reduce their investment in new vehicle designs, and product or process innovations in general, they are likely to be quickly overtaken by more capable competitors. Lastly, portfolio planning techniques tend to view businesses as free-stranding entities, and this ignore any potential or actual synergies between them.
  • 18.
    CONTENTS Emergence of BCGMatrix Approaches of BCG Matrix Components of BCG Matrix Applications of BCG Matrix Advantages & Limitations of BCG Conclusion ?
  • 19.
    APPLICATION OF BCGWITH PLC 1 2 3 Product life cycle, suggests that most product portfolios will categories will progress through different stages of rates of growth – from introduction to growth to maturity and then to eventual decline. The concept of the product life cycle is fundamental to understanding how product portfolios will evolve over time through the quadrants of the BCG matrix. 4 Question marks businesses correspond to the introduction stage of the PLC In the introduction stage,the firm seeks to build market share rapidly, build product awareness and develop a market for the product. Stars businesses correspond to the growth stage of the PLC. In the growth stage, the firm seeks to build brand (1) Starts businesses correspond to the growth stage of the product life cycle. preference and increase market share. Cash cows businesses correspond to the maturity stage of the PLC. In the maturity stage, the market reaches saturation. Dogs businesses in this category do not produce,or consumer, much cash.
  • 20.
    BCG MATRIX Question Mark- Apple TV makes a bit of money, but it’s not reaching it’s potential. If Apple can solve a few ecosystem problems, they could really own the TV space. There are tons of rumours of an Apple TV product that might just maybe dominate like the iPod/iPhone/i Pad. Rising Star - The iPhone and i Pad are rising stars. They can’t make enough of them. These products are so successful that their growth potential is really unknown. Cash Cows - The Mac Books are the portables of choice right now. The all-in-one iMac is in that cash cow place. They make a lot of them, but computing is quickly shifting to portable and mobile so they are also in the dog section. Dogs - The big multi-part desktop is fading away. Hard drive based iPods peaked a while ago as well and there are just so may competitors that can create a simple product such as an i pod now. Apple's Macs could be considered in the dog category as Apple is not a market leader in this market segment as there competitors have the desktop market in a monopoly monopoly.
  • 21.
    BCG MATRIX APPLICATION HighLow Relative position (Market Share) Low High Businessgrowthrate
  • 22.
    STUDY OF ITC REVENUES Growth-Share Matrix Y/EMarch (Rs cr) Base Year Current Year % Growth % Contrib. % Market Share Growth Share FMCG-Cigarettes 13,825.6 12,833.7 7.7 58.41 70% Low High FMCG-Others 2,511.1 1,689.5 48.6 10.61 16% High Low Hotels 1,100.2 985.7 11.6 4.65 90 Hotels High High Agri Business 3,868.4 3,501.3 10.5 16.34 2nd Largest Exporter High High Paperboards & Packaging 2,364.3 2,100.1 12.6 9.99 1st in Asia High High ITC Infotech - - - - - Low Low
  • 23.
    BCG MATRIX OFITC High Low Relative position (Market Share) Low High Businessgrowthrate Stars Question marks Cash flows Dogs •Agri Business •Hotels •Paperboards & Packaging •FMCG-Foods • FMCG-Cigarettes •ITC Infotech
  • 24.
    CONTENTS Emergence of BCGMatrix Approaches of BCG Matrix Components of BCG Matrix Applications of BCG Matrix Advantages & Limitations of BCG Conclusion ?
  • 25.
    ADVANTAGES OF BCGMATRIX • BCG Matrix is simple and easy to understand. • It helps you to quickly and simply screen the opportunities open to you. • It is used to identify how corporate cash resources can best be used to maximise a company’s future growth and profitability. • BCG method is applicable to large companies that seek volume and experience effects. • It provides a base for management to decide and prepare for future actions.
  • 26.
    LIMITATIONS OF BCGMATRIX • BCG matrix uses only two dimensions: Relative Market Share and Market Growth Rate. • High market share does not mean profits all the time. • Business with low market share can be profitable too. • Market growth is not the only indicator for attractiveness of a market. • There is no clear definition of what constitutes a “market”.
  • 27.
    CONTENTS Emergence of BCGMatrix Approaches of BCG Matrix Components of BCG Matrix Applications of BCG Matrix Advantages & Limitations of BCG Conclusion ?
  • 28.
    CONCLUSION Though BCG matrixhas its limitation it is one of the most famous & simple portfolio planning matrix, used by large companies having multi-products. BCG focuses on the product portfolio as the major component for companies to thrive for market capitalisation.