Downloaded 1,079 times


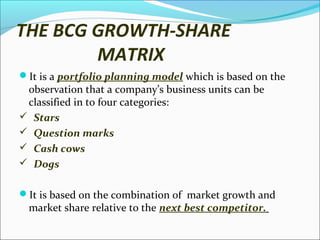
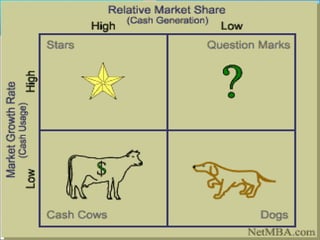
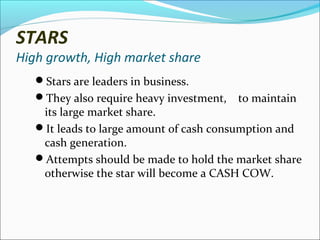
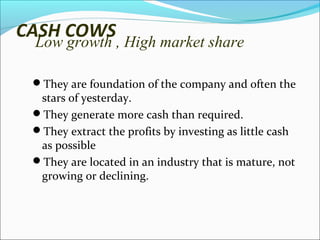
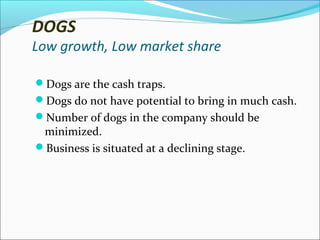
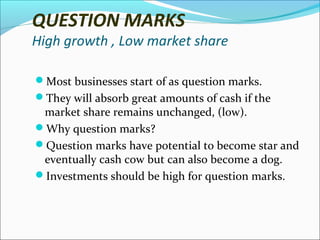
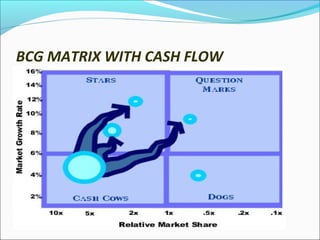

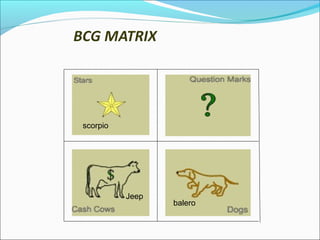

The Boston Consulting Group Matrix is a portfolio planning model that classifies businesses into four categories based on their relative market share and the market growth of the industry they operate in. These categories are stars, question marks, cash cows, and dogs. Stars are high market share businesses in high growth industries that require heavy investment. Cash cows have high market share in low growth industries and generate cash. Question marks have low market share but operate in high growth industries, requiring investment to potentially become stars. Dogs have low market share and operate in low growth industries, acting as cash traps. The matrix is used to assess business profiles, cash demands, resource allocation, and identify investment and divestment opportunities.