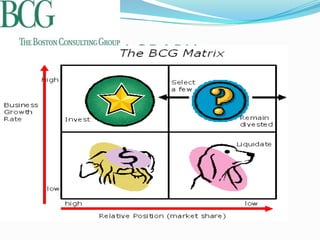
PRESENTATION ON BCG MATRIX


      BY:-
     SUBHASISH BHATTACHARJEE
HISTORY OF
 The Boston Consulting Group or BCG is a global
 management consulting firm with offices in 41
 countries. It is recognized as one of the most
 prestigious management consulting firms in the
 world.

 The company was formed by Bruce D. Henderson.

 The BCG Matrix was created by The Boston
 Consulting Group (BCG) and it became one of the
 most well-known portfolio management Decision
 Making Tool in the early 1970’s.
COMPANY PROFILE
 Type-          Partnership
   Industry-    Management consulting
   Founded-    1963
   Headquarters-Boston, Massachusetts, United States, 71
                offices in 41 countries
   Key people- Hans-Paul Bürkner, President & CEO
   Products-    Management consulting services
   Revenue-    US$ 2.75 billion (2009)
   Employees- 4,400 (consultants)
   Website-     bcg.com
ALLOCATION OF
           RESOURCES
High market share in a high growth market are
 designated as Stars.
High market share in a low growth market are
 designed as Cash Cows.
Low market share in a high growth market are
 designated as Question Marks or Problem
 Children.
Low market share in a low growth market are
 designated as Dogs.
BCG MATRIX GRAPH
Segments in the BCG matrix
 Cash Cows (high market share, low growth) - Keep investments low,
  while keeping profits high. Profits and cash generation should be
  higher because of low growth.
 Dogs (low market share, low growth) - Liquidate, if they are not
  delivering cash. Avoid and reduce the number of these an organization
  maintains. Keep an eye out for expensive revival strategies - a dog is
  typically always a dog.
 Stars (high market share, high growth) - Invest further in these - they
  incur high costs, but they are market leaders and should also generate
  lots of cash. Stars may balance on net cash flow, but the organization
  should try to maintain market share on this would because rewards are
  likely
 Question marks (low market share, but high growth) - These have
  poor cash inflow, but have high demands and low returns due to low
  market share. Efforts should be made to change market share. If this
  isn’t possible, this will likely turn into a dog as growth slows.
ADVANTAGES OF BCG
         MATRIX
To evaluate balance in the firm’s current portfolio
 of Stars, Cash cows, Question marks & Dogs

To decide & prepare for future actions


Applicable for large companies that seeks volume
 & experience effects

 It is simple & easy to understand
Limitations of BCG Matrix
 BCG matrix classifies businesses as low and high, but
  generally businesses can be medium also.
 Market is not clearly defined in this model.
 High market share does not always leads to high
  profits. There are high costs also involved with high
  market share.
 Growth rate and relative market share are not the only
  indicators of profitability. This model ignores and
  overlooks other indicators of profitability.

Bcg matrix subhasish

  • 1.
    PRESENTATION ON BCGMATRIX BY:- SUBHASISH BHATTACHARJEE
  • 2.
    HISTORY OF  TheBoston Consulting Group or BCG is a global management consulting firm with offices in 41 countries. It is recognized as one of the most prestigious management consulting firms in the world.  The company was formed by Bruce D. Henderson.  The BCG Matrix was created by The Boston Consulting Group (BCG) and it became one of the most well-known portfolio management Decision Making Tool in the early 1970’s.
  • 3.
    COMPANY PROFILE  Type- Partnership  Industry- Management consulting  Founded- 1963  Headquarters-Boston, Massachusetts, United States, 71 offices in 41 countries  Key people- Hans-Paul Bürkner, President & CEO  Products- Management consulting services  Revenue- US$ 2.75 billion (2009)  Employees- 4,400 (consultants)  Website- bcg.com
  • 4.
    ALLOCATION OF RESOURCES High market share in a high growth market are designated as Stars. High market share in a low growth market are designed as Cash Cows. Low market share in a high growth market are designated as Question Marks or Problem Children. Low market share in a low growth market are designated as Dogs.
  • 5.
  • 6.
    Segments in theBCG matrix  Cash Cows (high market share, low growth) - Keep investments low, while keeping profits high. Profits and cash generation should be higher because of low growth.  Dogs (low market share, low growth) - Liquidate, if they are not delivering cash. Avoid and reduce the number of these an organization maintains. Keep an eye out for expensive revival strategies - a dog is typically always a dog.  Stars (high market share, high growth) - Invest further in these - they incur high costs, but they are market leaders and should also generate lots of cash. Stars may balance on net cash flow, but the organization should try to maintain market share on this would because rewards are likely  Question marks (low market share, but high growth) - These have poor cash inflow, but have high demands and low returns due to low market share. Efforts should be made to change market share. If this isn’t possible, this will likely turn into a dog as growth slows.
  • 7.
    ADVANTAGES OF BCG MATRIX To evaluate balance in the firm’s current portfolio of Stars, Cash cows, Question marks & Dogs To decide & prepare for future actions Applicable for large companies that seeks volume & experience effects  It is simple & easy to understand
  • 8.
    Limitations of BCGMatrix  BCG matrix classifies businesses as low and high, but generally businesses can be medium also.  Market is not clearly defined in this model.  High market share does not always leads to high profits. There are high costs also involved with high market share.  Growth rate and relative market share are not the only indicators of profitability. This model ignores and overlooks other indicators of profitability.