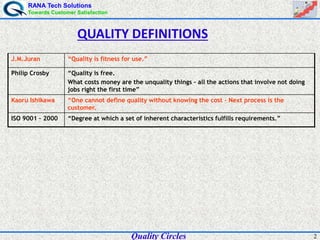
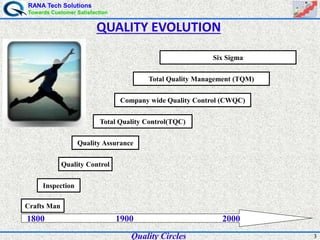
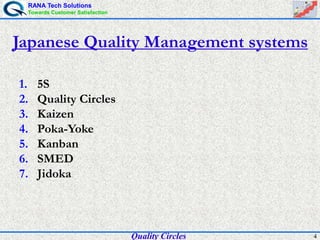
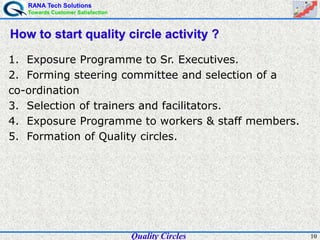
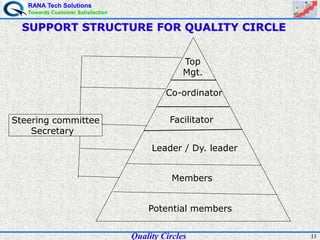
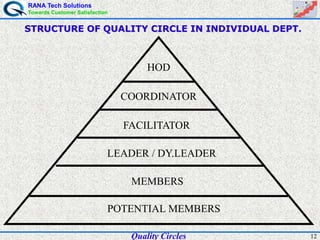
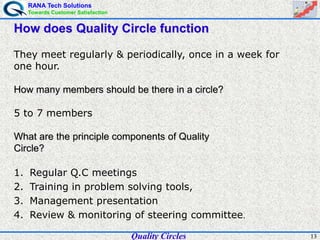
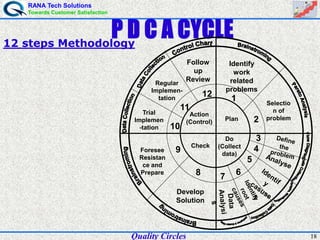
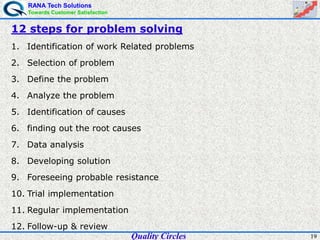
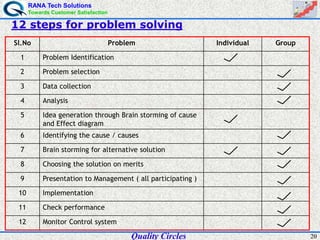
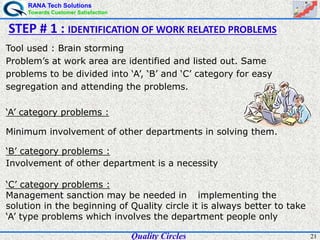
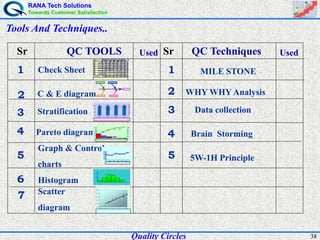
RANA Tech Solutions
Towards Customer Satisfaction
1
Quality
Quality Circles
RANA Tech Solutions
Towards Customer Satisfaction
2
J.M.Juran “Quality is fitness for use.”
Philip Crosby “Quality is free.
What costs money are the unquality things – all the actions that involve not doing
jobs right the first time”
Kaoru Ishikawa “One cannot define quality without knowing the cost – Next process is the
customer.
ISO 9001 – 2000 “Degree at which a set of inherent characteristics fulfills requirements.”
QUALITY DEFINITIONS
Quality Circles
RANA Tech Solutions
Towards Customer Satisfaction
3
1800 1900 2000
Crafts Man
Inspection
Quality Control
Quality Assurance
Total Quality Control(TQC)
Company wide Quality Control (CWQC)
Total Quality Management (TQM)
Six Sigma
QUALITY EVOLUTION
Quality Circles
RANA Tech Solutions
Towards Customer Satisfaction
4
Japanese Quality Management systems
1. 5S
2. Quality Circles
3. Kaizen
4. Poka-Yoke
5. Kanban
6. SMED
7. Jidoka
Quality Circles
RANA Tech Solutions
Towards Customer Satisfaction
5
Japanese Quality Management systems
 A Small Group
 To perform Quality Control Activities
 Voluntarily
 Within the same workshop
 Continuously
Quality Circle is
Quality Circles
RANA Tech Solutions
Towards Customer Satisfaction
6
ABOUT QUALITY CIRCLE
Quality Circles
RANA Tech Solutions
Towards Customer Satisfaction
7
Why Quality Circle is necessary ?
1. To facilitate one to fully develop his potential.
2. To create pleasant work environment .
3. Help factory to further develop.
4. Make people happy at work place.
Quality Circles
RANA Tech Solutions
Towards Customer Satisfaction
8
What is the history behind the Quality Circle?
Deming Circle
Act Plan
Check Do
Control ChartControl Chart
x-R Control Chart
Control ChartControl Chart
x-R Control Chart
He introduced the concept of
Deming Wheel (PDCA Cycle)
in 1957.
Plan, Do, Check and Act
Cycle, which became an
important part for problem
solving.
Dr. W. EDWARD DEMING
Dr. W A SHEWHART
The man who discovered Quality in 1931.
He was the inventor of Control Charts.
Quality Circles
RANA Tech Solutions
Towards Customer Satisfaction
9
What is the history behind the Quality Circle?
Dr. K. ISHIKAWA
Quality circle concept was started in Japan in 1962.
Dr. K. Ishikawa is known as the ‘Father of quality circle’.
HE DEVELOPED CAUSE & EFFECT DIAGRAM (FISH BONE DIAGRAM)
Dr. J M JURAN
Dr. Juran says Quality as
‘Fitness For Use’.
HE IDENTIFIED THE
PHENOMENON OF
VITAL FEW FROM USEFUL MANY
AS A UNIVERSAL PRINCIPLE
Material Method
ManMachine
Cause (4M’s) Result
(Controlled State)
Effect
Cause and EffectCause and Effect
DiagramDiagram
Material Method
ManMachine
Cause (4M’s) Result
(Controlled State)
Effect
Cause and EffectCause and Effect
DiagramDiagram
Pareto DiagramPareto Diagram
(No. of Occurrences)
Pareto DiagramPareto Diagram
(No. of Occurrences)
Quality Circles
RANA Tech Solutions
Towards Customer Satisfaction
10
How to start quality circle activity ?
1. Exposure Programme to Sr. Executives.
2. Forming steering committee and selection of a
co-ordination
3. Selection of trainers and facilitators.
4. Exposure Programme to workers & staff members.
5. Formation of Quality circles.
Quality Circles
RANA Tech Solutions
Towards Customer Satisfaction
11
SUPPORT STRUCTURE FOR QUALITY CIRCLE
Steering committee
Secretary
Top
Mgt.
Co-ordinator
Facilitator
Leader / Dy. leader
Members
Potential members
Quality Circles
RANA Tech Solutions
Towards Customer Satisfaction
12
STRUCTURE OF QUALITY CIRCLE IN INDIVIDUAL DEPT.
COORDINATOR
HOD
FACILITATOR
LEADER / DY.LEADER
MEMBERS
POTENTIAL MEMBERS
Quality Circles
RANA Tech Solutions
Towards Customer Satisfaction
13
How does Quality Circle function
They meet regularly & periodically, once in a week for
one hour.
How many members should be there in a circle?
5 to 7 members
What are the principle components of Quality
Circle?
1. Regular Q.C meetings
2. Training in problem solving tools,
3. Management presentation
4. Review & monitoring of steering committee.
Quality Circles
RANA Tech Solutions
Towards Customer Satisfaction
14
Role of leaders
1) Leader / Deputy Leader chosen by QC members.
2) Should be trained in leadership and skills.
3) Should lead the team and not dominate the proceedings.
4) Should be highly disciplined and regular in meetings.
5) Should have technical knowledge, knowledge of QC techniques,
etc.
6) Should plan and assign role to members.
7) Should prepare the QC team for presentations.
Quality Circles
RANA Tech Solutions
Towards Customer Satisfaction
15
Role of Members
1) Becoming a member of Quality Circle is voluntary.
2) All member from grass root level and from one area of work.
3) Leadership, preferably, to be rotated among members.
4) Members to attend meetings regularly.
5) Cooperate with leader and perform assigned task.
6) Mutual respect to other members and their ideas.
7) Open discussions.
8) Do homework before every meeting.
Quality Circles
RANA Tech Solutions
Towards Customer Satisfaction
16
Characteristics of meeting
• Punctuality and discipline.
• Commitment to task.
• Openness.
• Conflict of ideas, not persons.
• Constructive criticism.
• Agreement by consensus.
• Action plan after meeting.
Quality Circles
RANA Tech Solutions
Towards Customer Satisfaction
17
Take action
Decide on
the objectives
and targets
Decide method
of achieving
the objective
Carry out education
and training
Do the work
Check the
result
PLAN
DO
ACT
CHECK
Quality Circles
RANA Tech Solutions
Towards Customer Satisfaction
18
12 steps Methodology
Follow
up
Review
12
11
10
9
8 7 6
5
4
3
2
1
Action
(Control) Plan
Check
Do
(Collect
data)
Identify
work
related
problems
Selectio
n of
problem
Develop
Solution
Foresee
Resistan
ce and
Prepare
Trial
Implemen
-tation
Regular
Implemen-
tation
Quality Circles
RANA Tech Solutions
Towards Customer Satisfaction
19
12 steps for problem solving
1. Identification of work Related problems
2. Selection of problem
3. Define the problem
4. Analyze the problem
5. Identification of causes
6. finding out the root causes
7. Data analysis
8. Developing solution
9. Foreseeing probable resistance
10. Trial implementation
11. Regular implementation
12. Follow-up & review
Quality Circles
RANA Tech Solutions
Towards Customer Satisfaction
20
12 steps for problem solving
Sl.No Problem Individual Group
1 Problem Identification
2 Problem selection
3 Data collection
4 Analysis
5 Idea generation through Brain storming of cause
and Effect diagram
6 Identifying the cause / causes
7 Brain storming for alternative solution
8 Choosing the solution on merits
9 Presentation to Management ( all participating )
10 Implementation
11 Check performance
12 Monitor Control system
Quality Circles
RANA Tech Solutions
Towards Customer Satisfaction
21
Tool used : Brain storming
Problem’s at work area are identified and listed out. Same
problems to be divided into ‘A’, ‘B’ and ‘C’ category for easy
segregation and attending the problems.
‘A’ category problems :
Minimum involvement of other departments in solving them.
‘B’ category problems :
Involvement of other department is a necessity
‘C’ category problems :
Management sanction may be needed in implementing the
solution in the beginning of Quality circle it is always better to take
‘A’ type problems which involves the department people only
STEP # 1 : IDENTIFICATION OF WORK RELATED PROBLEMS
Quality Circles
RANA Tech Solutions
Towards Customer Satisfaction
22
Tool used : Ranking analysis, Priority number, Pareto analysis
1.Among the ‘A’, ‘B’ and ‘C’ category problems
2.One category to be choose for selection of problem.
3.Ranking to be given to all the problems in that category based on
the importance of the problem.
4.Top ranked 4 to 5 problems to be listed out and priority analysis to
be done for these problem by giving scores.
STEP # 2 : SELECTION OF PROBLEM
33
2 1
2
7
12
17
22
27
32
37
No. of Problems
A
B
C
Quality Circles
RANA Tech Solutions
Towards Customer Satisfaction
23
SELECTION OF PROBLEM BY RANKING METHOD :
RANKING : 1 = Least Priority , 5 = High Priority
Problem No. – 7 & 8 is selected for Project as highest ranking given by Team
RANKING : 1 = Least Priority 5 = High Priority
SCALE
S.# Major Problems
MEMBERS TOTAL
scoreM1 M2 M3 M4 M5
1 Coil cut 3 2 5 3 3 16
2
Improper weld joint (loop joint
failure)
4 5 5 4 5 23
3 No. of joints in stator ( HV ) 4 5 4 4 4 21
4 Loose wiring touching to lamination 4 3 5 4 3 19
5 Spools collar radius 1 2 2 1 2 8
6 Lamination core problem 1 3 2 1 2 9
7 Method of Handling after Varnishing 5 4 5 5 5 24
8
After Looping Wire cut and touches
to shaft body
5 5 5 5 5 25
Example : Ranking Method
Quality Circles
RANA Tech Solutions
Towards Customer Satisfaction
24
Tool used : Flow diagram, Brain storming
Even through people are from the same area it does not mean that all have a clarity
about the problem selected
So it is necessary to define the problem. The best way to do is using a ‘Flow
Diagram’ showing the entire process related to that area and indicating the problem
spot.
Reason for selection of problem : Why this problem is selected? Different reasons for
the selection of problems to be noted down
STEP # 3 : DEFINING THE PROBLEM
Looping
Shaft Pressing Wire pulling
Winding
Inspection
Varnishing
Grinding
Inspection
Quality Circles
RANA Tech Solutions
Towards Customer Satisfaction
25
Tool used : Data collection
In order to find the magnitude of the problem data to be collected
regarding the problem.
STEP # 4 : IDENTIFICATION OF WORK RELATED PROBLEMS
STATOR NC & HV REWORK % TREND
10.37
7.19
8.75
0
2
4
6
8
10
12
Month
Rew%
TOTAL
RE-WORK %
10.37 7.19 8.75
NOV '11 DEC '11 JAN '12
ANALYSIS :
Data collection of Last three months from Nov’ 2011 to Jan’
2012
PROBLEM :
Based on the analysis of data collected it was found that No
Continuity (4.07%) & High Voltage(4.44%) in Stator is upto 8.51%
(Avg. 3 Months )
Quality Circles
RANA Tech Solutions
Towards Customer Satisfaction
26
Tool used : Brain storming, Cause & Effect diagram
Different reasons for the problem to be identified by using the Cause
& Effect diagram.
Effect
Man Machine
MethodMaterial
Reasons for the problem to be listed out under four categories
Man, machine, Material and method.
STEP # 5 : IDENTIFICATION OF CAUSES
Quality Circles
RANA Tech Solutions
Towards Customer Satisfaction
27
Tool used : Brain storming, data collection
To know the main root cause data collection to be done on the
main reasons listed out in the Cause & Effect diagram.
1. Pareto diagram to be made for the collected data
2. Through pareto diagram, main root cause which can be 1 or 2
for the problem will be identified
STEP # 6 : FINDING OUT ROOT CAUSE
Quality Circles
RANA Tech Solutions
Towards Customer Satisfaction
28
Tool used : Line graph, Bar graph, Pie graph Stratification and
scatter diagram
Collection of data for analyzing the problem under
different reasons
STEP # 7 : DATA ANALYSIS
Quality Circles
RANA Tech Solutions
Towards Customer Satisfaction
29Quality Circles
Tool used : Brainstorming
1. We need some solutions to solve the problem. So, brain
storming to be done among the circle members for developing
the solution.
2. Different solutions to be listed out. Then one by one solution to
be discussed with respective problem and to be accepted if all
the members feel that problem will be solved by that solution.
3. If any solution is not accepted same will be rejected
STEP # 8 : DEVELOPING SOLUTIONS
RANA Tech Solutions
Towards Customer Satisfaction
30Quality Circles
STEP # 08 : DEVELOPING SOLUTIONS
RANA Tech Solutions
Towards Customer Satisfaction
31Quality Circles
Why – Why Analysis for After Wire pulling No continuity & High voltage
of stator :
CAUSE : After Wire pulling NC & HV is more
Why ? After wire pulling NC & HV is more ?
During wire pulling wire cut happening.
WHY ? During wire pulling wire cut happening.?
Due to burr inside the shaft
WHY? Burr inside the Shaft ?
Burr is not removed after chamfering at supplier End
Why? Burr is not removed after chamfering at supplier End?
No proper control at supplier End at chamfering operation.
WHY ? No proper control at supplier end at chamfering operation?
proper identification to be provided after chamfering.
Why – Why Analysis
RANA Tech Solutions
Towards Customer Satisfaction
32Quality Circles
Tool used : Brainstorming
1. Identifying the probable constraints and finding ways to
overcome them.
2. Make a presentation to all involved with the solution.
That is department head, facilitator other officials and
non-members involved with the implementation. Discuss
and evaluate a system for implementation.
STEP # 9 : FORESEEING PROBABLE RESISTANCE
RANA Tech Solutions
Towards Customer Satisfaction
33Quality Circles
1. Discuss with H.O.D and all department people regarding
the trial.
2. Developed solution to be implemented as a trial and
results to be studied.
3. Data collection after implementation compared with the
data collected before solving the problem. If
performance is good regular implementation to be done.
STEP # 10 : TRIAL IMPLEMENTATION & CHECK PERFORMANCE
RANA Tech Solutions
Towards Customer Satisfaction
34Quality Circles
If improvement is observed after trial implementation,
then regular implementation to be done
STEP # 11 : REGULAR IMPLEMENTATION
RANA Tech Solutions
Towards Customer Satisfaction
35Quality Circles
1. Results before regular implementation & after regular
implementation to be compared.
2. Schedule checks to be done every one or two months
and see the consistency of results
Standardize all the procedure that are implemented
STEP # 12 : FOLLOW UP / REVIEW
RANA Tech Solutions
Towards Customer Satisfaction
36Quality Circles
Now problem is selected.
What is the time taken to solve the problem ? That is mile
stone chart.
Mile stone chart is prepared after selection of problem.
Project study planning is an effective method by which
Quality circle members attain the skill.
To plan their activities and effective time management.
MILESTONE CHART
RANA Tech Solutions
Towards Customer Satisfaction
37Quality Circles
MILESTONE CHART
1 2 1 2 1 2 1 2 1 2 1 2
PLAN
ACTUAL
PLAN
ACTUAL
PLAN
ACTUAL
PLAN
ACTUAL
PLAN
ACTUAL
PLAN
ACTUAL
PLAN
ACTUAL
PLAN
ACTUAL
PLAN
ACTUAL
PLAN
ACTUAL
PLAN
ACTUAL
PLAN
ACTUAL
CHECK
10
TRIALIMPLEMENTATION
AND
CHECKPERFORMANCE
ACT
11
REGULAR
IMPLEMENTATION
12 FOLLOW-UP &REVIEW
7 ANALYZINGTHEDATA
DO
8 DEVELOPINGSOLUTION
9
FORESEEINGPROBABLE
RESISTANCE
DEFININGTHEPROBLEM
4 ANALYSIS OFPROBLEM
5
IDENTIFICATIONOF
CAUSES
6
FINDINGOUTTHEROOT
CAUSES
APR'12 MAY'12 JUNE'12 JUL'12
PLAN
1
IDENTIFICATIONOF
PROBLEM
2 SELECTIONOFPROBLEM
3
MEETINGDAY :THURSDAY TEAMNAME: USHAWONDERS
TIME:2:00 TO 3:00 PM STARTED :2 February' 2012
PDCA S# STAGE
PLAN/
ACTUAL
FEB'12 MAR'12
RANA Tech Solutions
Towards Customer Satisfaction
38Quality Circles
Tools And Techniques..
QC TOOLS
1
2
3
4
5
6
7
Check Sheet
C & E diagram
Stratification
Graph & Control
charts
Scatter
diagram
Histogram
SrUsed
3
2
1
UsedQC Techniques
MILE STONE
5W-1H Principle
Pareto diagram
5
4 Brain Storming
# DEFECT TOTALMONTH / DEFECT IN PPM
OCT ‘98 MAR ‘99FEB ‘99JAN ‘99DEC ‘98NOV ‘98
1 NOISE 137522198 24302272235023102200
2 CLUTCH ENGAGE 282964212 59444916485449123458
3 SHEAVE TIGHT 120241996 20882400189817921850
4
CLUTCH BEARING
FAILURE
12024730 1976233821309501958
5
CRANK SHAFT
PROBLEM
2950384 86830041424434
6 OTHERS 2954488 169427425400
TOTAL 7200010000 150001250011900131009500
0.047
0.030
0.020 0.020
0.005 0.005
39.7
58.8
75.5
92.2 96.1
0
0.02
0.04
0.06
0.08
0.1
0.12
CLUTCH ENGAGENOISECLUTCH BEARINGFAILURESHEAVE TIGHTCR. SH. PROBLEMOTHERS0
20
40
60
80
100
641632625600
0.1190.131
0.0950.1
0.13
0.15
0.1
0.15
0
0.05
0.1
0.15
Oct '98 Nov '98 Dec'98 Jan 99
0
100
200
300
400
500
600
700
0.000
0.005
0.010
0.015
0.020
0.025
65 66 67 68 69 70 71 72 73 74 75 76 77 78 79 80
4
10
18 17
10
5
0
5
10
15
20
25
15.05 15.08 15.11 15.14 15.17 15.2
15000
1250011900
13100
950010000
0
3000
6000
9000
12000
15000
18000
Oct '98Nov '98Dec '98Jan '99Feb '99Mar.99
Sr
WHY WHY Analysis
Data collection
RANA Tech Solutions
Towards Customer Satisfaction
39
Any
Questions,
???
Thanks.

Quality circles

  • 1.
    RANA Tech Solutions TowardsCustomer Satisfaction 1 Quality Quality Circles
  • 2.
    RANA Tech Solutions TowardsCustomer Satisfaction 2 J.M.Juran “Quality is fitness for use.” Philip Crosby “Quality is free. What costs money are the unquality things – all the actions that involve not doing jobs right the first time” Kaoru Ishikawa “One cannot define quality without knowing the cost – Next process is the customer. ISO 9001 – 2000 “Degree at which a set of inherent characteristics fulfills requirements.” QUALITY DEFINITIONS Quality Circles
  • 3.
    RANA Tech Solutions TowardsCustomer Satisfaction 3 1800 1900 2000 Crafts Man Inspection Quality Control Quality Assurance Total Quality Control(TQC) Company wide Quality Control (CWQC) Total Quality Management (TQM) Six Sigma QUALITY EVOLUTION Quality Circles
  • 4.
    RANA Tech Solutions TowardsCustomer Satisfaction 4 Japanese Quality Management systems 1. 5S 2. Quality Circles 3. Kaizen 4. Poka-Yoke 5. Kanban 6. SMED 7. Jidoka Quality Circles
  • 5.
    RANA Tech Solutions TowardsCustomer Satisfaction 5 Japanese Quality Management systems  A Small Group  To perform Quality Control Activities  Voluntarily  Within the same workshop  Continuously Quality Circle is Quality Circles
  • 6.
    RANA Tech Solutions TowardsCustomer Satisfaction 6 ABOUT QUALITY CIRCLE Quality Circles
  • 7.
    RANA Tech Solutions TowardsCustomer Satisfaction 7 Why Quality Circle is necessary ? 1. To facilitate one to fully develop his potential. 2. To create pleasant work environment . 3. Help factory to further develop. 4. Make people happy at work place. Quality Circles
  • 8.
    RANA Tech Solutions TowardsCustomer Satisfaction 8 What is the history behind the Quality Circle? Deming Circle Act Plan Check Do Control ChartControl Chart x-R Control Chart Control ChartControl Chart x-R Control Chart He introduced the concept of Deming Wheel (PDCA Cycle) in 1957. Plan, Do, Check and Act Cycle, which became an important part for problem solving. Dr. W. EDWARD DEMING Dr. W A SHEWHART The man who discovered Quality in 1931. He was the inventor of Control Charts. Quality Circles
  • 9.
    RANA Tech Solutions TowardsCustomer Satisfaction 9 What is the history behind the Quality Circle? Dr. K. ISHIKAWA Quality circle concept was started in Japan in 1962. Dr. K. Ishikawa is known as the ‘Father of quality circle’. HE DEVELOPED CAUSE & EFFECT DIAGRAM (FISH BONE DIAGRAM) Dr. J M JURAN Dr. Juran says Quality as ‘Fitness For Use’. HE IDENTIFIED THE PHENOMENON OF VITAL FEW FROM USEFUL MANY AS A UNIVERSAL PRINCIPLE Material Method ManMachine Cause (4M’s) Result (Controlled State) Effect Cause and EffectCause and Effect DiagramDiagram Material Method ManMachine Cause (4M’s) Result (Controlled State) Effect Cause and EffectCause and Effect DiagramDiagram Pareto DiagramPareto Diagram (No. of Occurrences) Pareto DiagramPareto Diagram (No. of Occurrences) Quality Circles
  • 10.
    RANA Tech Solutions TowardsCustomer Satisfaction 10 How to start quality circle activity ? 1. Exposure Programme to Sr. Executives. 2. Forming steering committee and selection of a co-ordination 3. Selection of trainers and facilitators. 4. Exposure Programme to workers & staff members. 5. Formation of Quality circles. Quality Circles
  • 11.
    RANA Tech Solutions TowardsCustomer Satisfaction 11 SUPPORT STRUCTURE FOR QUALITY CIRCLE Steering committee Secretary Top Mgt. Co-ordinator Facilitator Leader / Dy. leader Members Potential members Quality Circles
  • 12.
    RANA Tech Solutions TowardsCustomer Satisfaction 12 STRUCTURE OF QUALITY CIRCLE IN INDIVIDUAL DEPT. COORDINATOR HOD FACILITATOR LEADER / DY.LEADER MEMBERS POTENTIAL MEMBERS Quality Circles
  • 13.
    RANA Tech Solutions TowardsCustomer Satisfaction 13 How does Quality Circle function They meet regularly & periodically, once in a week for one hour. How many members should be there in a circle? 5 to 7 members What are the principle components of Quality Circle? 1. Regular Q.C meetings 2. Training in problem solving tools, 3. Management presentation 4. Review & monitoring of steering committee. Quality Circles
  • 14.
    RANA Tech Solutions TowardsCustomer Satisfaction 14 Role of leaders 1) Leader / Deputy Leader chosen by QC members. 2) Should be trained in leadership and skills. 3) Should lead the team and not dominate the proceedings. 4) Should be highly disciplined and regular in meetings. 5) Should have technical knowledge, knowledge of QC techniques, etc. 6) Should plan and assign role to members. 7) Should prepare the QC team for presentations. Quality Circles
  • 15.
    RANA Tech Solutions TowardsCustomer Satisfaction 15 Role of Members 1) Becoming a member of Quality Circle is voluntary. 2) All member from grass root level and from one area of work. 3) Leadership, preferably, to be rotated among members. 4) Members to attend meetings regularly. 5) Cooperate with leader and perform assigned task. 6) Mutual respect to other members and their ideas. 7) Open discussions. 8) Do homework before every meeting. Quality Circles
  • 16.
    RANA Tech Solutions TowardsCustomer Satisfaction 16 Characteristics of meeting • Punctuality and discipline. • Commitment to task. • Openness. • Conflict of ideas, not persons. • Constructive criticism. • Agreement by consensus. • Action plan after meeting. Quality Circles
  • 17.
    RANA Tech Solutions TowardsCustomer Satisfaction 17 Take action Decide on the objectives and targets Decide method of achieving the objective Carry out education and training Do the work Check the result PLAN DO ACT CHECK Quality Circles
  • 18.
    RANA Tech Solutions TowardsCustomer Satisfaction 18 12 steps Methodology Follow up Review 12 11 10 9 8 7 6 5 4 3 2 1 Action (Control) Plan Check Do (Collect data) Identify work related problems Selectio n of problem Develop Solution Foresee Resistan ce and Prepare Trial Implemen -tation Regular Implemen- tation Quality Circles
  • 19.
    RANA Tech Solutions TowardsCustomer Satisfaction 19 12 steps for problem solving 1. Identification of work Related problems 2. Selection of problem 3. Define the problem 4. Analyze the problem 5. Identification of causes 6. finding out the root causes 7. Data analysis 8. Developing solution 9. Foreseeing probable resistance 10. Trial implementation 11. Regular implementation 12. Follow-up & review Quality Circles
  • 20.
    RANA Tech Solutions TowardsCustomer Satisfaction 20 12 steps for problem solving Sl.No Problem Individual Group 1 Problem Identification 2 Problem selection 3 Data collection 4 Analysis 5 Idea generation through Brain storming of cause and Effect diagram 6 Identifying the cause / causes 7 Brain storming for alternative solution 8 Choosing the solution on merits 9 Presentation to Management ( all participating ) 10 Implementation 11 Check performance 12 Monitor Control system Quality Circles
  • 21.
    RANA Tech Solutions TowardsCustomer Satisfaction 21 Tool used : Brain storming Problem’s at work area are identified and listed out. Same problems to be divided into ‘A’, ‘B’ and ‘C’ category for easy segregation and attending the problems. ‘A’ category problems : Minimum involvement of other departments in solving them. ‘B’ category problems : Involvement of other department is a necessity ‘C’ category problems : Management sanction may be needed in implementing the solution in the beginning of Quality circle it is always better to take ‘A’ type problems which involves the department people only STEP # 1 : IDENTIFICATION OF WORK RELATED PROBLEMS Quality Circles
  • 22.
    RANA Tech Solutions TowardsCustomer Satisfaction 22 Tool used : Ranking analysis, Priority number, Pareto analysis 1.Among the ‘A’, ‘B’ and ‘C’ category problems 2.One category to be choose for selection of problem. 3.Ranking to be given to all the problems in that category based on the importance of the problem. 4.Top ranked 4 to 5 problems to be listed out and priority analysis to be done for these problem by giving scores. STEP # 2 : SELECTION OF PROBLEM 33 2 1 2 7 12 17 22 27 32 37 No. of Problems A B C Quality Circles
  • 23.
    RANA Tech Solutions TowardsCustomer Satisfaction 23 SELECTION OF PROBLEM BY RANKING METHOD : RANKING : 1 = Least Priority , 5 = High Priority Problem No. – 7 & 8 is selected for Project as highest ranking given by Team RANKING : 1 = Least Priority 5 = High Priority SCALE S.# Major Problems MEMBERS TOTAL scoreM1 M2 M3 M4 M5 1 Coil cut 3 2 5 3 3 16 2 Improper weld joint (loop joint failure) 4 5 5 4 5 23 3 No. of joints in stator ( HV ) 4 5 4 4 4 21 4 Loose wiring touching to lamination 4 3 5 4 3 19 5 Spools collar radius 1 2 2 1 2 8 6 Lamination core problem 1 3 2 1 2 9 7 Method of Handling after Varnishing 5 4 5 5 5 24 8 After Looping Wire cut and touches to shaft body 5 5 5 5 5 25 Example : Ranking Method Quality Circles
  • 24.
    RANA Tech Solutions TowardsCustomer Satisfaction 24 Tool used : Flow diagram, Brain storming Even through people are from the same area it does not mean that all have a clarity about the problem selected So it is necessary to define the problem. The best way to do is using a ‘Flow Diagram’ showing the entire process related to that area and indicating the problem spot. Reason for selection of problem : Why this problem is selected? Different reasons for the selection of problems to be noted down STEP # 3 : DEFINING THE PROBLEM Looping Shaft Pressing Wire pulling Winding Inspection Varnishing Grinding Inspection Quality Circles
  • 25.
    RANA Tech Solutions TowardsCustomer Satisfaction 25 Tool used : Data collection In order to find the magnitude of the problem data to be collected regarding the problem. STEP # 4 : IDENTIFICATION OF WORK RELATED PROBLEMS STATOR NC & HV REWORK % TREND 10.37 7.19 8.75 0 2 4 6 8 10 12 Month Rew% TOTAL RE-WORK % 10.37 7.19 8.75 NOV '11 DEC '11 JAN '12 ANALYSIS : Data collection of Last three months from Nov’ 2011 to Jan’ 2012 PROBLEM : Based on the analysis of data collected it was found that No Continuity (4.07%) & High Voltage(4.44%) in Stator is upto 8.51% (Avg. 3 Months ) Quality Circles
  • 26.
    RANA Tech Solutions TowardsCustomer Satisfaction 26 Tool used : Brain storming, Cause & Effect diagram Different reasons for the problem to be identified by using the Cause & Effect diagram. Effect Man Machine MethodMaterial Reasons for the problem to be listed out under four categories Man, machine, Material and method. STEP # 5 : IDENTIFICATION OF CAUSES Quality Circles
  • 27.
    RANA Tech Solutions TowardsCustomer Satisfaction 27 Tool used : Brain storming, data collection To know the main root cause data collection to be done on the main reasons listed out in the Cause & Effect diagram. 1. Pareto diagram to be made for the collected data 2. Through pareto diagram, main root cause which can be 1 or 2 for the problem will be identified STEP # 6 : FINDING OUT ROOT CAUSE Quality Circles
  • 28.
    RANA Tech Solutions TowardsCustomer Satisfaction 28 Tool used : Line graph, Bar graph, Pie graph Stratification and scatter diagram Collection of data for analyzing the problem under different reasons STEP # 7 : DATA ANALYSIS Quality Circles
  • 29.
    RANA Tech Solutions TowardsCustomer Satisfaction 29Quality Circles Tool used : Brainstorming 1. We need some solutions to solve the problem. So, brain storming to be done among the circle members for developing the solution. 2. Different solutions to be listed out. Then one by one solution to be discussed with respective problem and to be accepted if all the members feel that problem will be solved by that solution. 3. If any solution is not accepted same will be rejected STEP # 8 : DEVELOPING SOLUTIONS
  • 30.
    RANA Tech Solutions TowardsCustomer Satisfaction 30Quality Circles STEP # 08 : DEVELOPING SOLUTIONS
  • 31.
    RANA Tech Solutions TowardsCustomer Satisfaction 31Quality Circles Why – Why Analysis for After Wire pulling No continuity & High voltage of stator : CAUSE : After Wire pulling NC & HV is more Why ? After wire pulling NC & HV is more ? During wire pulling wire cut happening. WHY ? During wire pulling wire cut happening.? Due to burr inside the shaft WHY? Burr inside the Shaft ? Burr is not removed after chamfering at supplier End Why? Burr is not removed after chamfering at supplier End? No proper control at supplier End at chamfering operation. WHY ? No proper control at supplier end at chamfering operation? proper identification to be provided after chamfering. Why – Why Analysis
  • 32.
    RANA Tech Solutions TowardsCustomer Satisfaction 32Quality Circles Tool used : Brainstorming 1. Identifying the probable constraints and finding ways to overcome them. 2. Make a presentation to all involved with the solution. That is department head, facilitator other officials and non-members involved with the implementation. Discuss and evaluate a system for implementation. STEP # 9 : FORESEEING PROBABLE RESISTANCE
  • 33.
    RANA Tech Solutions TowardsCustomer Satisfaction 33Quality Circles 1. Discuss with H.O.D and all department people regarding the trial. 2. Developed solution to be implemented as a trial and results to be studied. 3. Data collection after implementation compared with the data collected before solving the problem. If performance is good regular implementation to be done. STEP # 10 : TRIAL IMPLEMENTATION & CHECK PERFORMANCE
  • 34.
    RANA Tech Solutions TowardsCustomer Satisfaction 34Quality Circles If improvement is observed after trial implementation, then regular implementation to be done STEP # 11 : REGULAR IMPLEMENTATION
  • 35.
    RANA Tech Solutions TowardsCustomer Satisfaction 35Quality Circles 1. Results before regular implementation & after regular implementation to be compared. 2. Schedule checks to be done every one or two months and see the consistency of results Standardize all the procedure that are implemented STEP # 12 : FOLLOW UP / REVIEW
  • 36.
    RANA Tech Solutions TowardsCustomer Satisfaction 36Quality Circles Now problem is selected. What is the time taken to solve the problem ? That is mile stone chart. Mile stone chart is prepared after selection of problem. Project study planning is an effective method by which Quality circle members attain the skill. To plan their activities and effective time management. MILESTONE CHART
  • 37.
    RANA Tech Solutions TowardsCustomer Satisfaction 37Quality Circles MILESTONE CHART 1 2 1 2 1 2 1 2 1 2 1 2 PLAN ACTUAL PLAN ACTUAL PLAN ACTUAL PLAN ACTUAL PLAN ACTUAL PLAN ACTUAL PLAN ACTUAL PLAN ACTUAL PLAN ACTUAL PLAN ACTUAL PLAN ACTUAL PLAN ACTUAL CHECK 10 TRIALIMPLEMENTATION AND CHECKPERFORMANCE ACT 11 REGULAR IMPLEMENTATION 12 FOLLOW-UP &REVIEW 7 ANALYZINGTHEDATA DO 8 DEVELOPINGSOLUTION 9 FORESEEINGPROBABLE RESISTANCE DEFININGTHEPROBLEM 4 ANALYSIS OFPROBLEM 5 IDENTIFICATIONOF CAUSES 6 FINDINGOUTTHEROOT CAUSES APR'12 MAY'12 JUNE'12 JUL'12 PLAN 1 IDENTIFICATIONOF PROBLEM 2 SELECTIONOFPROBLEM 3 MEETINGDAY :THURSDAY TEAMNAME: USHAWONDERS TIME:2:00 TO 3:00 PM STARTED :2 February' 2012 PDCA S# STAGE PLAN/ ACTUAL FEB'12 MAR'12
  • 38.
    RANA Tech Solutions TowardsCustomer Satisfaction 38Quality Circles Tools And Techniques.. QC TOOLS 1 2 3 4 5 6 7 Check Sheet C & E diagram Stratification Graph & Control charts Scatter diagram Histogram SrUsed 3 2 1 UsedQC Techniques MILE STONE 5W-1H Principle Pareto diagram 5 4 Brain Storming # DEFECT TOTALMONTH / DEFECT IN PPM OCT ‘98 MAR ‘99FEB ‘99JAN ‘99DEC ‘98NOV ‘98 1 NOISE 137522198 24302272235023102200 2 CLUTCH ENGAGE 282964212 59444916485449123458 3 SHEAVE TIGHT 120241996 20882400189817921850 4 CLUTCH BEARING FAILURE 12024730 1976233821309501958 5 CRANK SHAFT PROBLEM 2950384 86830041424434 6 OTHERS 2954488 169427425400 TOTAL 7200010000 150001250011900131009500 0.047 0.030 0.020 0.020 0.005 0.005 39.7 58.8 75.5 92.2 96.1 0 0.02 0.04 0.06 0.08 0.1 0.12 CLUTCH ENGAGENOISECLUTCH BEARINGFAILURESHEAVE TIGHTCR. SH. PROBLEMOTHERS0 20 40 60 80 100 641632625600 0.1190.131 0.0950.1 0.13 0.15 0.1 0.15 0 0.05 0.1 0.15 Oct '98 Nov '98 Dec'98 Jan 99 0 100 200 300 400 500 600 700 0.000 0.005 0.010 0.015 0.020 0.025 65 66 67 68 69 70 71 72 73 74 75 76 77 78 79 80 4 10 18 17 10 5 0 5 10 15 20 25 15.05 15.08 15.11 15.14 15.17 15.2 15000 1250011900 13100 950010000 0 3000 6000 9000 12000 15000 18000 Oct '98Nov '98Dec '98Jan '99Feb '99Mar.99 Sr WHY WHY Analysis Data collection
  • 39.
    RANA Tech Solutions TowardsCustomer Satisfaction 39 Any Questions, ??? Thanks.