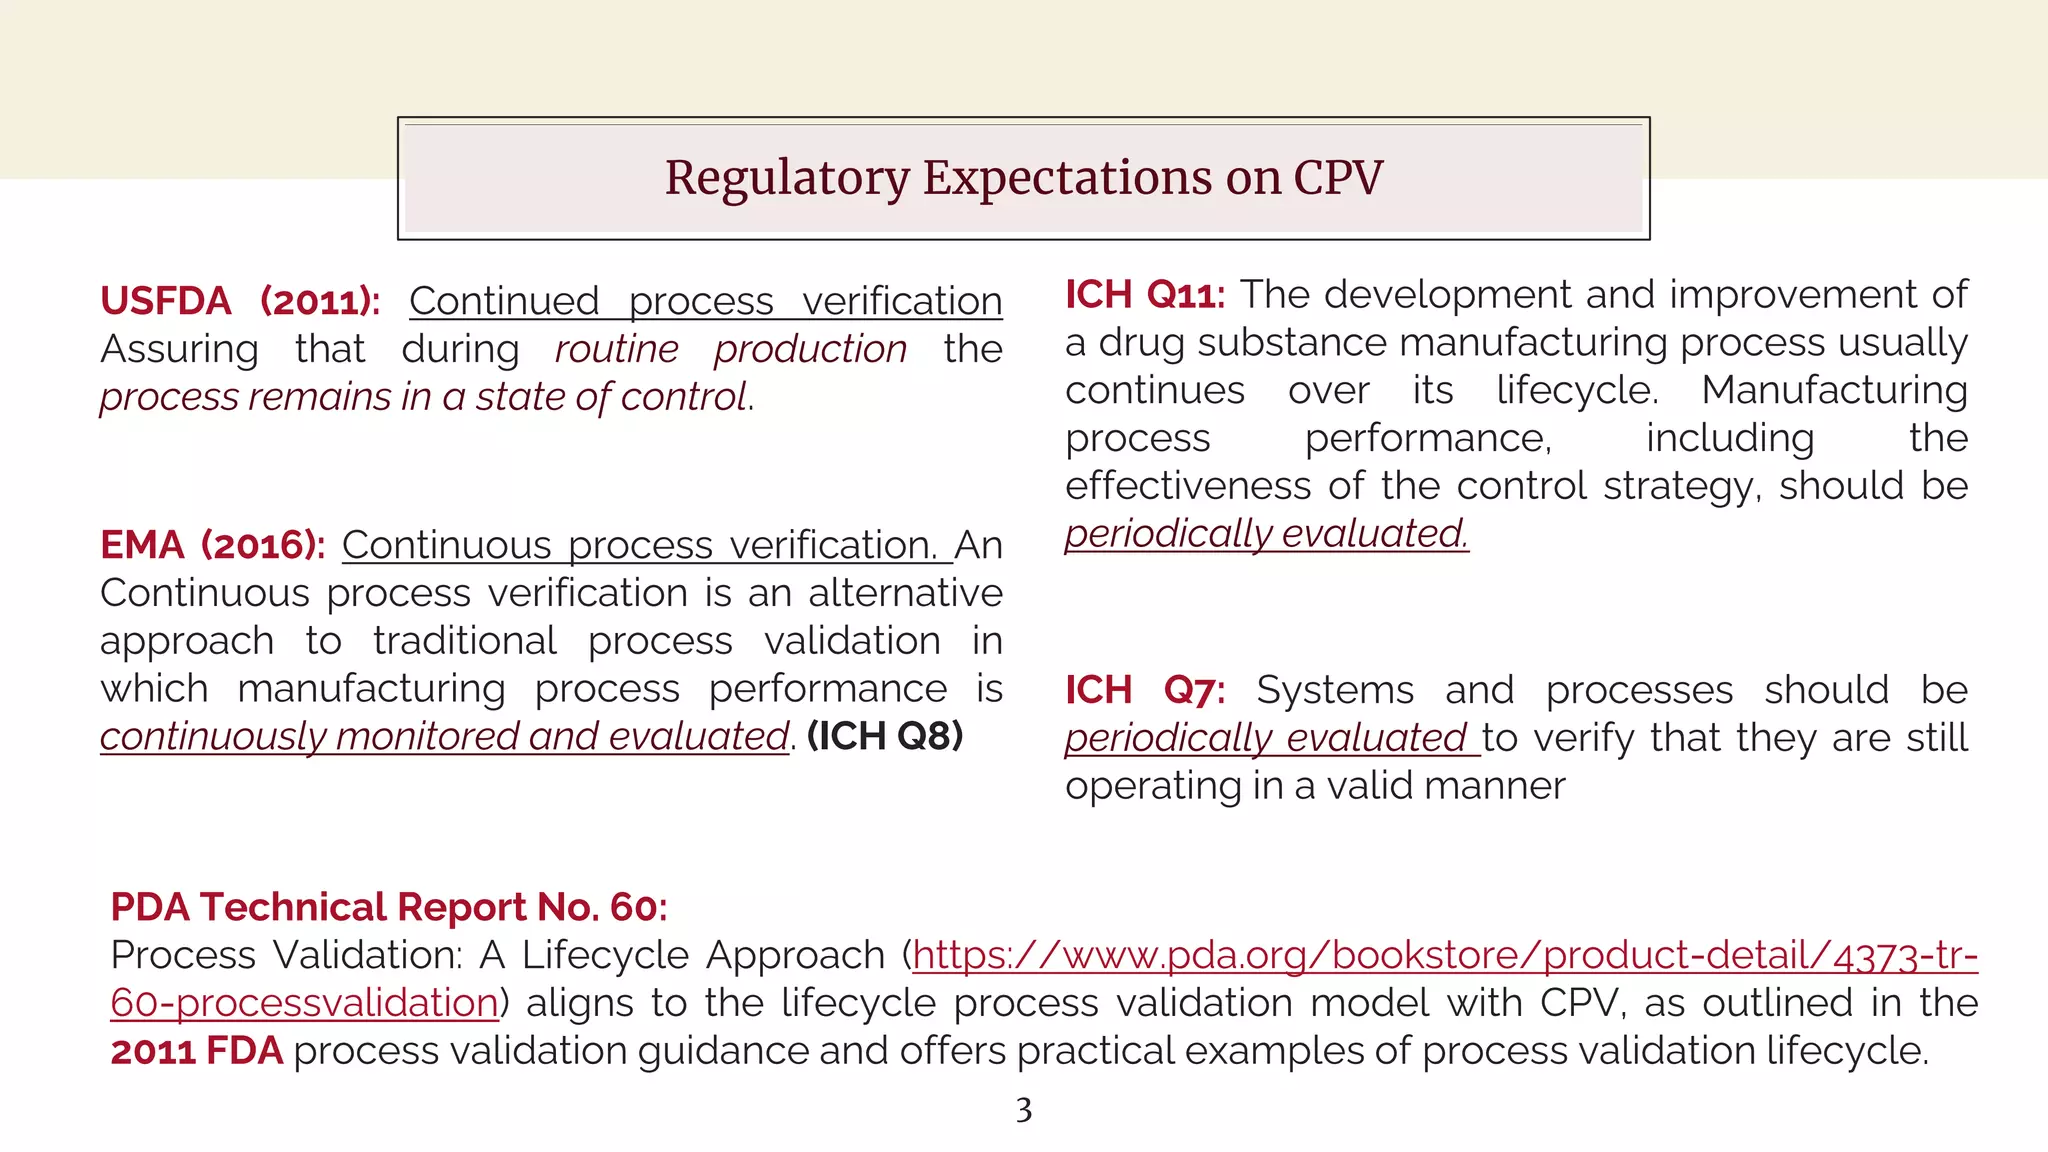
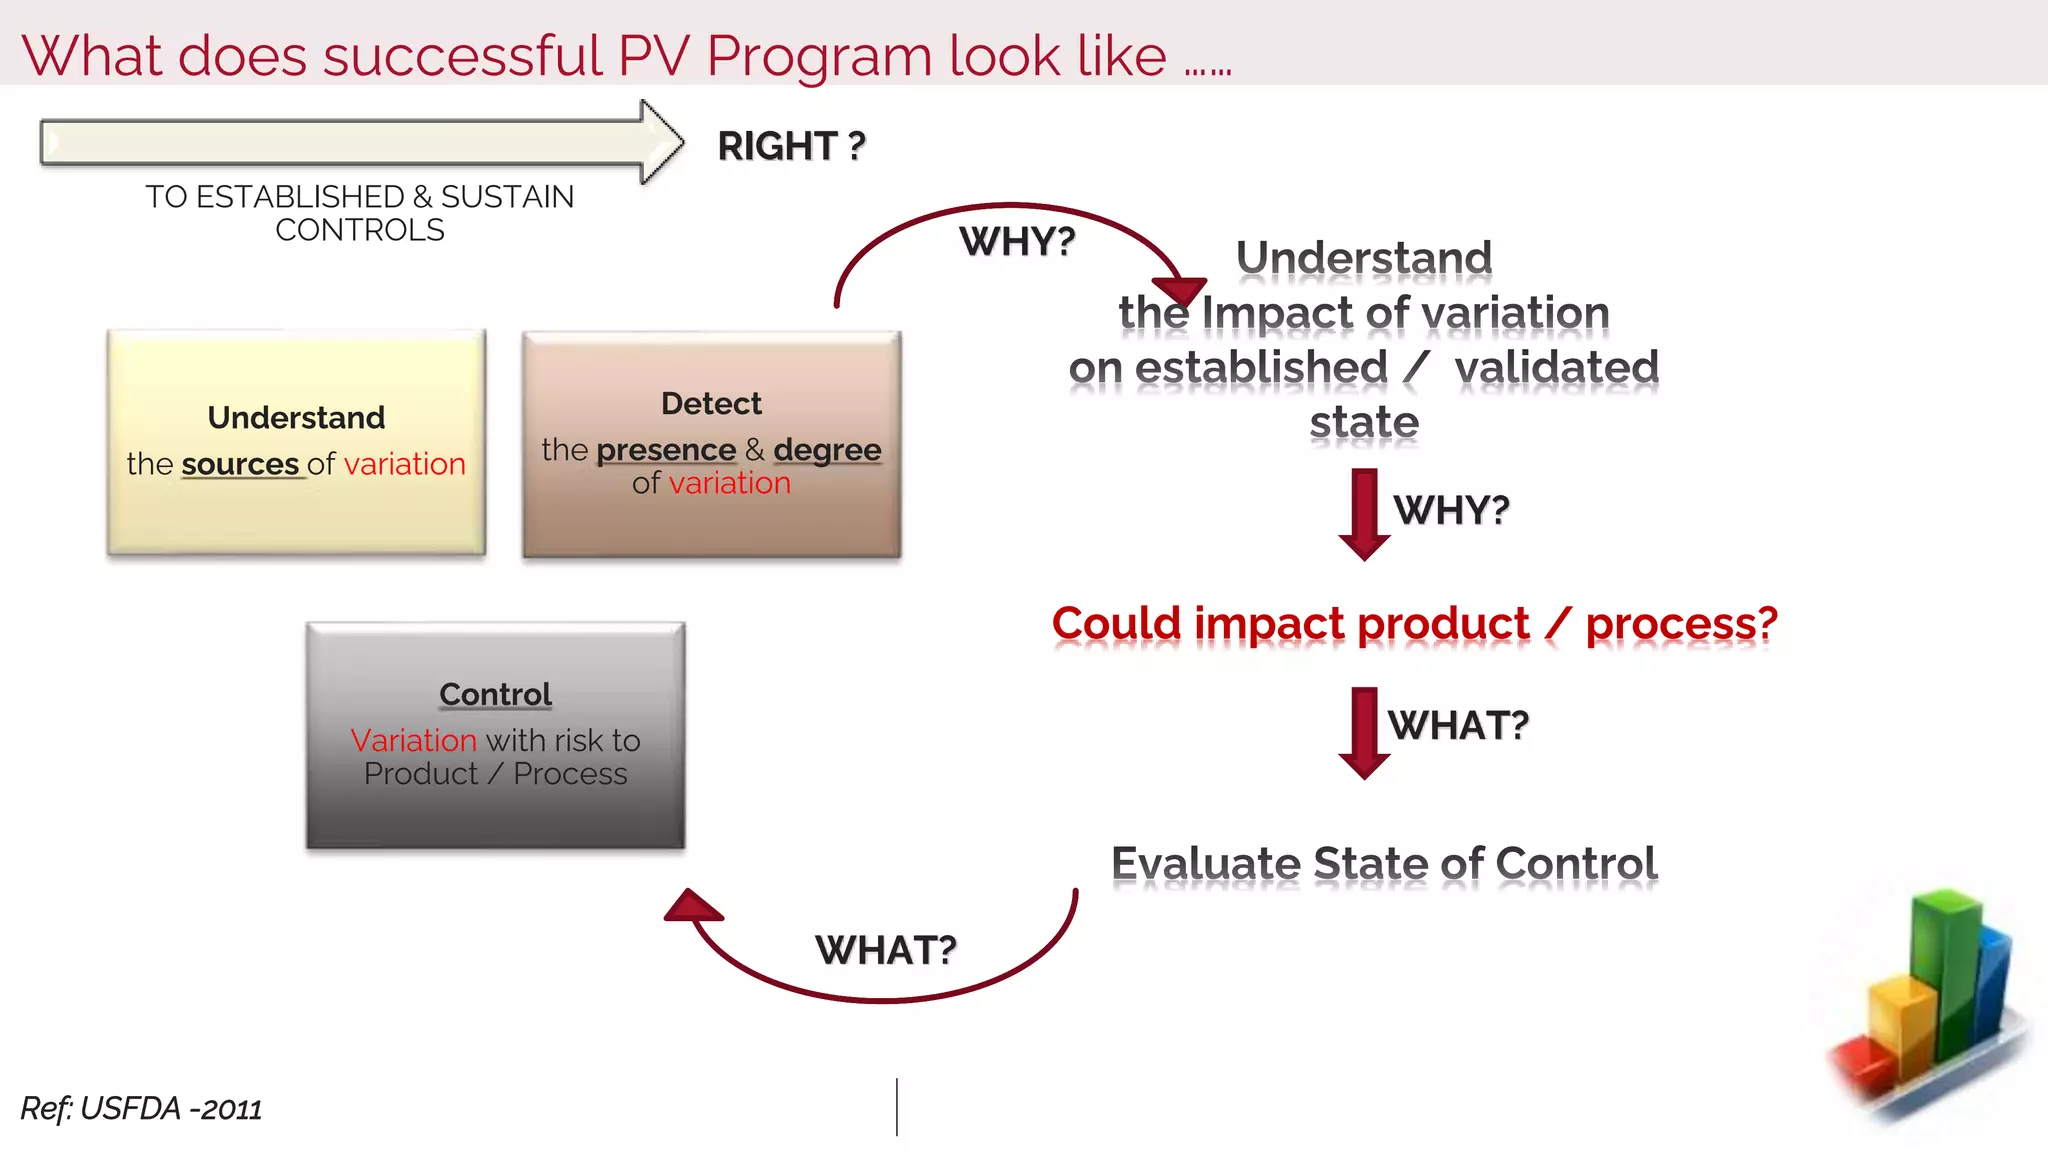
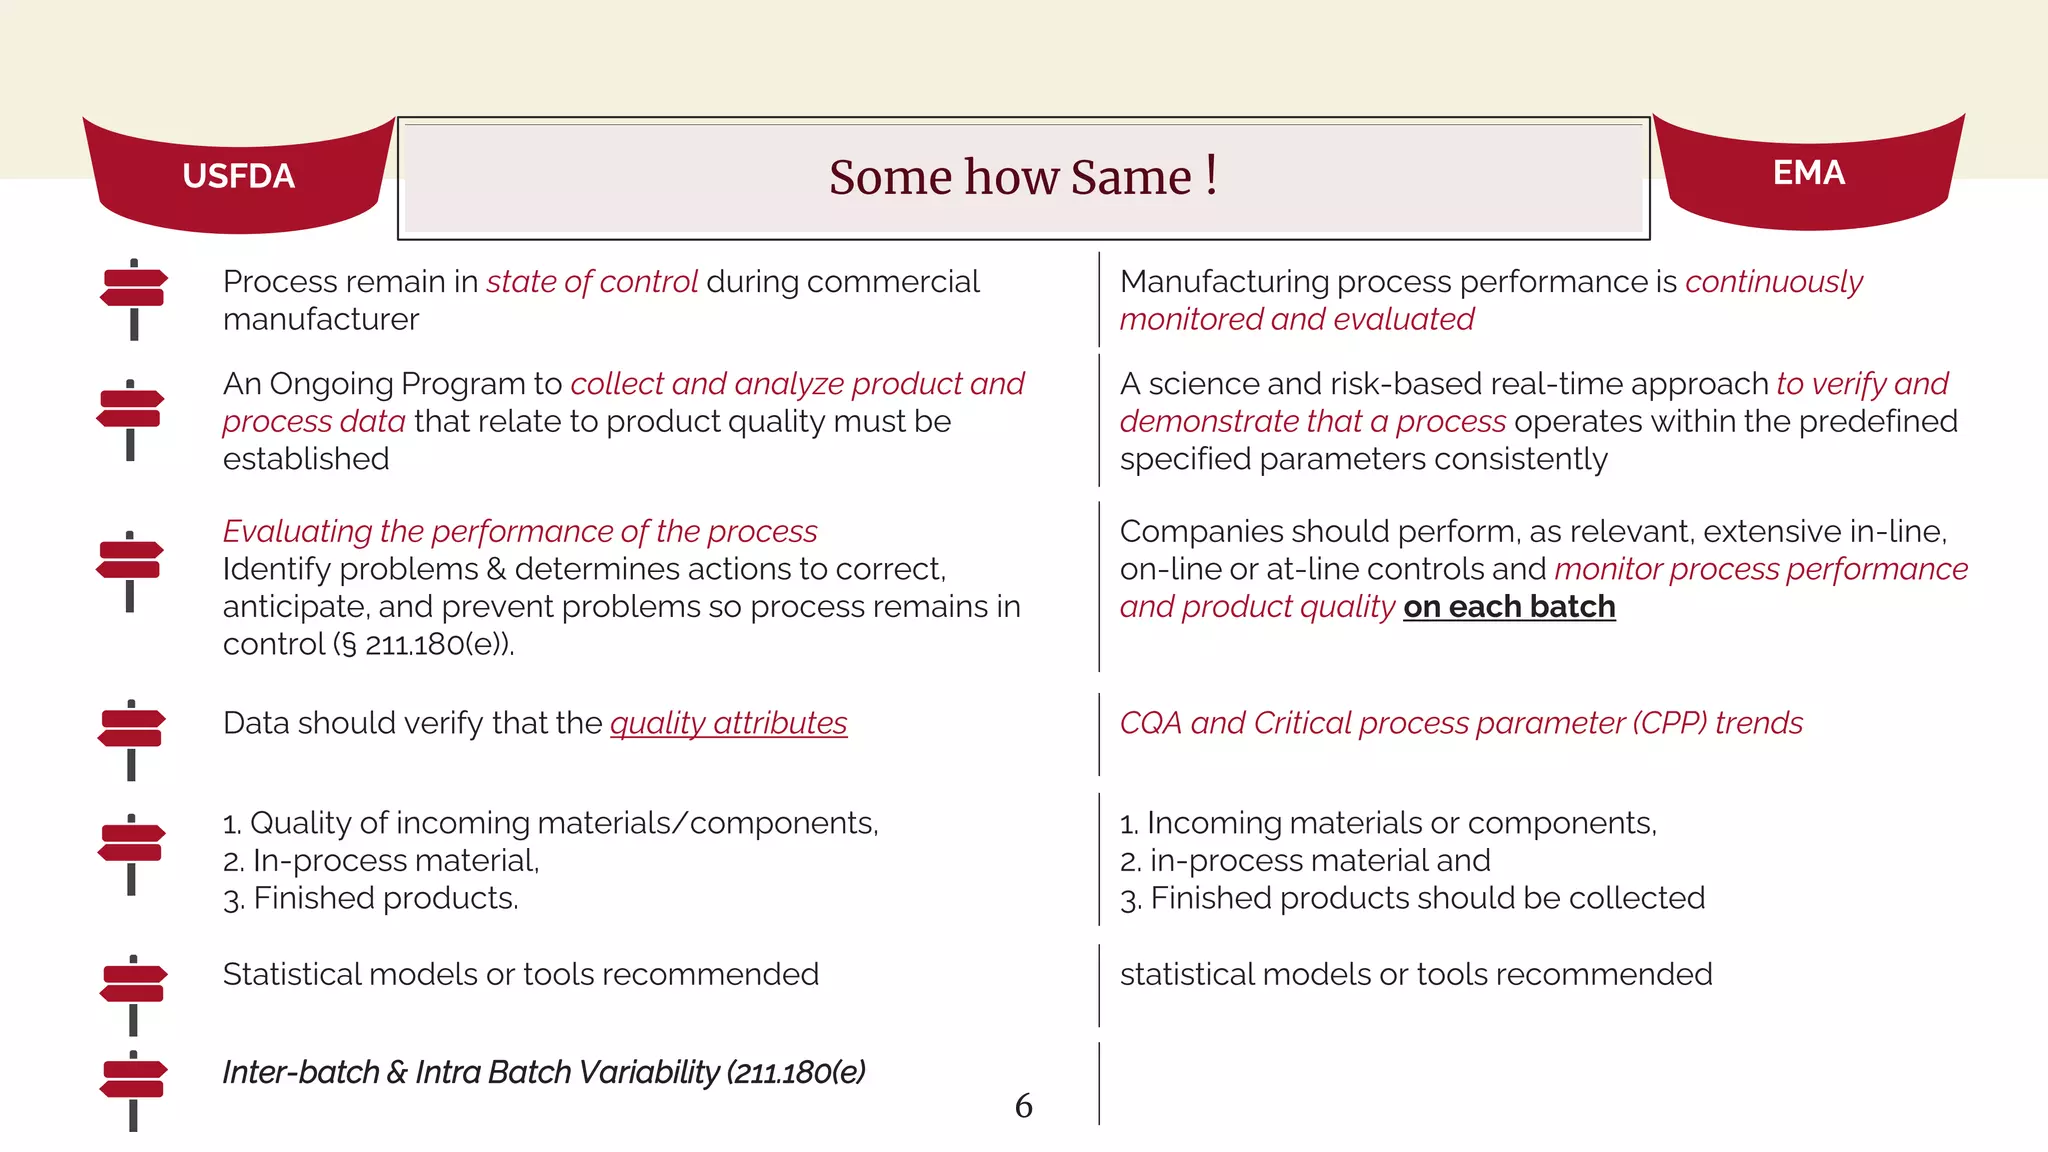
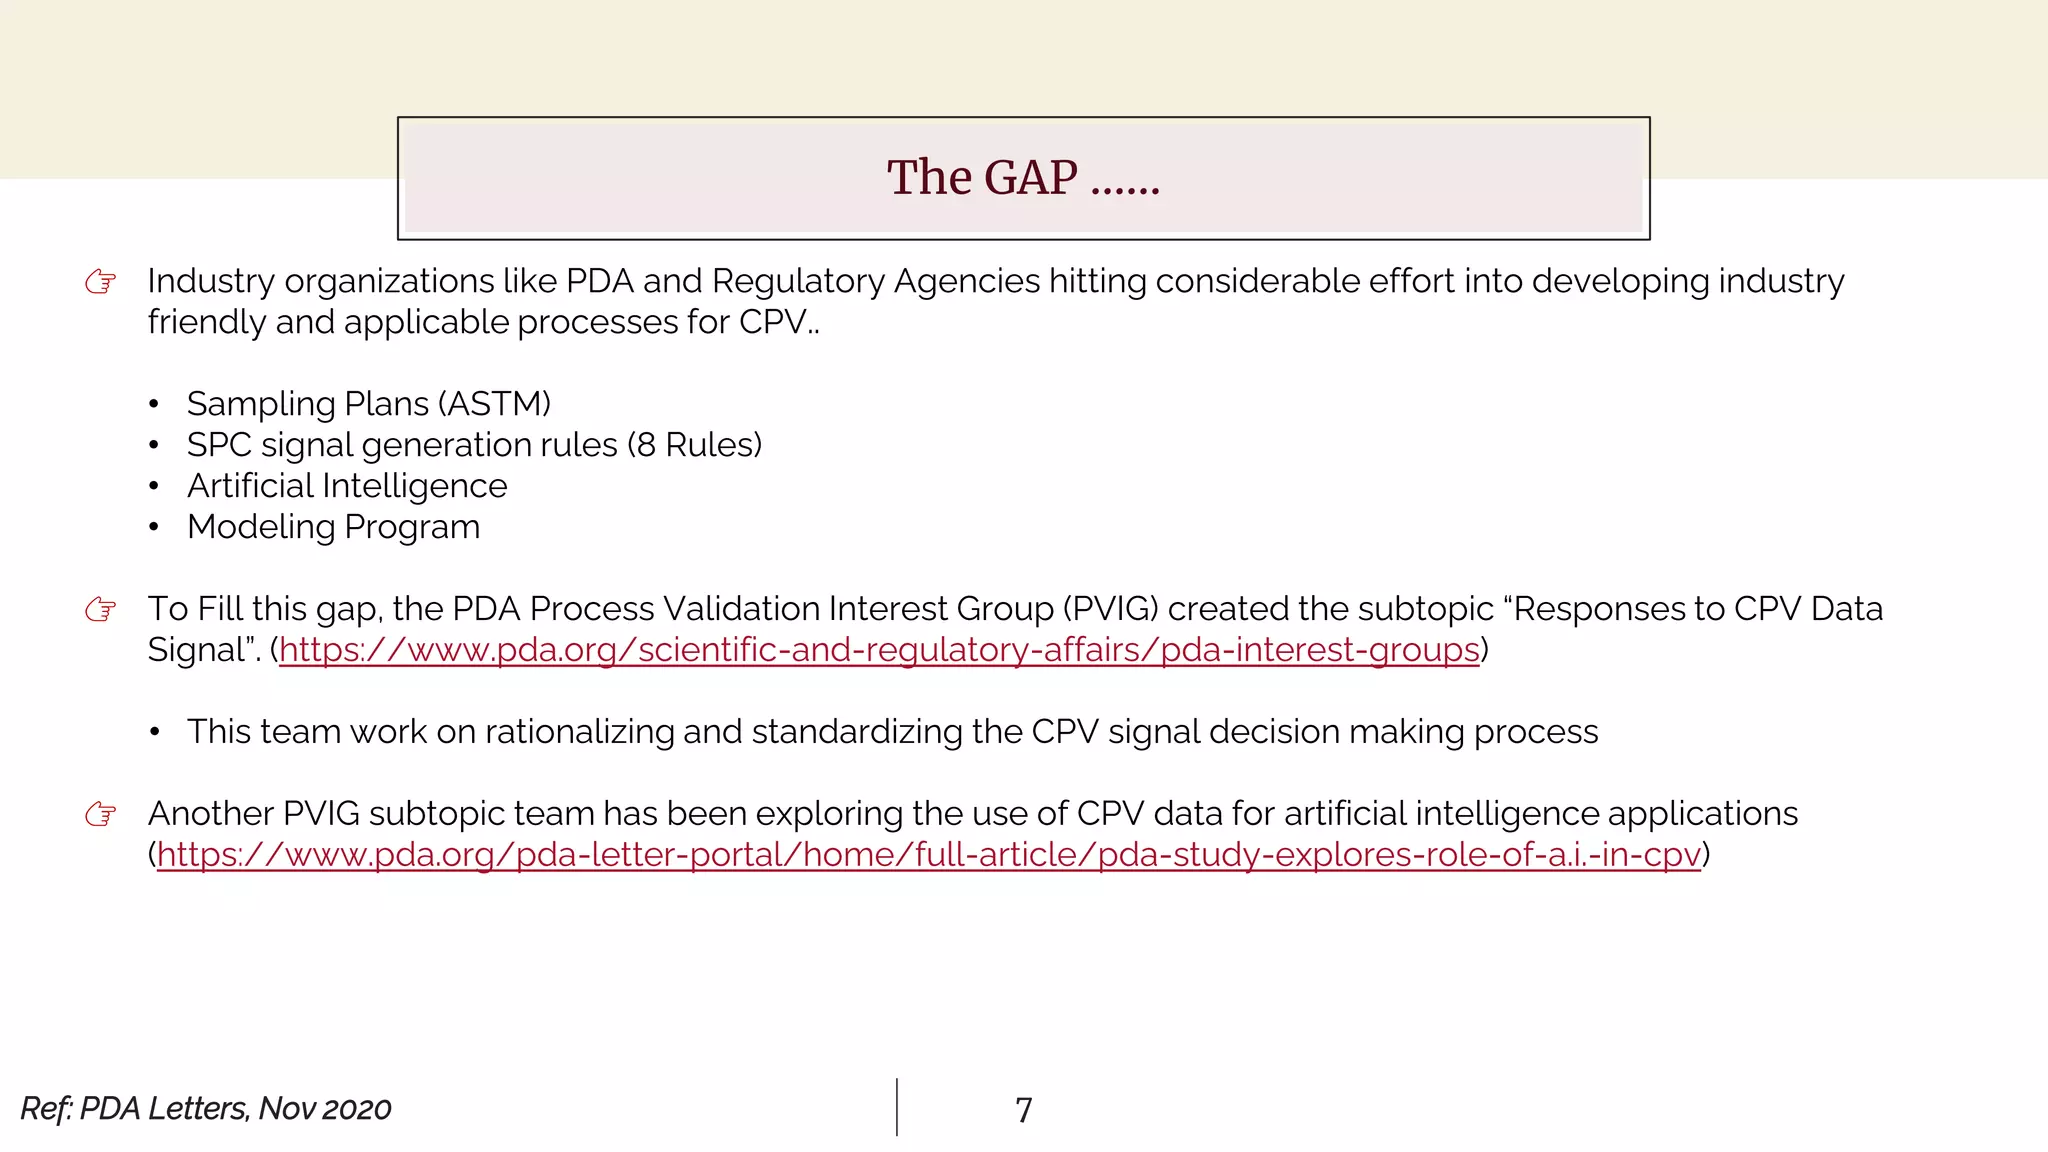
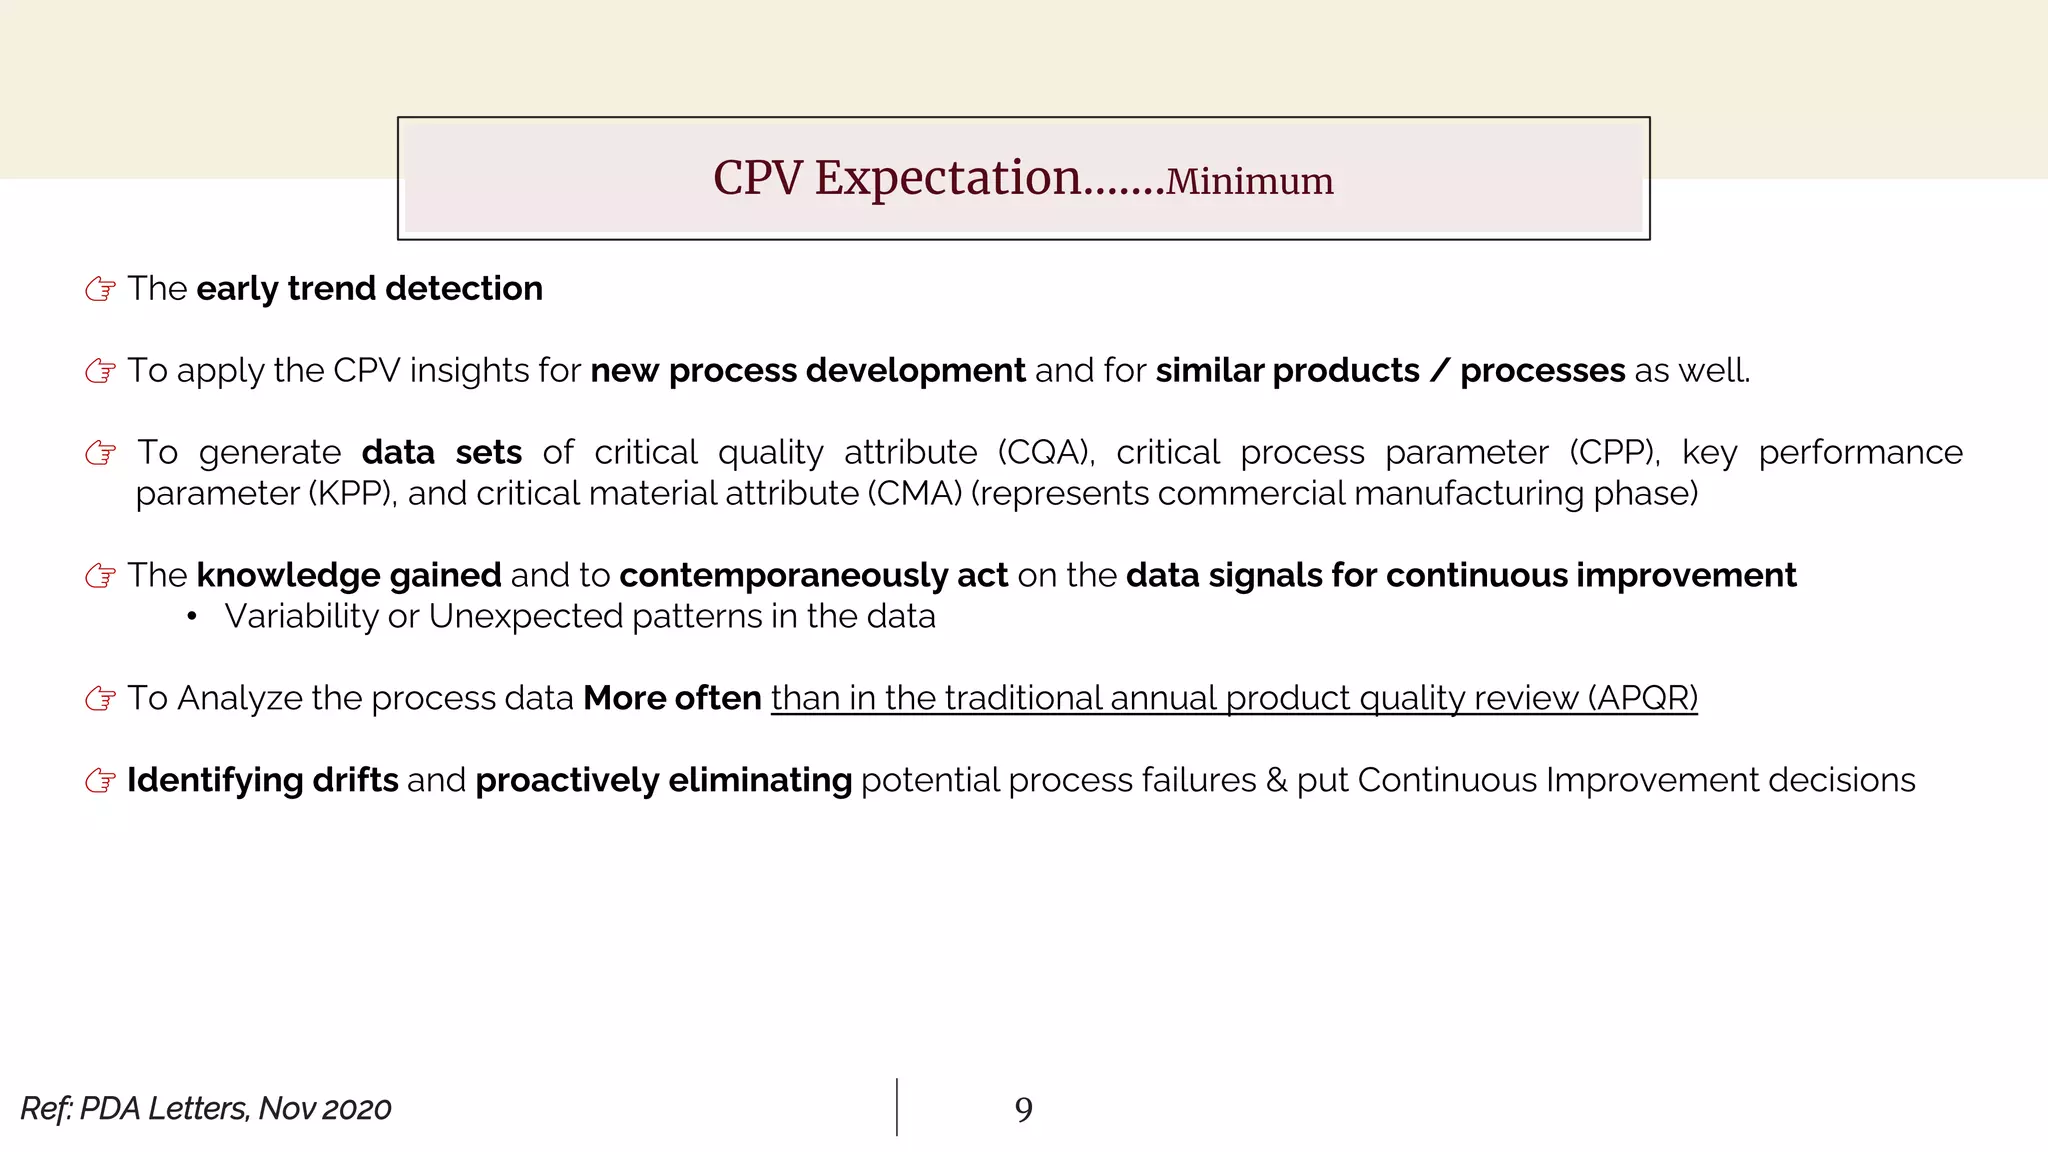
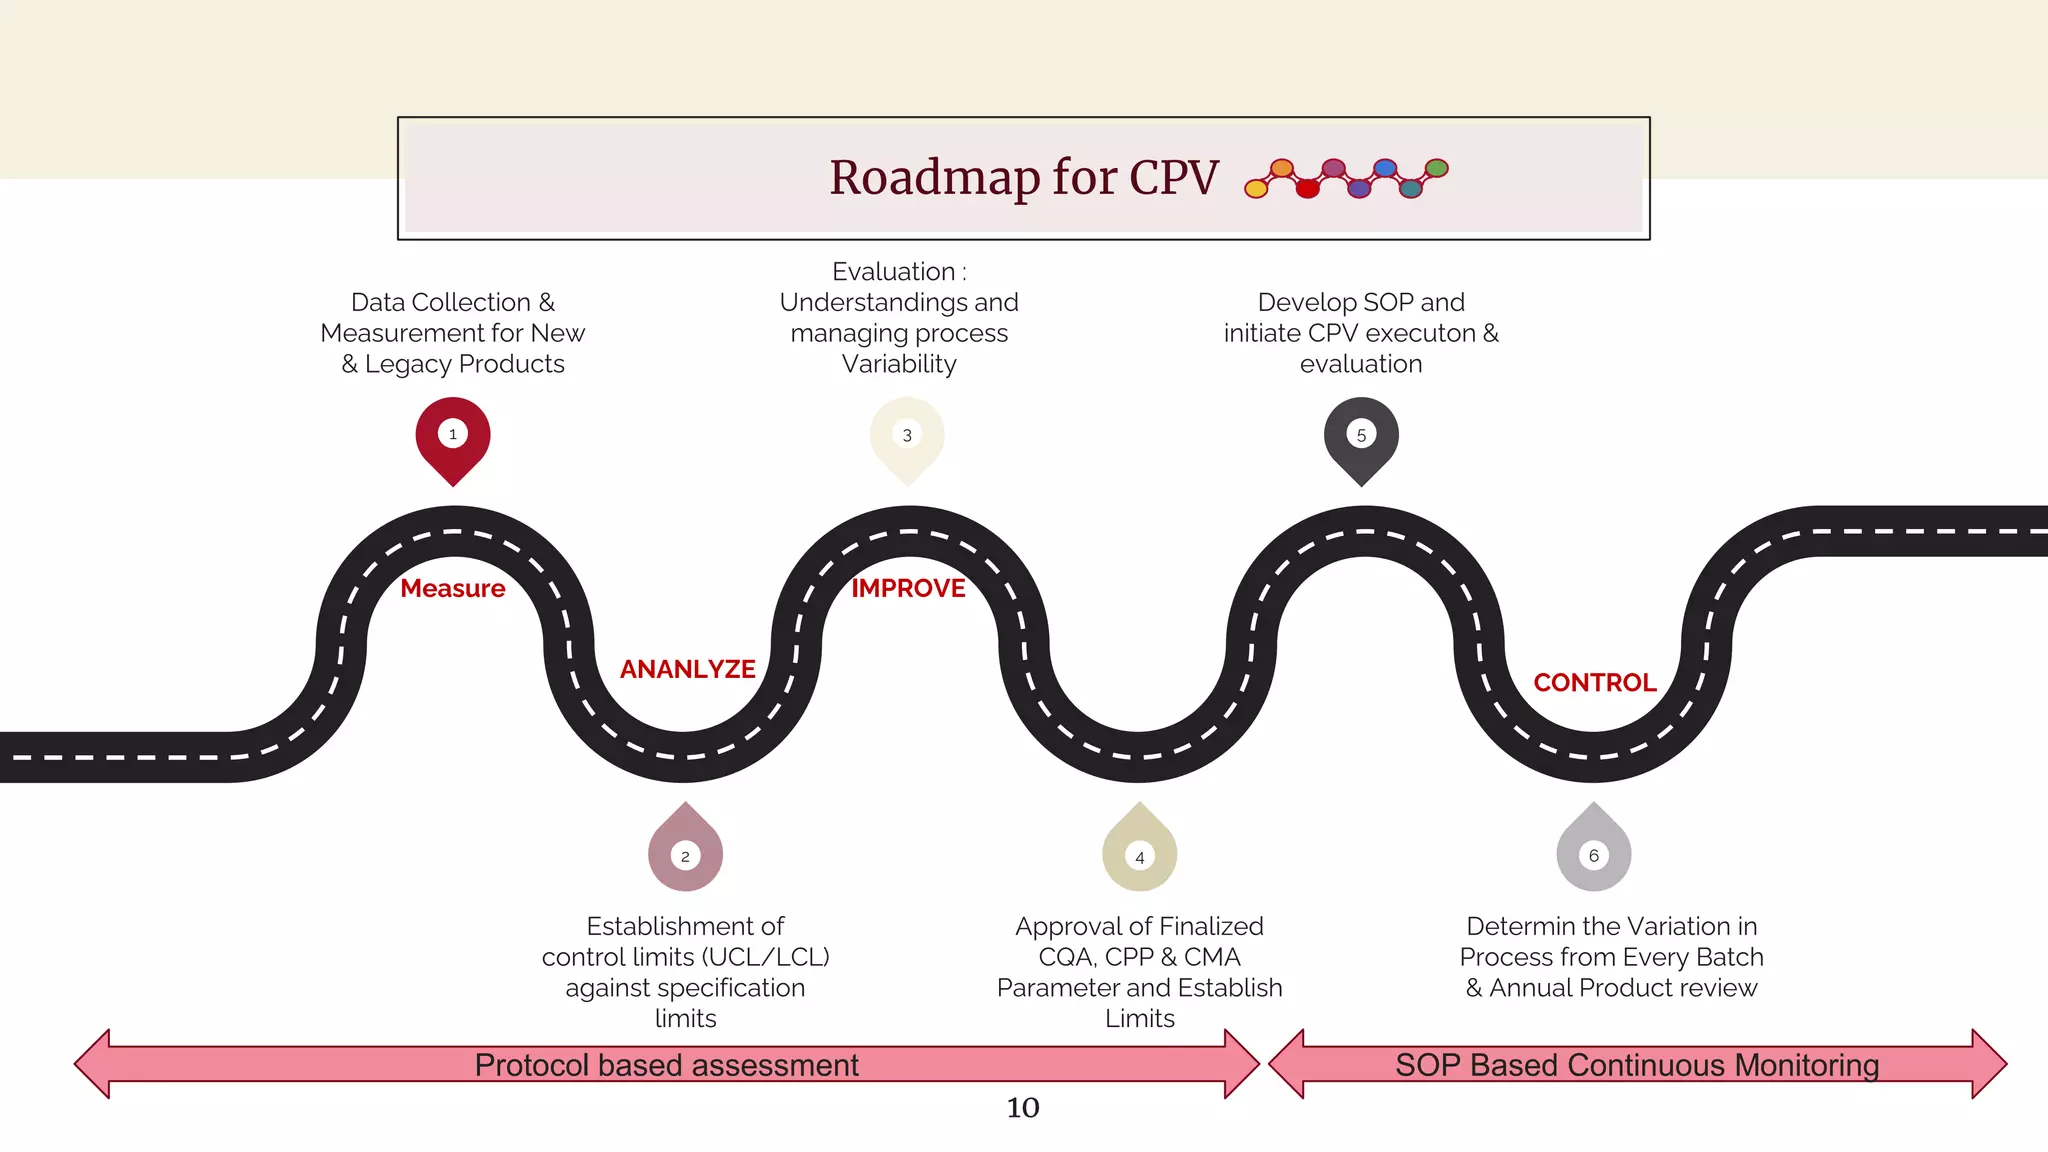
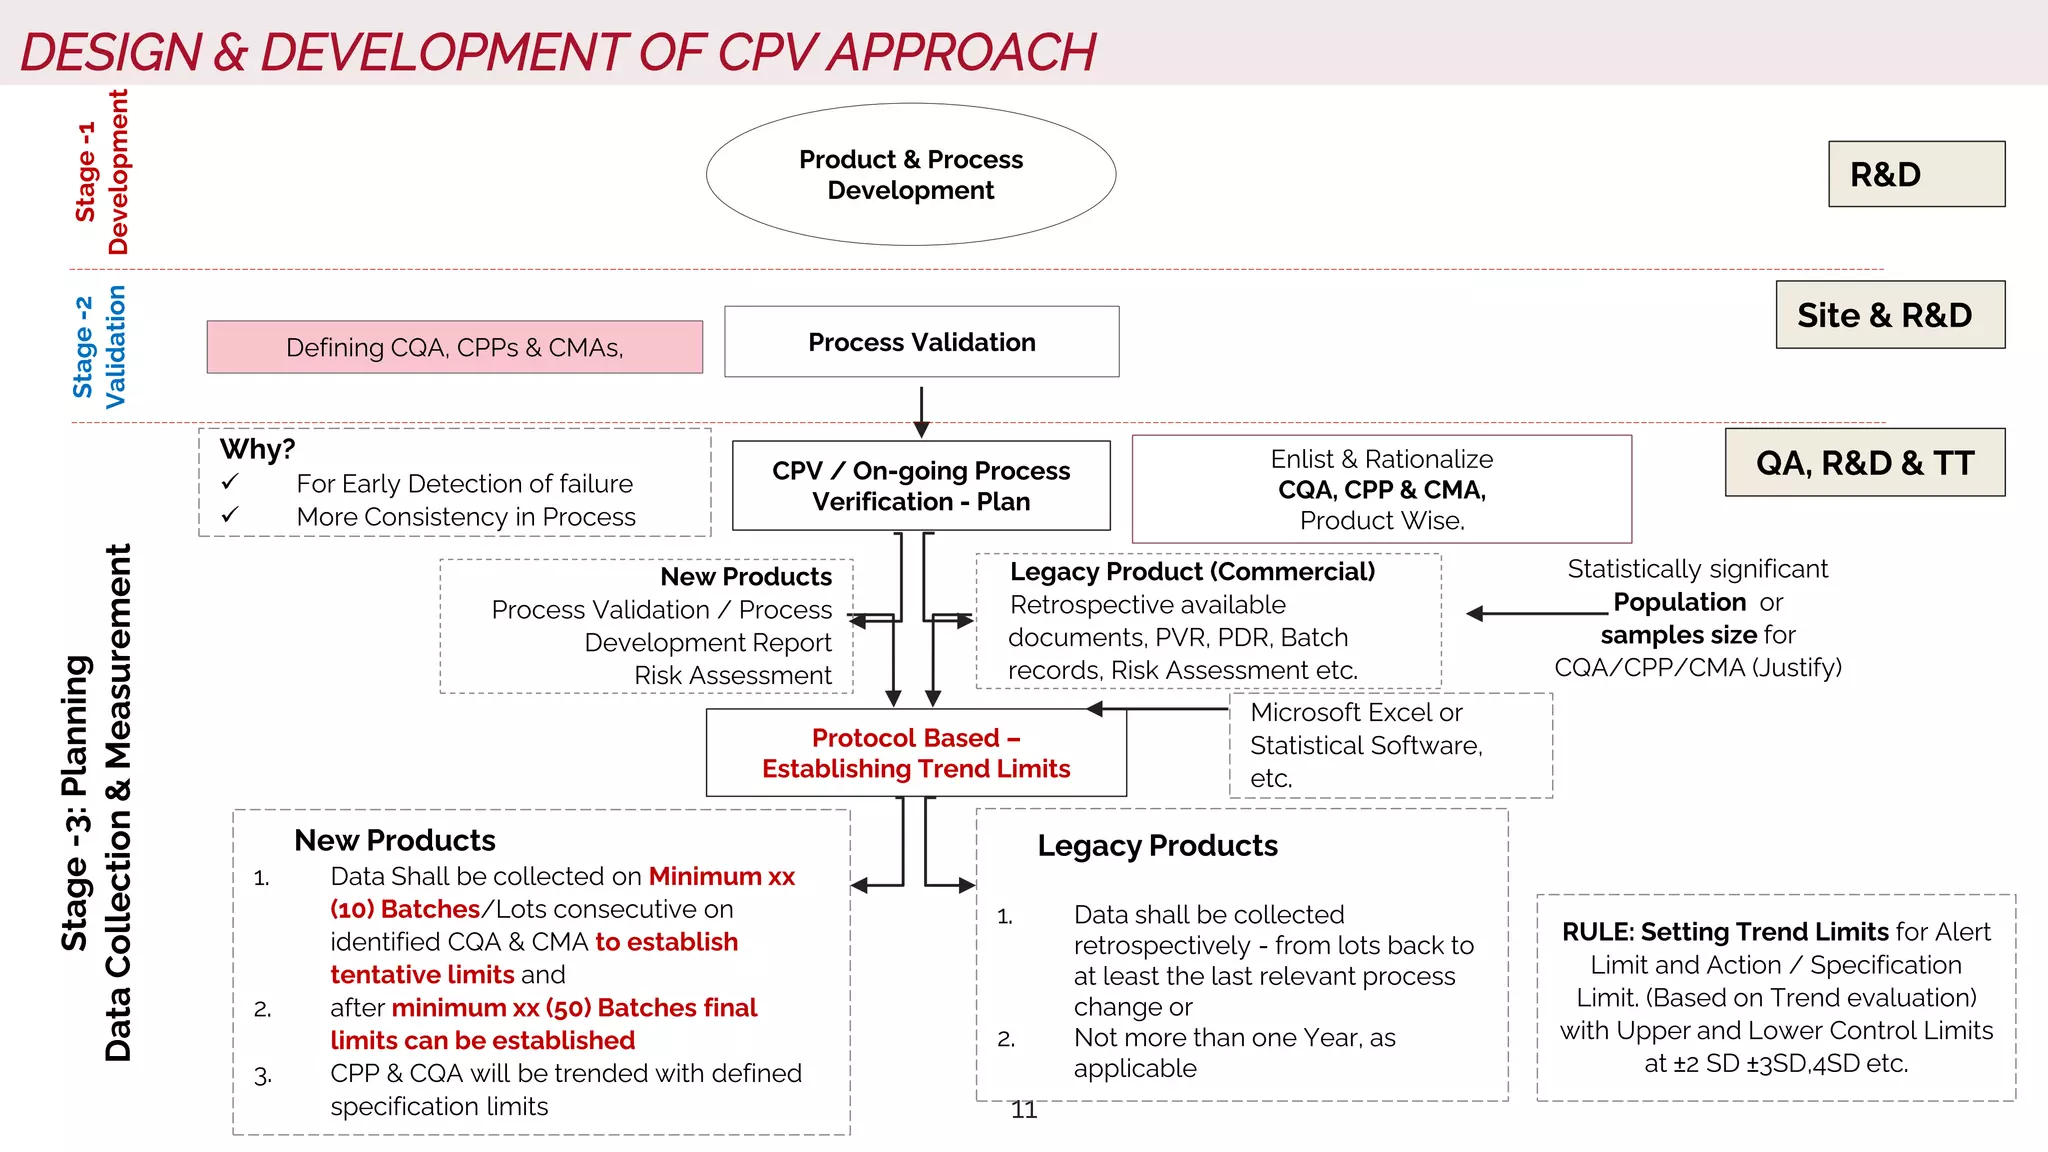
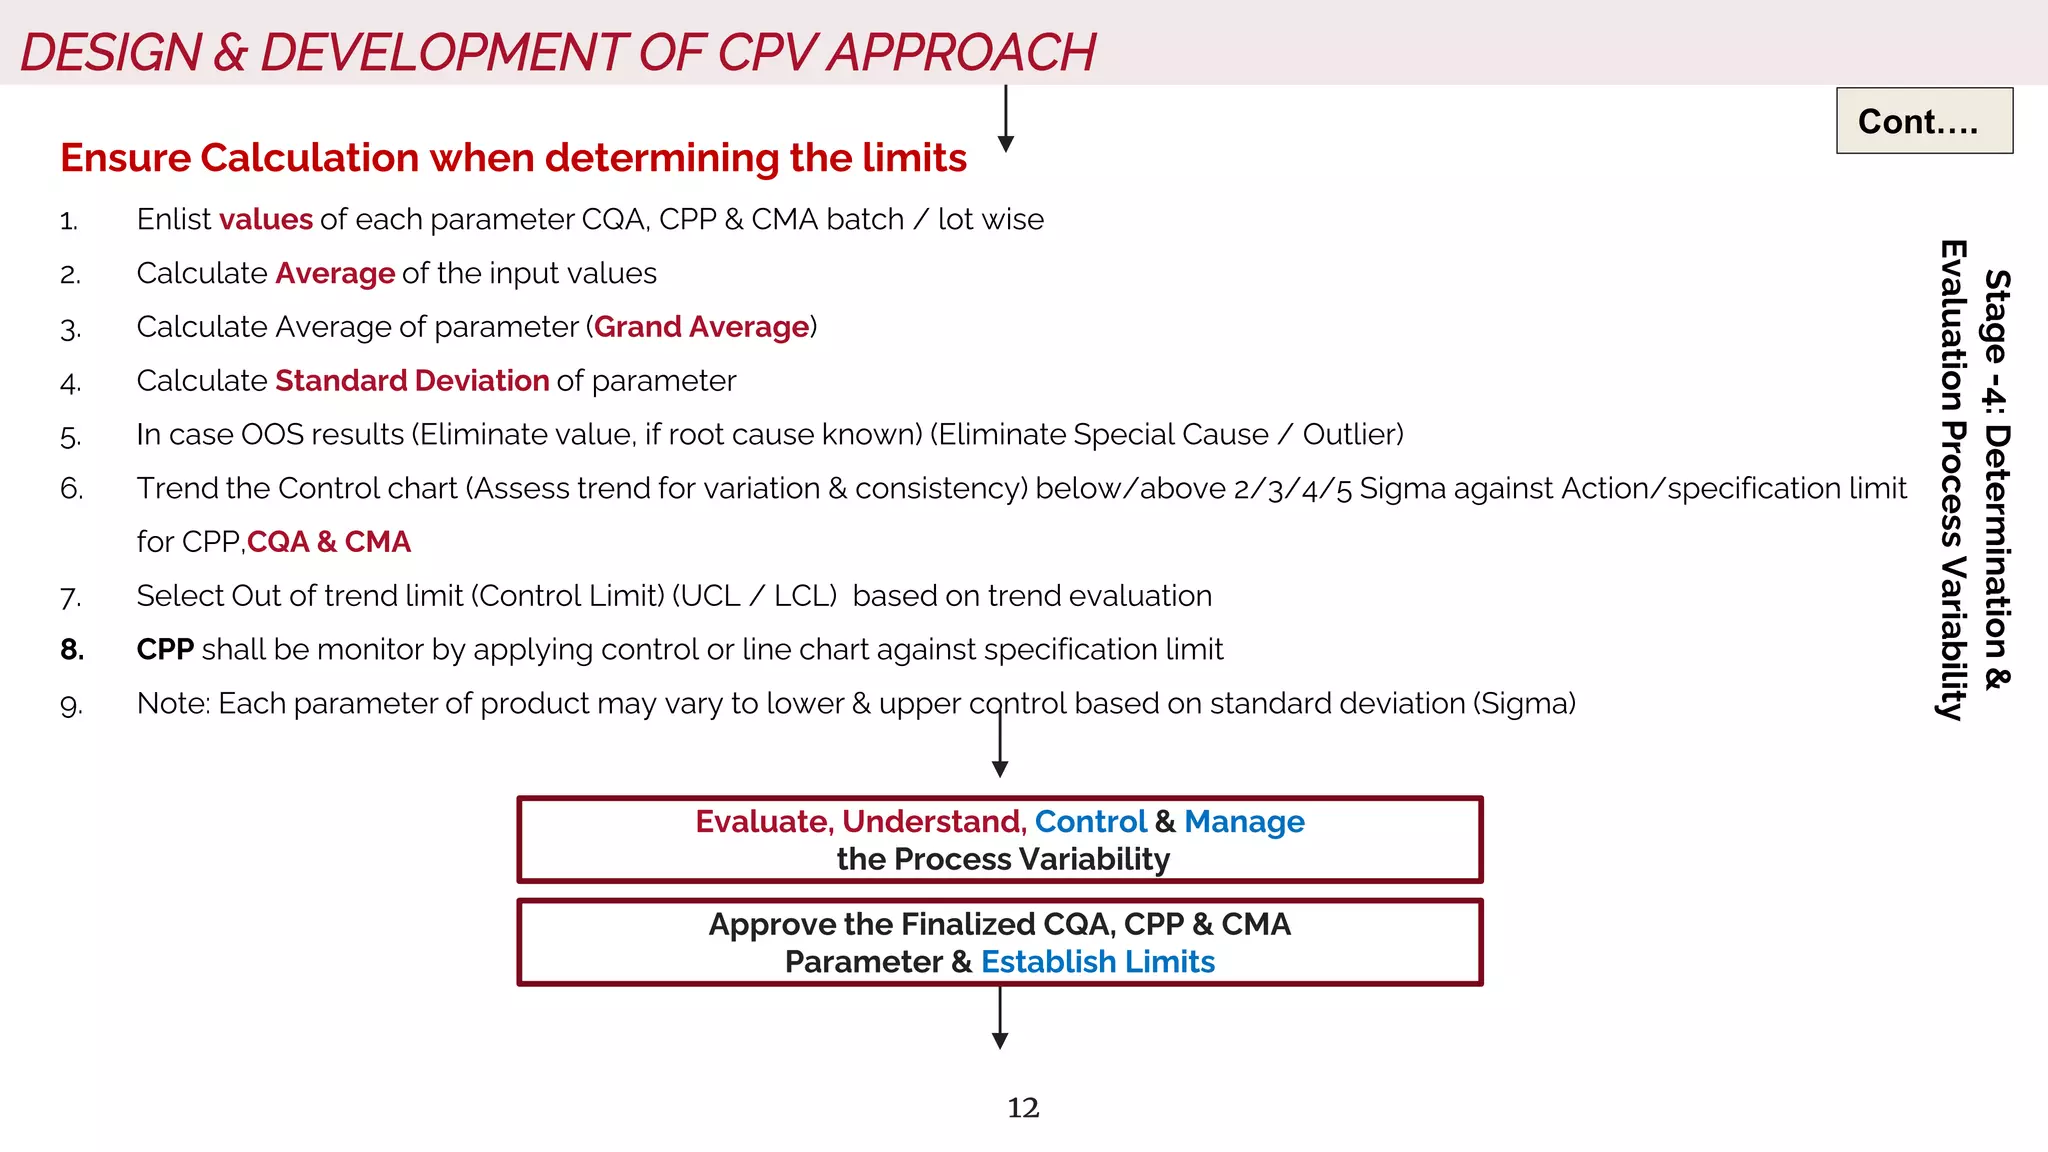
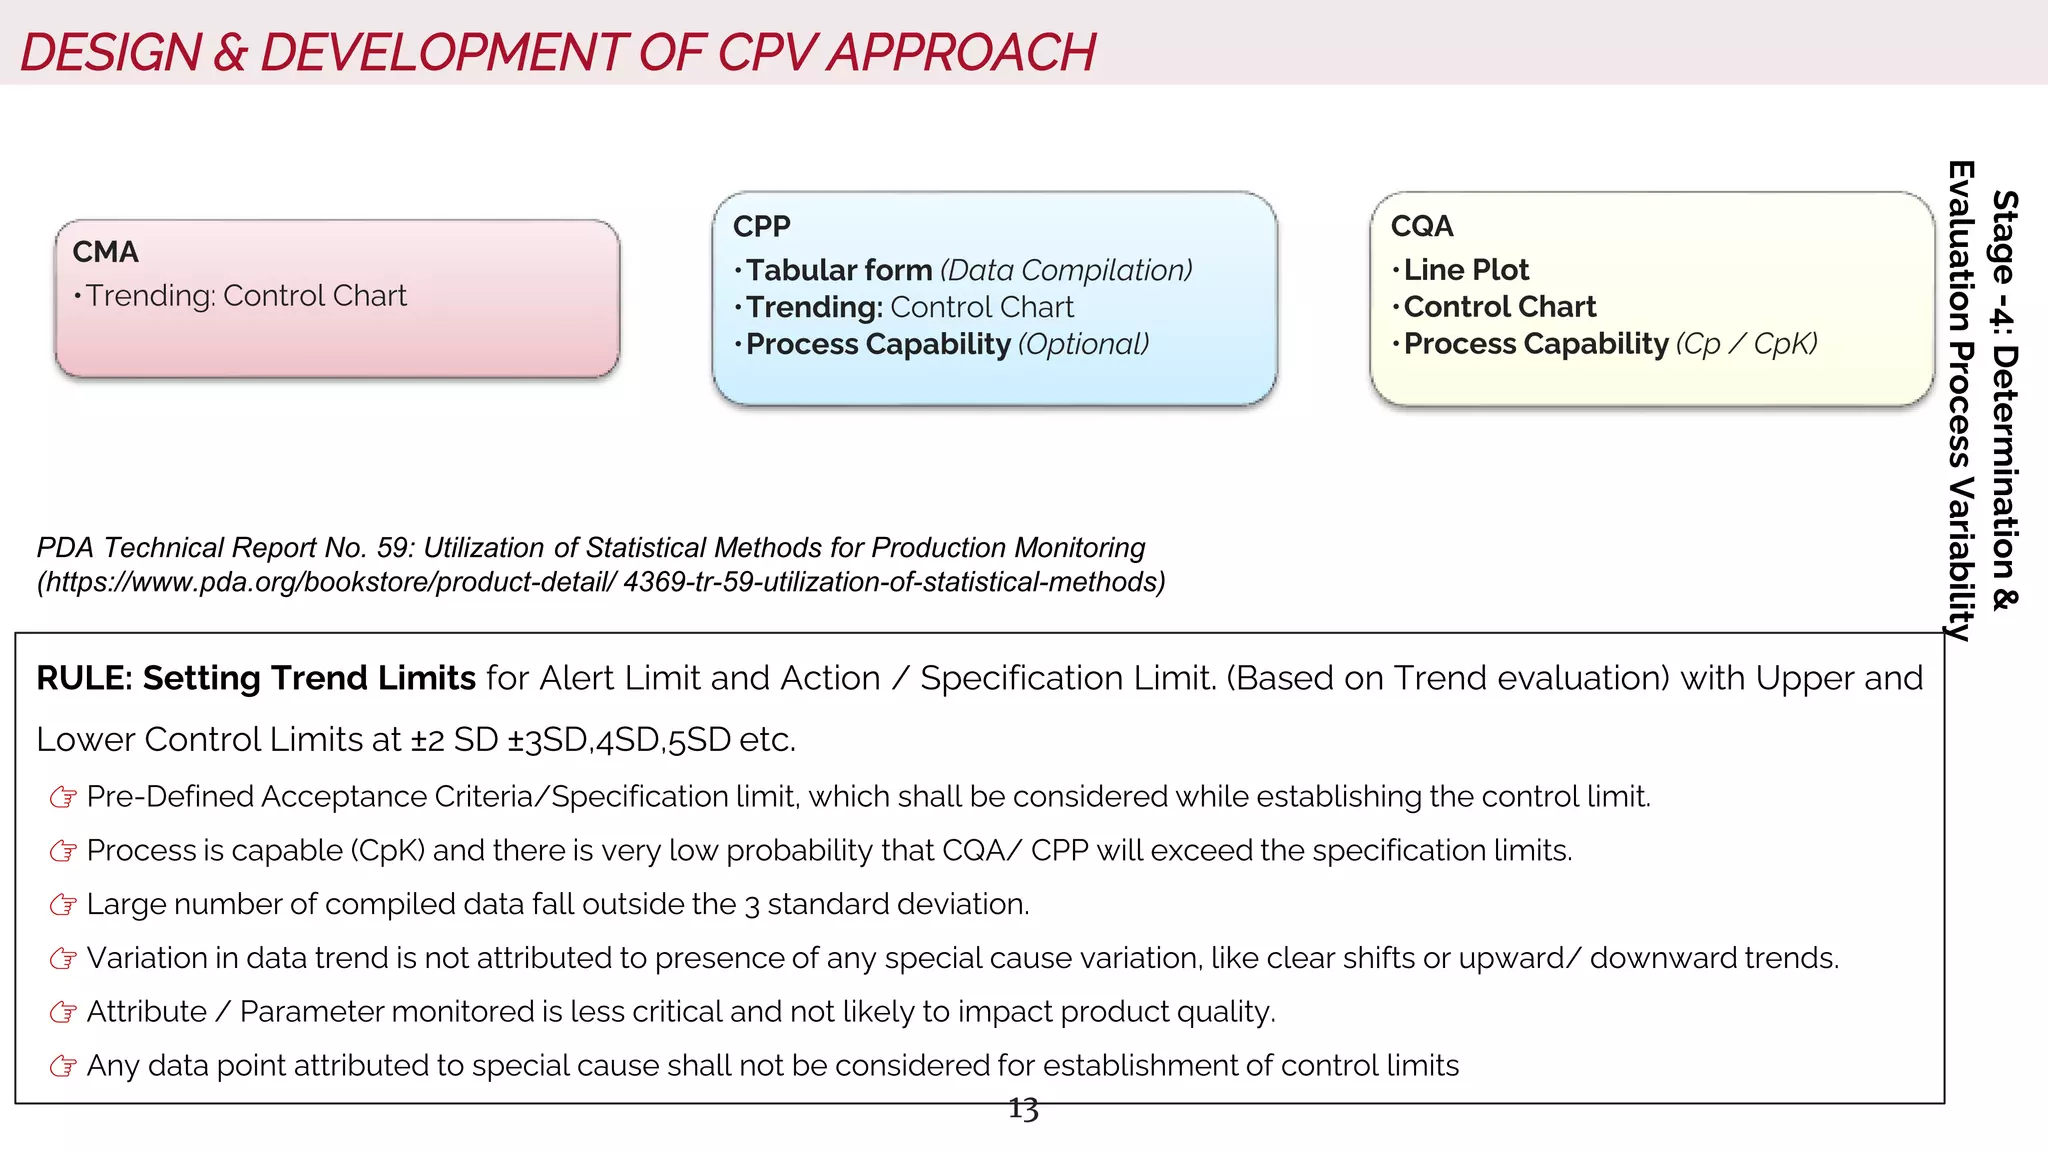
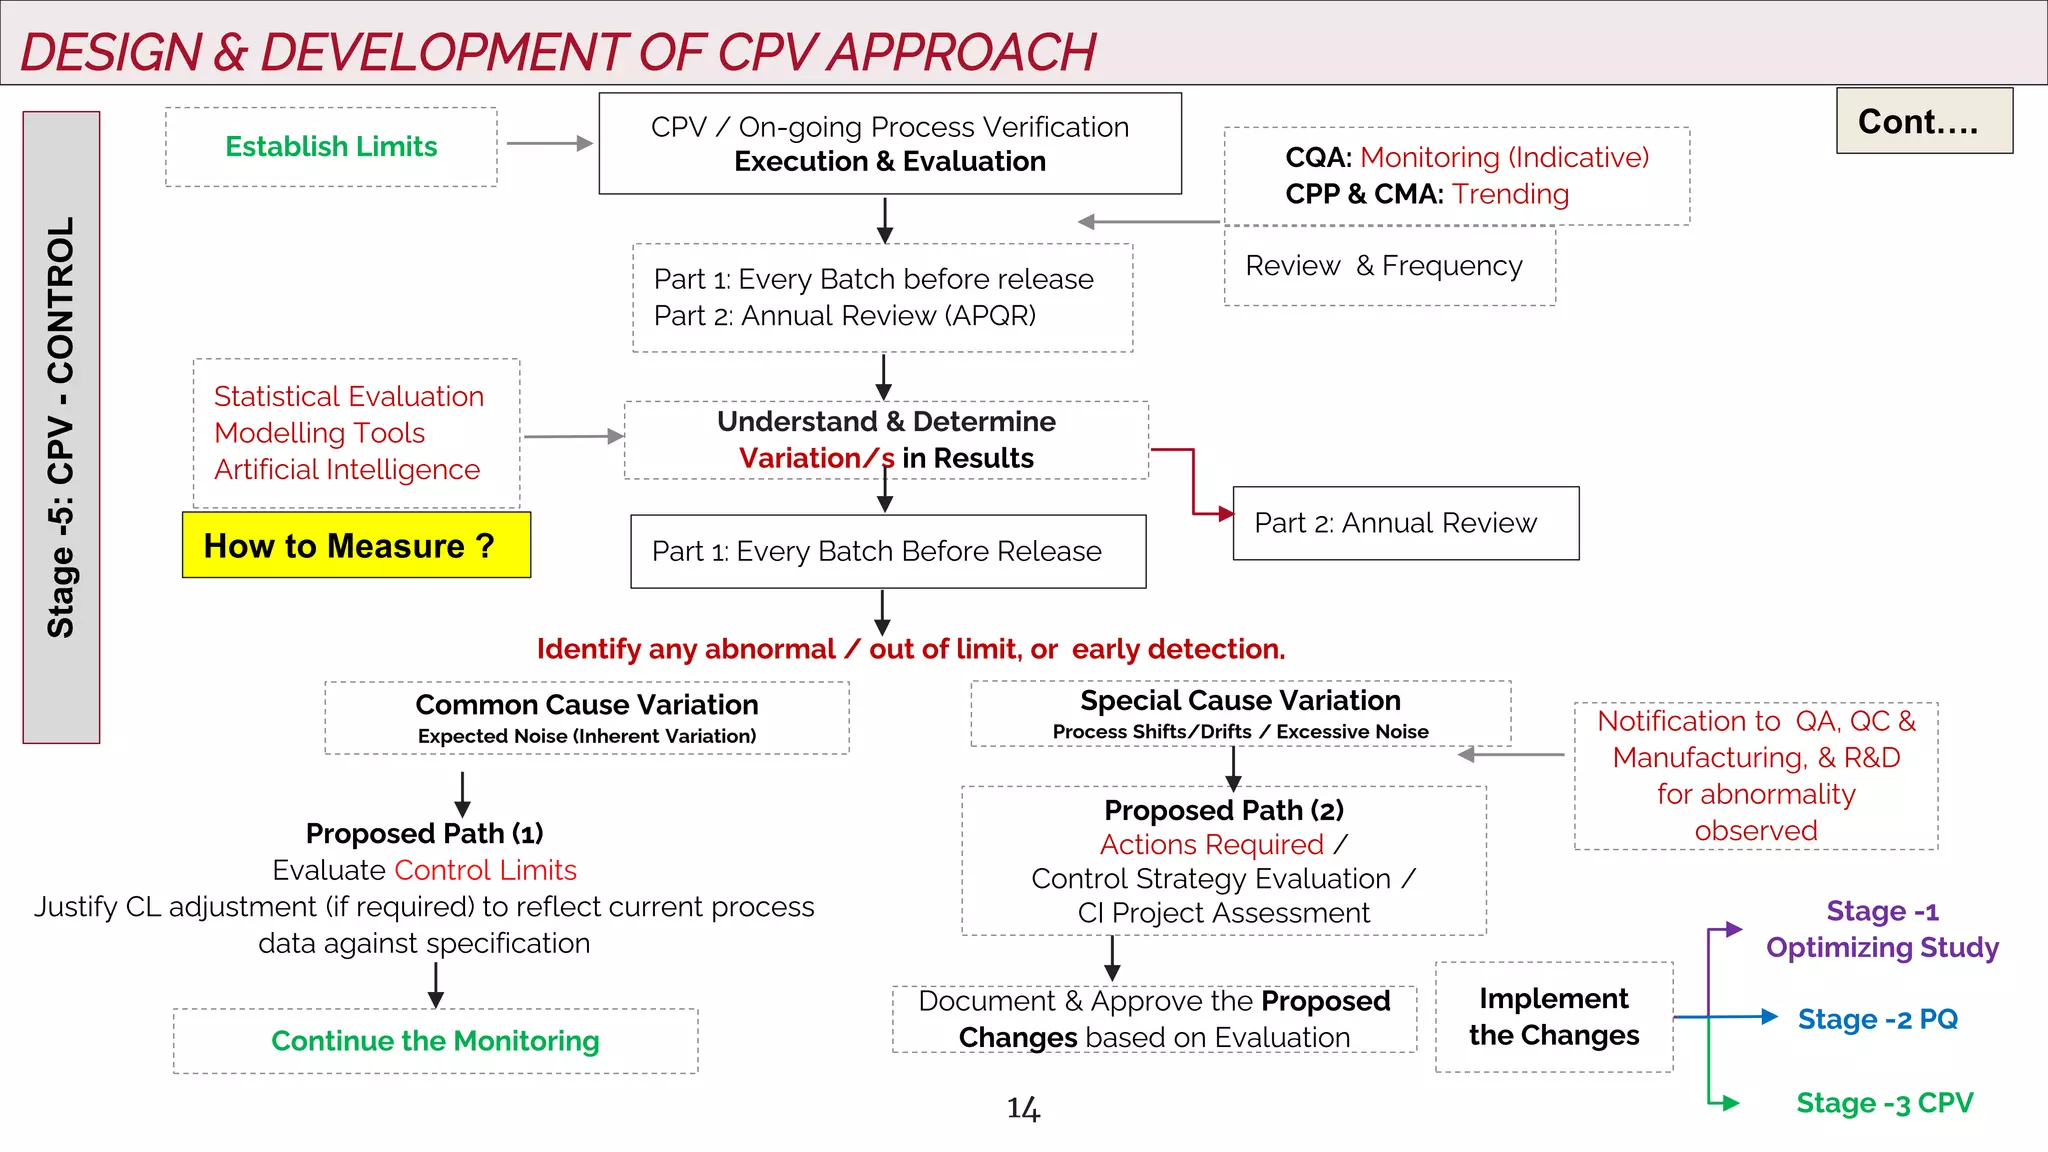
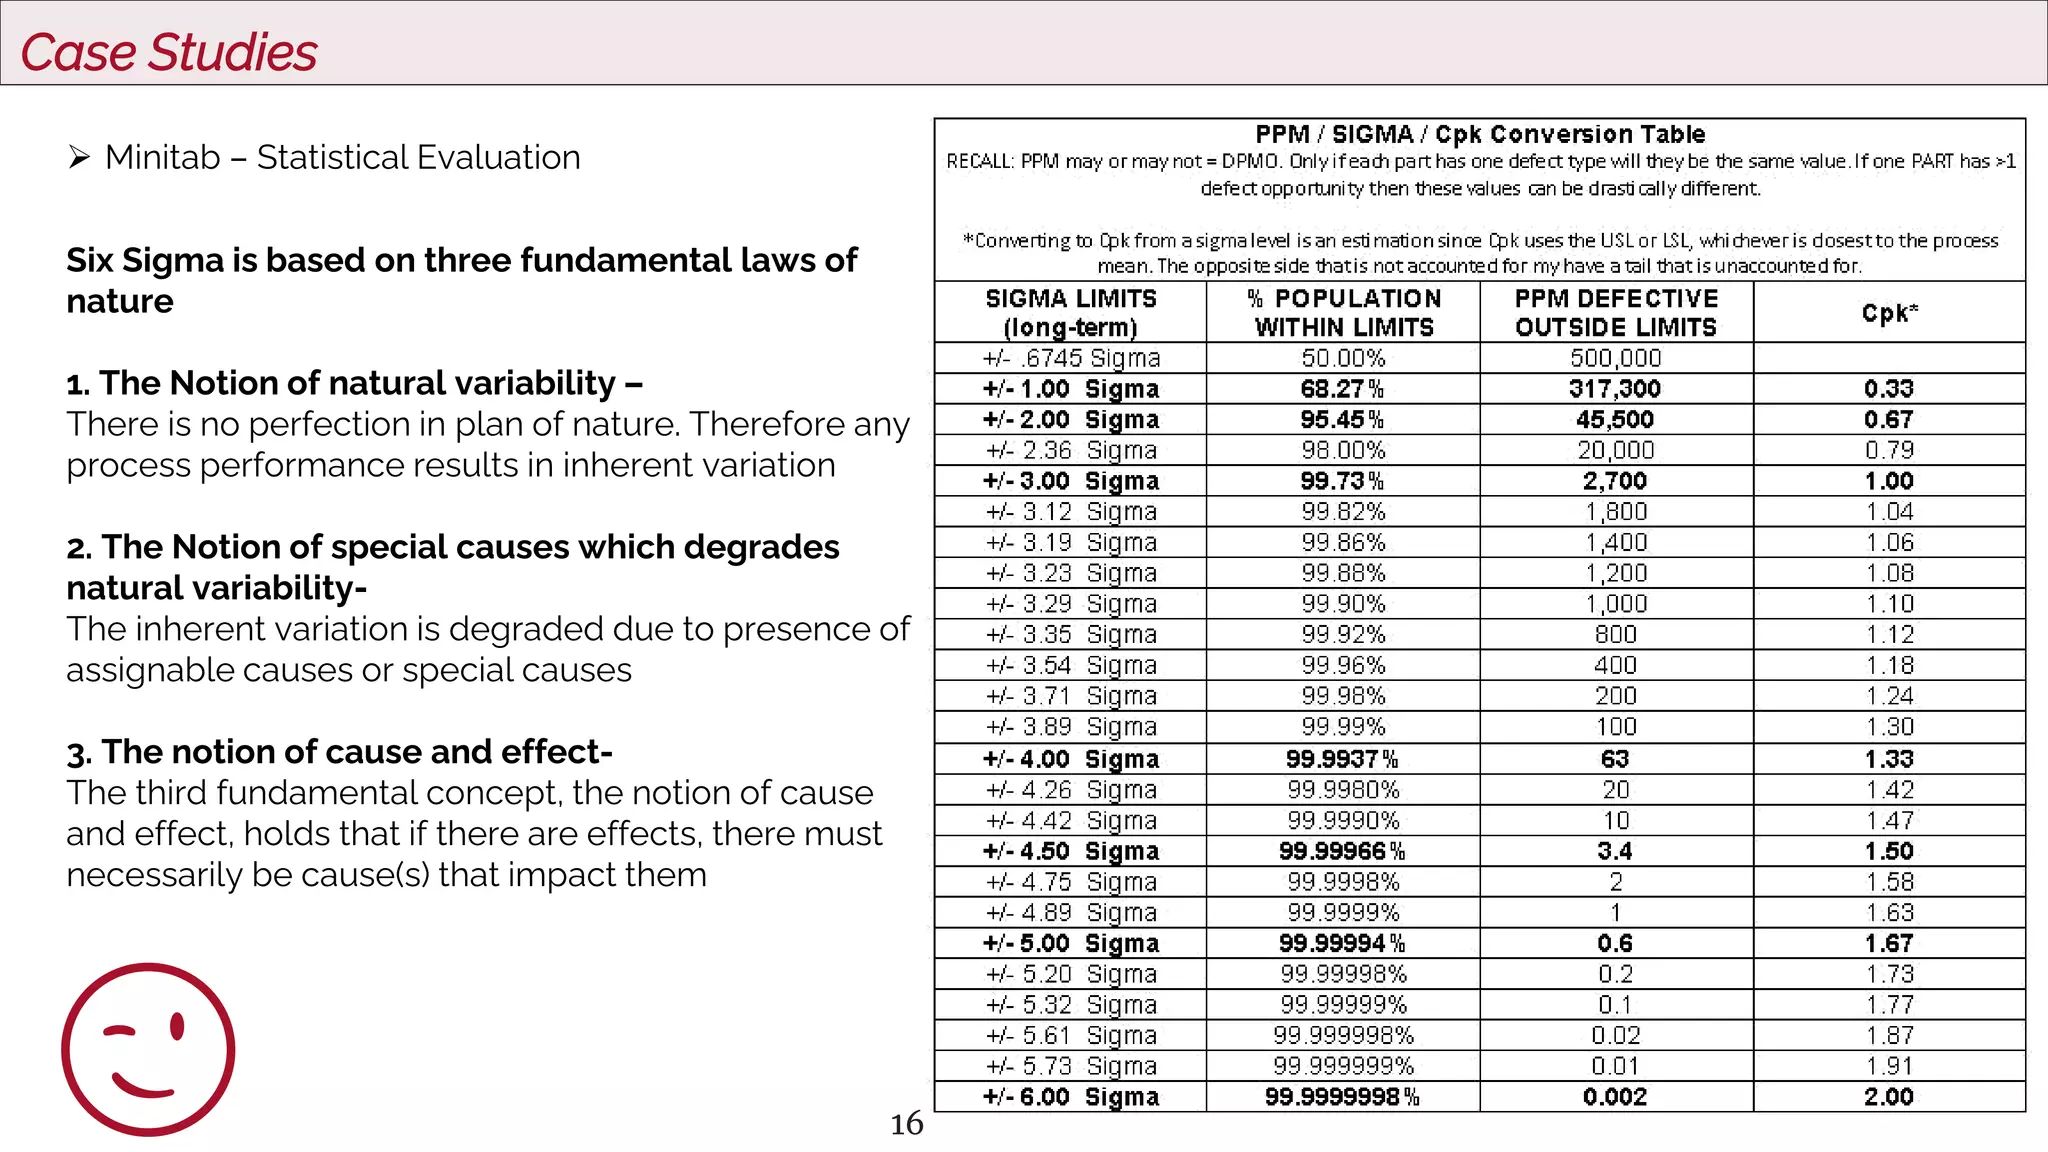
Regulatory Expectation &
Design Approach on
Continious Process Verification
Hello!
I AM KARAN KHAIRNAR
This Session Will Cover ……
2
 Regulatory Expectation on CPV
 Design & Development of CPV Approach
 Reacting to Data Signal for Continuous Improvement
 Regulatory Impact & Factors deterring the adoption of CPV
WHAT?
HOW?
WHY?
About this template
Regulatory Expectations on CPV
ICH Q11: The development and improvement of
a drug substance manufacturing process usually
continues over its lifecycle. Manufacturing
process performance, including the
effectiveness of the control strategy, should be
periodically evaluated.
3
ICH Q7: Systems and processes should be
periodically evaluated to verify that they are still
operating in a valid manner
USFDA (2011): Continued process verification
Assuring that during routine production the
process remains in a state of control.
EMA (2016): Continuous process verification. An
Continuous process verification is an alternative
approach to traditional process validation in
which manufacturing process performance is
continuously monitored and evaluated. (ICH Q8)
PDA Technical Report No. 60:
Process Validation: A Lifecycle Approach (https://www.pda.org/bookstore/product-detail/4373-tr-
60-processvalidation) aligns to the lifecycle process validation model with CPV, as outlined in the
2011 FDA process validation guidance and offers practical examples of process validation lifecycle.
About this template
Process Validation Approach
Aspect
Process Validation is
multilayer activity
Expectation
Understanding and
using the growing body
of process knowledge
gained through the
process validation life
cycle
Stages Interconnection
data from all stages
are required to be used
to make informed
science- and data-
driven decisions
Ref: USFDA -2011
What does successful PV Program look like ……
TO ESTABLISHED & SUSTAIN
CONTROLS
RIGHT ?
Understand
the sources of variation
Detect
the presence & degree
of variation
Control
Variation with risk to
Product / Process
Could impact product / process?
WHY?
WHY?
WHAT?
WHAT?
Ref: USFDA -2011
About this template
Some how Same !
6
Process remain in state of control during commercial
manufacturer
Manufacturing process performance is continuously
monitored and evaluated
An Ongoing Program to collect and analyze product and
process data that relate to product quality must be
established
A science and risk-based real-time approach to verify and
demonstrate that a process operates within the predefined
specified parameters consistently
Evaluating the performance of the process
Identify problems & determines actions to correct,
anticipate, and prevent problems so process remains in
control (§ 211.180(e)).
Companies should perform, as relevant, extensive in-line,
on-line or at-line controls and monitor process performance
and product quality on each batch
Data should verify that the quality attributes CQA and Critical process parameter (CPP) trends
1. Quality of incoming materials/components,
2. In-process material,
3. Finished products.
1. Incoming materials or components,
2. in-process material and
3. Finished products should be collected
Statistical models or tools recommended statistical models or tools recommended
Inter-batch & Intra Batch Variability (211.180(e)
USFDA EMA
7
The GAP ……
👉 Industry organizations like PDA and Regulatory Agencies hitting considerable effort into developing industry
friendly and applicable processes for CPV..
• Sampling Plans (ASTM)
• SPC signal generation rules (8 Rules)
• Artificial Intelligence
• Modeling Program
👉 To Fill this gap, the PDA Process Validation Interest Group (PVIG) created the subtopic “Responses to CPV Data
Signal”. (https://www.pda.org/scientific-and-regulatory-affairs/pda-interest-groups)
• This team work on rationalizing and standardizing the CPV signal decision making process
👉 Another PVIG subtopic team has been exploring the use of CPV data for artificial intelligence applications
(https://www.pda.org/pda-letter-portal/home/full-article/pda-study-explores-role-of-a.i.-in-cpv)
Ref: PDA Letters, Nov 2020
Design Approach on
Continious Process Verification
9
CPV Expectation…….Minimum
👉 The early trend detection
👉 To apply the CPV insights for new process development and for similar products / processes as well.
👉 To generate data sets of critical quality attribute (CQA), critical process parameter (CPP), key performance
parameter (KPP), and critical material attribute (CMA) (represents commercial manufacturing phase)
👉 The knowledge gained and to contemporaneously act on the data signals for continuous improvement
• Variability or Unexpected patterns in the data
👉 To Analyze the process data More often than in the traditional annual product quality review (APQR)
👉 Identifying drifts and proactively eliminating potential process failures & put Continuous Improvement decisions
Ref: PDA Letters, Nov 2020
10
1 3 5
6
4
2
Data Collection &
Measurement for New
& Legacy Products
Evaluation :
Understandings and
managing process
Variability
Develop SOP and
initiate CPV executon &
evaluation
Establishment of
control limits (UCL/LCL)
against specification
limits
Approval of Finalized
CQA, CPP & CMA
Parameter and Establish
Limits
Determin the Variation in
Process from Every Batch
& Annual Product review
Roadmap for CPV
Measure
ANANLYZE
IMPROVE
CONTROL
Protocol based assessment SOP Based Continuous Monitoring
11
DESIGN & DEVELOPMENT OF CPV APPROACH
Process Validation
Product & Process
Development R&D
Defining CQA, CPPs & CMAs,
Stage
-1
Development
Stage
-2
Validation
Site & R&D
Protocol Based –
Establishing Trend Limits
Microsoft Excel or
Statistical Software,
etc.
Stage
-3:
Planning
Data
Collection
&
Measurement
CPV / On-going Process
Verification - Plan
Why?
 For Early Detection of failure
 More Consistency in Process
QA, R&D & TT
Enlist & Rationalize
CQA, CPP & CMA,
Product Wise.
New Products
1. Data Shall be collected on Minimum xx
(10) Batches/Lots consecutive on
identified CQA & CMA to establish
tentative limits and
2. after minimum xx (50) Batches final
limits can be established
3. CPP & CQA will be trended with defined
specification limits
RULE: Setting Trend Limits for Alert
Limit and Action / Specification
Limit. (Based on Trend evaluation)
with Upper and Lower Control Limits
at ±2 SD ±3SD,4SD etc.
Legacy Products
1. Data shall be collected
retrospectively - from lots back to
at least the last relevant process
change or
2. Not more than one Year, as
applicable
New Products
Process Validation / Process
Development Report
Risk Assessment
Legacy Product (Commercial)
Retrospective available
documents, PVR, PDR, Batch
records, Risk Assessment etc.
Statistically significant
Population or
samples size for
CQA/CPP/CMA (Justify)
12
DESIGN & DEVELOPMENT OF CPV APPROACH
Ensure Calculation when determining the limits
1. Enlist values of each parameter CQA, CPP & CMA batch / lot wise
2. Calculate Average of the input values
3. Calculate Average of parameter (Grand Average)
4. Calculate Standard Deviation of parameter
5. In case OOS results (Eliminate value, if root cause known) (Eliminate Special Cause / Outlier)
6. Trend the Control chart (Assess trend for variation & consistency) below/above 2/3/4/5 Sigma against Action/specification limit
for CPP,CQA & CMA
7. Select Out of trend limit (Control Limit) (UCL / LCL) based on trend evaluation
8. CPP shall be monitor by applying control or line chart against specification limit
9. Note: Each parameter of product may vary to lower & upper control based on standard deviation (Sigma)
Cont….
Evaluate, Understand, Control & Manage
the Process Variability
Stage
-4:
Determination
&
Evaluation
Process
Variability
Approve the Finalized CQA, CPP & CMA
Parameter & Establish Limits
13
DESIGN & DEVELOPMENT OF CPV APPROACH
Stage
-4:
Determination
&
Evaluation
Process
Variability
RULE: Setting Trend Limits for Alert Limit and Action / Specification Limit. (Based on Trend evaluation) with Upper and
Lower Control Limits at ±2 SD ±3SD,4SD,5SD etc.
👉 Pre-Defined Acceptance Criteria/Specification limit, which shall be considered while establishing the control limit.
👉 Process is capable (CpK) and there is very low probability that CQA/ CPP will exceed the specification limits.
👉 Large number of compiled data fall outside the 3 standard deviation.
👉 Variation in data trend is not attributed to presence of any special cause variation, like clear shifts or upward/ downward trends.
👉 Attribute / Parameter monitored is less critical and not likely to impact product quality.
👉 Any data point attributed to special cause shall not be considered for establishment of control limits
PDA Technical Report No. 59: Utilization of Statistical Methods for Production Monitoring
(https://www.pda.org/bookstore/product-detail/ 4369-tr-59-utilization-of-statistical-methods)
CMA
•Trending: Control Chart
CPP
•Tabular form (Data Compilation)
•Trending: Control Chart
•Process Capability (Optional)
CQA
•Line Plot
•Control Chart
•Process Capability (Cp / CpK)
14
DESIGN & DEVELOPMENT OF CPV APPROACH
Common Cause Variation
Expected Noise (Inherent Variation)
Special Cause Variation
Process Shifts/Drifts / Excessive Noise
Proposed Path (1)
Evaluate Control Limits
Justify CL adjustment (if required) to reflect current process
data against specification
Proposed Path (2)
Actions Required /
Control Strategy Evaluation /
CI Project Assessment
Notification to QA, QC &
Manufacturing, & R&D
for abnormality
observed
Statistical Evaluation
Modelling Tools
Artificial Intelligence
Understand & Determine
Variation/s in Results
Part 1: Every Batch Before Release
Part 2: Annual Review
Identify any abnormal / out of limit, or early detection.
How to Measure ?
Stage
-5:
CPV
-
CONTROL
CPV / On-going Process Verification
Execution & Evaluation CQA: Monitoring (Indicative)
CPP & CMA: Trending
Review & Frequency
Part 1: Every Batch before release
Part 2: Annual Review (APQR)
Cont….
Establish Limits
Continue the Monitoring
Document & Approve the Proposed
Changes based on Evaluation
Implement
the Changes
Stage -1
Optimizing Study
Stage -2 PQ
Stage -3 CPV
15
Reacting to CPV Data Signals… Don’t Forget below Aspects
👉 The Structured decision-making process with grounded statistical rationales
👉 Sample Data : With limited data availability a deep dive into the available data is warranted to understand what actions can be
taken until additional data is generated….(Tentative Limits & Final Limits approach can be build)
👉 Signal Can be for CQA / CPP / CMA with various degree of Severity. What are those signal? ( Drifts / Shifts in process, OOT
Limits & Process Capability, etc.)
👉 When it’s a common cause variation where revision of your control limits may be justified based on current process data (but
understand where is Specification Limit Stands)
👉 When special cause variations requiring investigation, determination of root cause and continuous improvement remediation
and/or a control strategy update
👉 Setting Trend Limits for Alert Limit and Action against Specification Limit. (Based on Trend evaluation) with Upper and Lower
Control Limits at ±2 SD ±3SD,4SD etc. is most important.
👉 Process Capability Limits :
• CpK = >1.33, Process is capable Continue Periodic Review to assess State of Control
• CpK = 1.00 – 1.33, Process is Marginally Capable, Verify CPP trend, Scope of process Improvement
• CpK = <1..00, Process is in-capable, Verify CPP Trend, Initiate QMS, RCA & CAPA
👉 Inter – Batch & Intra Batch Variation (PPQ & CPV), Can be applied, please start Application 
👉 Ongoing Data tabulation / Monitoring & APQR is two different approach, … Don’t Mix-up..
16
Case Studies
 Minitab – Statistical Evaluation
Six Sigma is based on three fundamental laws of
nature
1. The Notion of natural variability –
There is no perfection in plan of nature. Therefore any
process performance results in inherent variation
2. The Notion of special causes which degrades
natural variability-
The inherent variation is degraded due to presence of
assignable causes or special causes
3. The notion of cause and effect-
The third fundamental concept, the notion of cause
and effect, holds that if there are effects, there must
necessarily be cause(s) that impact them
😉

Regulatory expectation & design approach on continuous process verification

  • 1.
    Regulatory Expectation & DesignApproach on Continious Process Verification Hello! I AM KARAN KHAIRNAR
  • 2.
    This Session WillCover …… 2  Regulatory Expectation on CPV  Design & Development of CPV Approach  Reacting to Data Signal for Continuous Improvement  Regulatory Impact & Factors deterring the adoption of CPV WHAT? HOW? WHY?
  • 3.
    About this template RegulatoryExpectations on CPV ICH Q11: The development and improvement of a drug substance manufacturing process usually continues over its lifecycle. Manufacturing process performance, including the effectiveness of the control strategy, should be periodically evaluated. 3 ICH Q7: Systems and processes should be periodically evaluated to verify that they are still operating in a valid manner USFDA (2011): Continued process verification Assuring that during routine production the process remains in a state of control. EMA (2016): Continuous process verification. An Continuous process verification is an alternative approach to traditional process validation in which manufacturing process performance is continuously monitored and evaluated. (ICH Q8) PDA Technical Report No. 60: Process Validation: A Lifecycle Approach (https://www.pda.org/bookstore/product-detail/4373-tr- 60-processvalidation) aligns to the lifecycle process validation model with CPV, as outlined in the 2011 FDA process validation guidance and offers practical examples of process validation lifecycle.
  • 4.
    About this template ProcessValidation Approach Aspect Process Validation is multilayer activity Expectation Understanding and using the growing body of process knowledge gained through the process validation life cycle Stages Interconnection data from all stages are required to be used to make informed science- and data- driven decisions Ref: USFDA -2011
  • 5.
    What does successfulPV Program look like …… TO ESTABLISHED & SUSTAIN CONTROLS RIGHT ? Understand the sources of variation Detect the presence & degree of variation Control Variation with risk to Product / Process Could impact product / process? WHY? WHY? WHAT? WHAT? Ref: USFDA -2011
  • 6.
    About this template Somehow Same ! 6 Process remain in state of control during commercial manufacturer Manufacturing process performance is continuously monitored and evaluated An Ongoing Program to collect and analyze product and process data that relate to product quality must be established A science and risk-based real-time approach to verify and demonstrate that a process operates within the predefined specified parameters consistently Evaluating the performance of the process Identify problems & determines actions to correct, anticipate, and prevent problems so process remains in control (§ 211.180(e)). Companies should perform, as relevant, extensive in-line, on-line or at-line controls and monitor process performance and product quality on each batch Data should verify that the quality attributes CQA and Critical process parameter (CPP) trends 1. Quality of incoming materials/components, 2. In-process material, 3. Finished products. 1. Incoming materials or components, 2. in-process material and 3. Finished products should be collected Statistical models or tools recommended statistical models or tools recommended Inter-batch & Intra Batch Variability (211.180(e) USFDA EMA
  • 7.
    7 The GAP …… 👉Industry organizations like PDA and Regulatory Agencies hitting considerable effort into developing industry friendly and applicable processes for CPV.. • Sampling Plans (ASTM) • SPC signal generation rules (8 Rules) • Artificial Intelligence • Modeling Program 👉 To Fill this gap, the PDA Process Validation Interest Group (PVIG) created the subtopic “Responses to CPV Data Signal”. (https://www.pda.org/scientific-and-regulatory-affairs/pda-interest-groups) • This team work on rationalizing and standardizing the CPV signal decision making process 👉 Another PVIG subtopic team has been exploring the use of CPV data for artificial intelligence applications (https://www.pda.org/pda-letter-portal/home/full-article/pda-study-explores-role-of-a.i.-in-cpv) Ref: PDA Letters, Nov 2020
  • 8.
    Design Approach on ContiniousProcess Verification
  • 9.
    9 CPV Expectation…….Minimum 👉 Theearly trend detection 👉 To apply the CPV insights for new process development and for similar products / processes as well. 👉 To generate data sets of critical quality attribute (CQA), critical process parameter (CPP), key performance parameter (KPP), and critical material attribute (CMA) (represents commercial manufacturing phase) 👉 The knowledge gained and to contemporaneously act on the data signals for continuous improvement • Variability or Unexpected patterns in the data 👉 To Analyze the process data More often than in the traditional annual product quality review (APQR) 👉 Identifying drifts and proactively eliminating potential process failures & put Continuous Improvement decisions Ref: PDA Letters, Nov 2020
  • 10.
    10 1 3 5 6 4 2 DataCollection & Measurement for New & Legacy Products Evaluation : Understandings and managing process Variability Develop SOP and initiate CPV executon & evaluation Establishment of control limits (UCL/LCL) against specification limits Approval of Finalized CQA, CPP & CMA Parameter and Establish Limits Determin the Variation in Process from Every Batch & Annual Product review Roadmap for CPV Measure ANANLYZE IMPROVE CONTROL Protocol based assessment SOP Based Continuous Monitoring
  • 11.
    11 DESIGN & DEVELOPMENTOF CPV APPROACH Process Validation Product & Process Development R&D Defining CQA, CPPs & CMAs, Stage -1 Development Stage -2 Validation Site & R&D Protocol Based – Establishing Trend Limits Microsoft Excel or Statistical Software, etc. Stage -3: Planning Data Collection & Measurement CPV / On-going Process Verification - Plan Why?  For Early Detection of failure  More Consistency in Process QA, R&D & TT Enlist & Rationalize CQA, CPP & CMA, Product Wise. New Products 1. Data Shall be collected on Minimum xx (10) Batches/Lots consecutive on identified CQA & CMA to establish tentative limits and 2. after minimum xx (50) Batches final limits can be established 3. CPP & CQA will be trended with defined specification limits RULE: Setting Trend Limits for Alert Limit and Action / Specification Limit. (Based on Trend evaluation) with Upper and Lower Control Limits at ±2 SD ±3SD,4SD etc. Legacy Products 1. Data shall be collected retrospectively - from lots back to at least the last relevant process change or 2. Not more than one Year, as applicable New Products Process Validation / Process Development Report Risk Assessment Legacy Product (Commercial) Retrospective available documents, PVR, PDR, Batch records, Risk Assessment etc. Statistically significant Population or samples size for CQA/CPP/CMA (Justify)
  • 12.
    12 DESIGN & DEVELOPMENTOF CPV APPROACH Ensure Calculation when determining the limits 1. Enlist values of each parameter CQA, CPP & CMA batch / lot wise 2. Calculate Average of the input values 3. Calculate Average of parameter (Grand Average) 4. Calculate Standard Deviation of parameter 5. In case OOS results (Eliminate value, if root cause known) (Eliminate Special Cause / Outlier) 6. Trend the Control chart (Assess trend for variation & consistency) below/above 2/3/4/5 Sigma against Action/specification limit for CPP,CQA & CMA 7. Select Out of trend limit (Control Limit) (UCL / LCL) based on trend evaluation 8. CPP shall be monitor by applying control or line chart against specification limit 9. Note: Each parameter of product may vary to lower & upper control based on standard deviation (Sigma) Cont…. Evaluate, Understand, Control & Manage the Process Variability Stage -4: Determination & Evaluation Process Variability Approve the Finalized CQA, CPP & CMA Parameter & Establish Limits
  • 13.
    13 DESIGN & DEVELOPMENTOF CPV APPROACH Stage -4: Determination & Evaluation Process Variability RULE: Setting Trend Limits for Alert Limit and Action / Specification Limit. (Based on Trend evaluation) with Upper and Lower Control Limits at ±2 SD ±3SD,4SD,5SD etc. 👉 Pre-Defined Acceptance Criteria/Specification limit, which shall be considered while establishing the control limit. 👉 Process is capable (CpK) and there is very low probability that CQA/ CPP will exceed the specification limits. 👉 Large number of compiled data fall outside the 3 standard deviation. 👉 Variation in data trend is not attributed to presence of any special cause variation, like clear shifts or upward/ downward trends. 👉 Attribute / Parameter monitored is less critical and not likely to impact product quality. 👉 Any data point attributed to special cause shall not be considered for establishment of control limits PDA Technical Report No. 59: Utilization of Statistical Methods for Production Monitoring (https://www.pda.org/bookstore/product-detail/ 4369-tr-59-utilization-of-statistical-methods) CMA •Trending: Control Chart CPP •Tabular form (Data Compilation) •Trending: Control Chart •Process Capability (Optional) CQA •Line Plot •Control Chart •Process Capability (Cp / CpK)
  • 14.
    14 DESIGN & DEVELOPMENTOF CPV APPROACH Common Cause Variation Expected Noise (Inherent Variation) Special Cause Variation Process Shifts/Drifts / Excessive Noise Proposed Path (1) Evaluate Control Limits Justify CL adjustment (if required) to reflect current process data against specification Proposed Path (2) Actions Required / Control Strategy Evaluation / CI Project Assessment Notification to QA, QC & Manufacturing, & R&D for abnormality observed Statistical Evaluation Modelling Tools Artificial Intelligence Understand & Determine Variation/s in Results Part 1: Every Batch Before Release Part 2: Annual Review Identify any abnormal / out of limit, or early detection. How to Measure ? Stage -5: CPV - CONTROL CPV / On-going Process Verification Execution & Evaluation CQA: Monitoring (Indicative) CPP & CMA: Trending Review & Frequency Part 1: Every Batch before release Part 2: Annual Review (APQR) Cont…. Establish Limits Continue the Monitoring Document & Approve the Proposed Changes based on Evaluation Implement the Changes Stage -1 Optimizing Study Stage -2 PQ Stage -3 CPV
  • 15.
    15 Reacting to CPVData Signals… Don’t Forget below Aspects 👉 The Structured decision-making process with grounded statistical rationales 👉 Sample Data : With limited data availability a deep dive into the available data is warranted to understand what actions can be taken until additional data is generated….(Tentative Limits & Final Limits approach can be build) 👉 Signal Can be for CQA / CPP / CMA with various degree of Severity. What are those signal? ( Drifts / Shifts in process, OOT Limits & Process Capability, etc.) 👉 When it’s a common cause variation where revision of your control limits may be justified based on current process data (but understand where is Specification Limit Stands) 👉 When special cause variations requiring investigation, determination of root cause and continuous improvement remediation and/or a control strategy update 👉 Setting Trend Limits for Alert Limit and Action against Specification Limit. (Based on Trend evaluation) with Upper and Lower Control Limits at ±2 SD ±3SD,4SD etc. is most important. 👉 Process Capability Limits : • CpK = >1.33, Process is capable Continue Periodic Review to assess State of Control • CpK = 1.00 – 1.33, Process is Marginally Capable, Verify CPP trend, Scope of process Improvement • CpK = <1..00, Process is in-capable, Verify CPP Trend, Initiate QMS, RCA & CAPA 👉 Inter – Batch & Intra Batch Variation (PPQ & CPV), Can be applied, please start Application  👉 Ongoing Data tabulation / Monitoring & APQR is two different approach, … Don’t Mix-up..
  • 16.
    16 Case Studies  Minitab– Statistical Evaluation Six Sigma is based on three fundamental laws of nature 1. The Notion of natural variability – There is no perfection in plan of nature. Therefore any process performance results in inherent variation 2. The Notion of special causes which degrades natural variability- The inherent variation is degraded due to presence of assignable causes or special causes 3. The notion of cause and effect- The third fundamental concept, the notion of cause and effect, holds that if there are effects, there must necessarily be cause(s) that impact them 😉

Editor's Notes

  • #5 It stipulates process validation activities in three different stages: Stage 1 – process design, Stage 2 – process qualification, and Stage 3 – continued process verification (CPV).