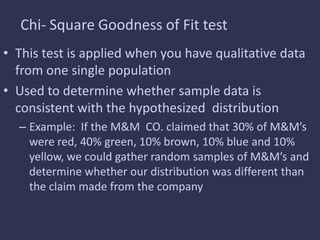
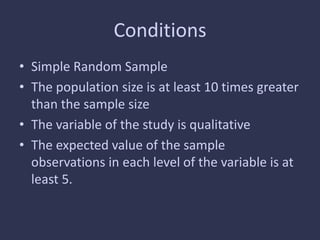
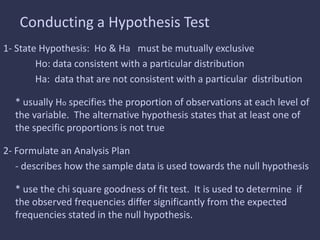
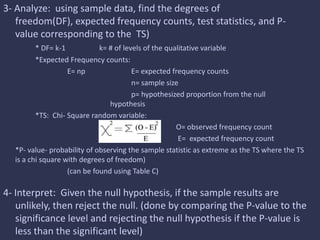
Chi-Square
Goodness of Fit Test
Chi- Square Goodness of Fit test
• This test is applied when you have qualitative data
from one single population
• Used to determine whether sample data is
consistent with the hypothesized distribution
– Example: If the M&M CO. claimed that 30% of M&M’s
were red, 40% green, 10% brown, 10% blue and 10%
yellow, we could gather random samples of M&M’s and
determine whether our distribution was different than
the claim made from the company
Conditions
• Simple Random Sample
• The population size is at least 10 times greater
than the sample size
• The variable of the study is qualitative
• The expected value of the sample
observations in each level of the variable is at
least 5.
Conducting a Hypothesis Test
1- State Hypothesis: Ho & Ha must be mutually exclusive
Ho: data consistent with a particular distribution
Ha: data that are not consistent with a particular distribution
* usually Ho specifies the proportion of observations at each level of
the variable. The alternative hypothesis states that at least one of
the specific proportions is not true
2- Formulate an Analysis Plan
- describes how the sample data is used towards the null hypothesis
* use the chi square goodness of fit test. It is used to determine if
the observed frequencies differ significantly from the expected
frequencies stated in the null hypothesis.
3- Analyze: using sample data, find the degrees of
freedom(DF), expected frequency counts, test statistics, and P-
value corresponding to the TS)
* DF= k-1 k= # of levels of the qualitative variable
*Expected Frequency counts:
E= np E= expected frequency counts
n= sample size
p= hypothesized proportion from the null
hypothesis
*TS: Chi- Square random variable:
O= observed frequency count
E= expected frequency count
*P- value- probability of observing the sample statistic as extreme as the TS where the TS
is a chi square with degrees of freedom)
(can be found using Table C)
4- Interpret: Given the null hypothesis, if the sample results are
unlikely, then reject the null. (done by comparing the P-value to the
significance level and rejecting the null hypothesis if the P-value is
less than the significant level)
B.9 chi square
B.9 chi square
B.9 chi square
B.9 chi square

B.9 chi square

  • 1.
  • 2.
    Chi- Square Goodnessof Fit test • This test is applied when you have qualitative data from one single population • Used to determine whether sample data is consistent with the hypothesized distribution – Example: If the M&M CO. claimed that 30% of M&M’s were red, 40% green, 10% brown, 10% blue and 10% yellow, we could gather random samples of M&M’s and determine whether our distribution was different than the claim made from the company
  • 3.
    Conditions • Simple RandomSample • The population size is at least 10 times greater than the sample size • The variable of the study is qualitative • The expected value of the sample observations in each level of the variable is at least 5.
  • 4.
    Conducting a HypothesisTest 1- State Hypothesis: Ho & Ha must be mutually exclusive Ho: data consistent with a particular distribution Ha: data that are not consistent with a particular distribution * usually Ho specifies the proportion of observations at each level of the variable. The alternative hypothesis states that at least one of the specific proportions is not true 2- Formulate an Analysis Plan - describes how the sample data is used towards the null hypothesis * use the chi square goodness of fit test. It is used to determine if the observed frequencies differ significantly from the expected frequencies stated in the null hypothesis.
  • 5.
    3- Analyze: usingsample data, find the degrees of freedom(DF), expected frequency counts, test statistics, and P- value corresponding to the TS) * DF= k-1 k= # of levels of the qualitative variable *Expected Frequency counts: E= np E= expected frequency counts n= sample size p= hypothesized proportion from the null hypothesis *TS: Chi- Square random variable: O= observed frequency count E= expected frequency count *P- value- probability of observing the sample statistic as extreme as the TS where the TS is a chi square with degrees of freedom) (can be found using Table C) 4- Interpret: Given the null hypothesis, if the sample results are unlikely, then reject the null. (done by comparing the P-value to the significance level and rejecting the null hypothesis if the P-value is less than the significant level)