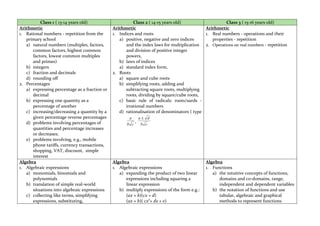
The Polish lower-secondary school maths curriculum covers the following topics over three years (classes):
1) Arithmetic - operations on rational numbers, percentages, indices, roots, and real numbers.
2) Algebra - algebraic expressions, linear and quadratic equations, functions, and simultaneous equations.
3) Geometry - properties of angles, triangles, quadrilaterals, circles, similarity, trigonometry, and 3D shapes.
4) Statistics and probability - collecting and representing data, measures of central tendency, and probability.
Additional non-curricular topics are also sometimes introduced to prepare students for math contests, including complex numbers, vectors, and calculus concepts.
1. The document contains 10 mathematics word problems involving the calculation of areas and perimeters of circles, sectors, and composite shapes made of circles and lines. Various formulas involving pi, radii, arcs, and sectors are used.
2. The problems are presented with diagrams and given information such as lengths of arcs, radii, angles. Students are asked to use circle formulas to calculate perimeters and areas.
3. Detailed step-by-step working is shown for each problem, applying concepts like finding arc lengths, subtracting overlapping regions, and combining components of composite shapes.
Ресурс може бути використаний як на уроці алгебри у 8 класі при вивченні теми «Функція у=х2», так і для позакласної роботи з математики. Наведені приклади застосування параболи у повсякденному житті: в архітектурі та будівництві, в природі та у побуті. Робота позволяє розширити знання про параболу. Показано багатогранність застосування цього поняття.
Ресурс може бути використаний вчителями математики, а також учнями як на уроці, так і в позакласній роботі з математики.
Hydrogen bond, Dative bond & Metallic bondMISS ESTHER
The document discusses different types of chemical bonds:
1. Hydrogen bonding forms between hydrogen atoms covalently bonded to electronegative atoms like N, O, or F and other electronegative atoms. This explains properties like water's high boiling point and hair sticking together when wet.
2. Dative bonds form when an atom shares both bonding electrons, as seen in NH4+ and H3O+.
3. Metallic bonds result from electrostatic attraction between positively charged metal ions and delocalized valence electrons that form a "sea" of electrons. This allows metals to conduct electricity.
3.1.3 Relate gravitational acceleration, g on the surface of the Earth with the universal gravitational constant, G
3.1.4 Justify the importance of knowing the values of gravitational acceleration of the planets in the Solar System.
3.1.5 Describe the centripetal force in the motion of satellites and planets system.
Centripetal Force, F = 푚푣2푟
3.1.6 Determine the mass of the Earth and the Sun using Newton’s universal law of gravitation and centripetal force.
The document discusses solving maximization and minimization word problems using calculus. It provides steps to take which include: (1) reducing the problem to two equations, one for the quantity to maximize/minimize and one with given information, (2) rewriting the equation to maximize/minimize with only one variable, and (3) using calculus to solve the problem. An example problem is provided and solved step-by-step to find the length of a square that maximizes the total area of two pieces cut from a rope.
The document discusses reasonable domain and range versus mathematical domain and range. Reasonable domain refers to values that make sense for a given situation, as opposed to all possible values. Reasonable range similarly refers to dependent variable values that are sensible, not all possibilities. Examples are provided to illustrate determining reasonable domains and ranges for word problems involving test scores, ball heights, pencil purchases, and graphing functions over given domains.
The document discusses domain and range of graphs. It defines domain as all the x-values and range as all the y-values of a graph. It provides examples of determining the domain and range from graphs, describing whether they include or exclude endpoint values and how to write the domain and range in inequality notation.
This document discusses maxima and minima in the context of calculus. It provides examples of functions having maximum or minimum values at interior points or endpoints of an interval. It also discusses the first and second derivative tests for identifying maxima and minima. Examples are provided for finding the maximum area of a rectangular field given a perimeter, and finding the maximum volume of a cylinder given a surface area. Finally, some uses of maxima and minima concepts in fields like marketing and manufacturing are outlined.
This document discusses how to solve maxima and minima word problems. It explains that problems should be reduced to two equations, one for the quantity being maximized/minimized and one for given information. The equation for maximizing/minimizing should be rewritten with one variable. Calculus is then used to solve the problem by finding the derivative and setting it equal to zero to find critical points. An example problem is included where the maximum area of two shapes made from a rope is found.
Innovative use of technology in the teaching of calculusHimani Asija
The document discusses applications of maxima and minima problems involving Kepler's problem, minimum ladder length problems, and their mathematical solutions. It presents three problems: 1) Kepler's wine barrel pricing problem based on wet rod length, 2) minimum ladder length through a fence, and 3) extending the latter to a circular fence. The solutions find the volume/length expressions, take derivatives, and set to zero to find maxima/minima. Effective technology use in education requires careful integration, selecting abstract topics, teacher training, and intelligent software choice.
Experience Mazda Zoom Zoom Lifestyle and Culture by Visiting and joining the Official Mazda Community at http://www.MazdaCommunity.org for additional insight into the Zoom Zoom Lifestyle and special offers for Mazda Community Members. If you live in Arizona, check out CardinaleWay Mazda's eCommerce website at http://www.Cardinale-Way-Mazda.com
Stat 130 chi-square goodnes-of-fit testAldrin Lozano
- The chi-square goodness-of-fit test can be used to determine if a frequency distribution fits a specific pattern or theoretical distribution. It compares observed frequencies to expected frequencies.
- To perform the test, the chi-square statistic is calculated using the formula (O-E)^2/E, where O is the observed frequency and E is the expected frequency. This value is then compared to a critical value from the chi-square distribution based on the degrees of freedom.
- If the chi-square statistic exceeds the critical value, the null hypothesis that the observed and expected frequencies are the same is rejected, indicating a poor fit between the observed and expected distributions.
Reporting chi square goodness of fit test of independence in apaKen Plummer
A chi-square goodness of fit test was used to analyze data from a public opinion poll of 1000 voters in Connecticut on their party affiliation. The expected distribution was 40% Republican and 60% Democrat, but the observed results were 32% Republican and 68% Democrat. A sample report in APA style for these results includes the chi-square value, degrees of freedom, and p-value to determine if there is a significant deviation from the expected distribution.
The document provides explanations and examples for concepts related to differentiation and integration including:
- The differentiation of various functions like 3x^2, e^x, x^5, etc. and explanations of the differentiation process
- The integration of functions like 3x^3 and what integration undoes from differentiation
- Examples of calculating permutations, combinations, and arrangements of different objects
Null hypothesis for a chi-square goodness of fit testKen Plummer
The document discusses how to write a null hypothesis for a chi-square goodness of fit test. It provides an example of a poll that surveyed voters in Connecticut on their party affiliation (Republican or Democrat). The expected distribution was 40% Republican and 60% Democrat. The null hypothesis is stated as: The party affiliation of Republican/Democrat occur at a .4/.6 probability in Connecticut.
This document describes how to conduct a chi-square goodness of fit test. The test involves:
1) Stating the null and alternative hypotheses. The null hypothesis specifies the expected probabilities, while the alternative is that at least one expected probability is incorrect.
2) Developing an analysis plan specifying the significance level and test to be used.
3) Analyzing sample data to calculate degrees of freedom, expected frequencies, the test statistic, and p-value.
4) Interpreting the results by comparing the p-value to the significance level and rejecting or failing to reject the null hypothesis. An example problem demonstrates applying the test to determine if observed outcomes match a casino's claimed probabilities.
The document discusses maxima and minima, which are the highest and lowest values that a function can reach over a closed interval. It provides examples of finding maxima and minima by taking derivatives and setting them equal to zero. Practical applications are given in chemistry, physics, economics, meteorology, theme park revenue modeling, and space shuttle engineering where maxima and minima help optimize values like temperature, revenue, and pressure resistance.
This document discusses the relationship between mind, matter, and mathematics. It notes that mathematics is a mental construct but relativity has real physical effects. It suggests the structure of the mind and universe is the same, and mathematics acts as a bridge between the two. Several examples are given of old mathematical concepts being used in modern technologies like Google's page rank algorithm and artificial intelligence planning algorithms.
Math functions, relations, domain & rangeRenee Scott
This document discusses math functions, relations, and their domains and ranges. It provides examples of relations and explains that the domain is the set of first numbers in ordered pairs, while the range is the set of second numbers. A function is defined as a relation where each x-value has only one corresponding y-value. It compares examples of relations that are and are not functions and describes how to evaluate functions by inserting values. Tests for identifying functions like the vertical line test are also outlined.
The document discusses how to use a chi-squared (x2) test to examine differences between observed and expected frequencies of categorical data. It provides guidelines for when a chi-squared test is appropriate, how to perform the calculation, and how to interpret the results. A case study example is presented of a student analyzing questionnaire responses about the 2012 Olympics using a chi-squared test to determine if response frequencies differed significantly between demographic groups.
The document discusses the chi-square test, which offers an alternative method for testing the significance of differences between two proportions. It was developed by Karl Pearson and follows a specific chi-square distribution. To calculate chi-square, contingency tables are made noting observed and expected frequencies, and the chi-square value is calculated using the formula. Degrees of freedom are also calculated. Chi-square test is commonly used to test proportions, associations between events, and goodness of fit to a theory. However, it has limitations when expected values are less than 5 and does not measure strength of association or indicate causation.
This document outlines the aims and content of the IGCSE Mathematics - Additional Standards syllabus. The aims are to consolidate elementary mathematical skills, develop knowledge of mathematical concepts, foster problem solving abilities, and apply mathematics to real-world situations. The content includes set theory, functions, quadratic functions, indices and surds, polynomials, simultaneous equations, logarithmic and exponential functions, straight line graphs, trigonometry, permutations and combinations, binomial expansions, vectors, matrices, differentiation, and integration. Assessment objectives are to recall and apply techniques, interpret mathematical data, comprehend concepts and relationships, and formulate and solve problems.
This document provides the annual lesson plan for Form Five students at SMK Bukit Jelutong Shah Alam for 2012. It outlines 45 weeks of topics to be covered from January to September, including chapters on number bases, graphs, transformations, matrices, variations, probability, bearing, earth geometry, and plans/elevations. Key learning objectives and outcomes are specified for each topic. The schedule notes public holidays and exam periods.
Annual Planning for Additional Mathematics Form 4 2011sue sha
This document outlines the annual planning for additional mathematics for Form 4 students in 2011. It includes 3 weeks of content on functions, 3 weeks on quadratic equations, 4 weeks on quadratic functions, 2 weeks on simultaneous equations, 2 weeks on indices and logarithms, and 3 weeks each on coordinate geometry, statistics, circular measures, and differentiation. For each topic, it lists the intended learning outcomes and points to note. It also schedules tests, exams, and indicates who will prepare the assessments. The planning provides a comprehensive overview of the mathematics curriculum for the year.
The document discusses linear inequalities in two variables and their graphical representations. It introduces the Cartesian coordinate system developed by Rene Descartes and its importance. It explains how to graph linear inequalities by first drawing the line as an equation, then determining whether to shade above or below the line based on whether a test point satisfies the inequality. Students are assigned to bring graphing paper, coloring materials, and a ruler to class on Monday to graph linear inequalities.
This document outlines the syllabus for Mathematics for Class 9. It will include one exam paper lasting 2.5 hours with 80 marks for questions and 20 marks for internal assessment. The paper will be divided into two sections of 40 marks each, with Section I containing short answer questions and Section II requiring students to answer 4 out of 7 longer questions. The syllabus covers topics such as arithmetic, algebra, geometry, trigonometry, coordinate geometry, commercial mathematics, and statistics. Suggested assignments for internal assessment include conducting surveys, planning routes, running businesses, and experiments related to circles and formulas for area, volume, and surface area.
This document outlines the units, lessons, and standards covered in an Introductory Algebra 1B course. The course covers exponents, monomials, polynomials, factoring polynomials, quadratic equations, functions, rational and radical expressions/equations, transformations, and probability. Key standards addressed include evaluating and simplifying algebraic expressions, factoring quadratic expressions, solving algebraic equations and functions, working with quadratic functions and the quadratic formula, and performing transformations and calculating probabilities.
The document outlines the aims, objectives, and syllabus for the Mathematics HL (1st exams 2014) course. It includes:
- 10 aims of the course focused on developing mathematical skills, understanding, problem solving, and appreciation of mathematics.
- 6 objectives centered around demonstrating knowledge and understanding of mathematical concepts, problem solving, communication, use of technology, reasoning, and inquiry approaches.
- The syllabus is divided into 8 core topics (Algebra, Functions and equations, Circular functions and trigonometry, Vectors, Statistics and probability, Calculus, and 2 optional topics (Statistics and probability, Sets, relations and groups) that provide 48 hours of instruction each.
This annual planning document outlines the topics, learning objectives, outcomes, and activities for teaching mathematics to Form 5 students over 4 weeks. Week 1 focuses on number bases, with the objective of understanding and using numbers in bases two, eight, and five. Students will learn to state, write, convert, and perform computations on numbers in different bases. Weeks 2-4 cover graphs of functions, with the objective of understanding and using graphs of linear, quadratic, cubic, and reciprocal functions. Students will learn to draw and analyze graphs of various types of functions.
This document is a test specification table outlining the topics, learning outcomes, and question levels for a Form 4 Mathematics exam in Malaysia. It includes 16 questions testing topics such as sets, solid geometry, linear equations, circles, quadratic expressions/equations, straight lines, probability, statistics, and mathematical reasoning. Question difficulty ranges from moderate (M) to difficult (D) to extended/challenging (E). Topics include volumes, arcs, sectors, areas, gradients, intercepts, probability, frequency tables, means, histograms, and ogives.
1. The document discusses coordinate planes and identifying points using ordered pairs. It provides examples of ordered pairs and asks the reader to identify other coordinates.
2. It then discusses a vertical line l that passes through the point (3,7) and asks the reader to find 6 points on the line and 6 points not on the line, as well as how to tell if a point is on the line based on its coordinates.
3. Finally, it introduces transformations on coordinate planes and asks the reader questions about finding points with specific x- and y-coordinates or where the y-coordinate is less than the x-coordinate. It provides homework problems for further practice.
Here are the key steps:
1) Take out the coefficient of x^2 which is 3:
3(x^2 - 4x + 7/3)
2) Complete the square of the expression in brackets:
3(x^2 - 4x + 4) + 7/3
3) Recognise this is in the form a(x+b)^2 + c where:
a = 3
b = -2
c = 7/3
Therefore, the expression in the required form is:
3(x + 2)2 + 7/3
The document provides an overview of tensor calculus and its notations. It discusses two methods for representing tensors: direct notation which treats tensors as invariant objects, and index notation which uses tensor components. The direct notation is preferred. Basic operations for vectors and second rank tensors are defined, including addition, scalar multiplication, dot products, cross products, and properties. Polar and axial vectors are distinguished. Guidelines are given for tensor calculus notation and rules used throughout the work.
This document provides an overview of linear equations in two variables. It begins by testing previous knowledge about linear equations through multiple choice questions. The learning objectives are then stated as expressing pairs of linear equations in standard form and differentiating between consistent and inconsistent systems without graphs. Standard form for a pair of linear equations in two variables is defined. Examples are given of expressing pairs of equations in standard form and finding the values of constants. The relationship between coefficients in a pair of linear equations and their graphical and algebraic interpretation is discussed. An example of finding the value of k for which two lines are coincident is provided. The document concludes by recapping what was learned about the standard form of systems and finding unknowns given the nature of the solution
This document contains 15 multiple choice and free response questions about sinusoidal functions and graphs. It tests concepts like identifying amplitude, period, phase shift, and writing equations to represent sinusoidal graphs in terms of sine and cosine. The questions progress from identifying properties of given graphs and equations to sketching graphs, writing equations to represent graphs, and applying concepts to word problems involving real-world sinusoidal situations.
This document contains 15 multiple choice and free response questions about sinusoidal functions and their graphs. Key concepts covered include:
- Identifying amplitude, period, and phase shift from graphs of sinusoidal functions
- Writing equations to represent sinusoidal graphs in terms of sine and cosine
- Sketching transformed sinusoidal graphs (shifts, stretches, reflections)
- Finding amplitude, period, phase shift, and vertical/horizontal shifts from equations
- Relating sinusoidal equations to their real world applications like a roller coaster track
This document discusses linear equations. It defines linear equations as algebraic equations with terms that are constants or the product of constants and variables. Linear equations can have one or more variables. The document describes variables, constants, and examples of linear equations with one and two variables. It explains how to graph and solve systems of linear equations using graphical and algebraic methods like elimination and cross multiplication. Graphical methods involve plotting the lines defined by each equation and finding their point(s) of intersection. Algebraic methods eliminate variables to solve for the remaining ones.
1. The document provides instructions for students to use a graphing calculator application called Nspire to explore and analyze graphs of quadratic equations.
2. Students are asked to vary the values of a, b, and c in different quadratic equations and record the shape of the graph, location of maximum/minimum points, and equation of the line of symmetry.
3. The summary explains that graphs of quadratic equations with a positive coefficient of x^2 open up and have a maximum point, while those with a negative coefficient of x^2 open down and have a minimum point. The graph is always symmetrical around the line of symmetry passing through the maximum or minimum point.
- The document discusses linear equations in two variables. It defines linear equations and explains that a linear equation in two variables can be written in the form ax + by = c.
- It describes how linear equations in two variables have infinitely many solutions, represented by pairs of x and y values. The graph of a linear equation in two variables is a straight line.
- The document also discusses how equations of lines parallel to the x-axis or y-axis can be represented. The graph of an equation of the form x = a is a line parallel to the y-axis, while an equation of the form y = a graphs as a line parallel to the x-axis.
This document provides an overview of graphing linear equations. It defines key terms like solutions, intercepts, and linear models. Examples are given to show how to graph equations by finding intercepts or using a table of points. Horizontal and vertical lines are discussed as special cases of linear equations. The document concludes with an example of using a linear equation to model a real-world situation involving monthly phone costs.
The document presents two methods for finding the area of a triangle when the base is known but the perpendicular height is not:
1. Using trigonometry, it derives an expression for the height in terms of one of the angles and the base, leading to the general area formula involving the base, one side, and an opposite angle.
2. Using Pythagorean theorem applied to two triangles, it eliminates the height and derives an expression for the height solely in terms of the triangle's three sides, resulting in Heron's formula for the area.
The document provides guidance on using the features and tools available on the TwinSpace online platform for eTwinning projects. It explains how to set up pages, forums, and multimedia galleries to organize project content and discussions. Instructions are given for inviting students and teachers, setting permissions, and using chat and other communication features.
This document provides information about Małgorzata Garkowska, a math teacher of 25 years who has been involved with eTwinning since 2006. It discusses tools she uses for teaching like Google Maps, Google Earth, Google Tour Builder, and GeoGebra. It provides examples of student activities and projects that can be done with these tools including creating maps, virtual field trips, and interactive math constructions. Hands-on instructions are given for students to collaboratively create maps, tours, and complete math tasks using the tools.
This document provides information about Małgorzata Garkowska, a math teacher with over 20 years of experience who has been involved with eTwinning since 2006. It then discusses several free online tools that can be used for educational purposes: Google My Maps for creating customized maps; Google Earth for virtual exploration of places; Google Tour Builder for creating geographic storytelling tours; and GeoGebra for interactive math learning. Instructions are provided on features and functions of each tool. The document concludes with directions for partners to work together using the hands-on tasks of creating maps and tours with Google tools, and constructing geometric shapes and graphs with GeoGebra.
The European Commission has selected the 2012-1-ES1-COM06-52752 project "Why Maths?" as a "success story" based on its impact, contribution to policy-making, innovative results, and creative approach. As a result of this selection, the project will receive increased visibility on Commission websites and social media, and at conferences. The project coordinator may also be contacted by ECORYS, the Commission's contractor for disseminating and exploiting project results, to provide additional materials about the project. The selection recognizes the commitment, enthusiasm, and high-quality work of the project partners.
1) Se presentan ecuaciones diferenciales ordinarias que involucran funciones trigonométricas como seno, coseno y sus derivadas.
2) Se resuelven las ecuaciones aplicando técnicas como separación de variables y sustitución de funciones.
3) Se obtienen expresiones para las funciones desconocidas en términos de constantes.
1) Se presentan ecuaciones diferenciales ordinarias que involucran funciones trigonométricas como seno, coseno y sus derivadas.
2) Se resuelven las ecuaciones aplicando propiedades de las funciones trigonométricas y técnicas de resolución de ecuaciones diferenciales.
3) Se obtienen las soluciones en función de constantes arbitrarias y el intervalo de definición indicado para cada una.
THIS BROCHURE WAS PREPARED
AS A PART OF THE COMENIUS PROJECT
WHY MATHS?
by the students and the teachers from:
BERKENBOOM HUMANIORA BOVENBOUW, IN SINT-NIKLAAS
( BELGIUM)
EUREKA SECONDARY SCHOOL IN KELLS (IRELAND)
LICEO CLASSICO STATALE CRISTOFORO COLOMBO IN GENOA (ITALY)
GIMNAZJUM IM. ANNY WAZÓWNY IN GOLUB-DOBRZYŃ (POLAND)
ESCOLA SECUNDARIA
COM
3.º CICLO D. MANUEL I IN BEJA (PORTUGAL)
IES ÁLVAREZ CUBERO IN PRIEGO DE CÓRDOBA (SPAIN)
THIS EBOOK WAS PREPARED
AS A PART OF THE COMENIUS PROJECT
WHY MATHS?
by the students and the teachers from:
BERKENBOOM HUMANIORA BOVENBOUW, IN SINT-NIKLAAS
( BELGIUM)
EUREKA SECONDARY SCHOOL IN KELLS (IRELAND)
LICEO CLASSICO STATALE CRISTOFORO COLOMBO IN GENOA (ITALY)
GIMNAZJUM IM. ANNY WAZÓWNY IN GOLUB-DOBRZYŃ (POLAND)
ESCOLA SECUNDARIA COM 3.º CICLO D. MANUEL I IN BEJA (PORTUGAL)
IES ÁLVAREZ CUBERO IN PRIEGO DE CÓRDOBA (SPAIN)
Maths in Art and Architecture Why Maths? Comenius projectGosia Garkowska
THIS EBOOK WAS PREPARED
AS A PART OF THE COMENIUS PROJECT
WHY MATHS?
by the students and the teachers from:
BERKENBOOM HUMANIORA BOVENBOUW, IN SINT-NIKLAAS ( BELGIUM)
EUREKA SECONDARY SCHOOL IN KELLS (IRELAND)
LICEO CLASSICO STATALE CRISTOFORO COLOMBO IN GENOA (ITALY)
GIMNAZJUM IM. ANNY WAZÓWNY IN GOLUB-DOBRZYŃ (POLAND)
ESCOLA SECUNDARIA COM 3.º CICLO D. MANUEL I IN BEJA (PORTUGAL)
IES ÁLVAREZ CUBERO IN PRIEGO DE CÓRDOBA (SPAIN)
This document contains trivia questions and answers about mathematics, art, geography, and astronomy related to the Comenius project involving schools from Portugal, Spain, Italy, Belgium, Poland, and Ireland. There are over 100 multiple choice and short answer questions covering topics like the capital cities and populations of the countries involved, famous artists and their use of mathematical concepts in works of art, properties of planets and galaxies, and principles of map making and geography.
How to Manage Your Lost Opportunities in Odoo 17 CRMCeline George
Odoo 17 CRM allows us to track why we lose sales opportunities with "Lost Reasons." This helps analyze our sales process and identify areas for improvement. Here's how to configure lost reasons in Odoo 17 CRM
বাংলাদেশের অর্থনৈতিক সমীক্ষা ২০২৪ [Bangladesh Economic Review 2024 Bangla.pdf] কম্পিউটার , ট্যাব ও স্মার্ট ফোন ভার্সন সহ সম্পূর্ণ বাংলা ই-বুক বা pdf বই " সুচিপত্র ...বুকমার্ক মেনু 🔖 ও হাইপার লিংক মেনু 📝👆 যুক্ত ..
আমাদের সবার জন্য খুব খুব গুরুত্বপূর্ণ একটি বই ..বিসিএস, ব্যাংক, ইউনিভার্সিটি ভর্তি ও যে কোন প্রতিযোগিতা মূলক পরীক্ষার জন্য এর খুব ইম্পরট্যান্ট একটি বিষয় ...তাছাড়া বাংলাদেশের সাম্প্রতিক যে কোন ডাটা বা তথ্য এই বইতে পাবেন ...
তাই একজন নাগরিক হিসাবে এই তথ্য গুলো আপনার জানা প্রয়োজন ...।
বিসিএস ও ব্যাংক এর লিখিত পরীক্ষা ...+এছাড়া মাধ্যমিক ও উচ্চমাধ্যমিকের স্টুডেন্টদের জন্য অনেক কাজে আসবে ...
How to Build a Module in Odoo 17 Using the Scaffold MethodCeline George
Odoo provides an option for creating a module by using a single line command. By using this command the user can make a whole structure of a module. It is very easy for a beginner to make a module. There is no need to make each file manually. This slide will show how to create a module using the scaffold method.
Walmart Business+ and Spark Good for Nonprofits.pdfTechSoup
"Learn about all the ways Walmart supports nonprofit organizations.
You will hear from Liz Willett, the Head of Nonprofits, and hear about what Walmart is doing to help nonprofits, including Walmart Business and Spark Good. Walmart Business+ is a new offer for nonprofits that offers discounts and also streamlines nonprofits order and expense tracking, saving time and money.
The webinar may also give some examples on how nonprofits can best leverage Walmart Business+.
The event will cover the following::
Walmart Business + (https://business.walmart.com/plus) is a new shopping experience for nonprofits, schools, and local business customers that connects an exclusive online shopping experience to stores. Benefits include free delivery and shipping, a 'Spend Analytics” feature, special discounts, deals and tax-exempt shopping.
Special TechSoup offer for a free 180 days membership, and up to $150 in discounts on eligible orders.
Spark Good (walmart.com/sparkgood) is a charitable platform that enables nonprofits to receive donations directly from customers and associates.
Answers about how you can do more with Walmart!"
LAND USE LAND COVER AND NDVI OF MIRZAPUR DISTRICT, UPRAHUL
This Dissertation explores the particular circumstances of Mirzapur, a region located in the
core of India. Mirzapur, with its varied terrains and abundant biodiversity, offers an optimal
environment for investigating the changes in vegetation cover dynamics. Our study utilizes
advanced technologies such as GIS (Geographic Information Systems) and Remote sensing to
analyze the transformations that have taken place over the course of a decade.
The complex relationship between human activities and the environment has been the focus
of extensive research and worry. As the global community grapples with swift urbanization,
population expansion, and economic progress, the effects on natural ecosystems are becoming
more evident. A crucial element of this impact is the alteration of vegetation cover, which plays a
significant role in maintaining the ecological equilibrium of our planet.Land serves as the foundation for all human activities and provides the necessary materials for
these activities. As the most crucial natural resource, its utilization by humans results in different
'Land uses,' which are determined by both human activities and the physical characteristics of the
land.
The utilization of land is impacted by human needs and environmental factors. In countries
like India, rapid population growth and the emphasis on extensive resource exploitation can lead
to significant land degradation, adversely affecting the region's land cover.
Therefore, human intervention has significantly influenced land use patterns over many
centuries, evolving its structure over time and space. In the present era, these changes have
accelerated due to factors such as agriculture and urbanization. Information regarding land use and
cover is essential for various planning and management tasks related to the Earth's surface,
providing crucial environmental data for scientific, resource management, policy purposes, and
diverse human activities.
Accurate understanding of land use and cover is imperative for the development planning
of any area. Consequently, a wide range of professionals, including earth system scientists, land
and water managers, and urban planners, are interested in obtaining data on land use and cover
changes, conversion trends, and other related patterns. The spatial dimensions of land use and
cover support policymakers and scientists in making well-informed decisions, as alterations in
these patterns indicate shifts in economic and social conditions. Monitoring such changes with the
help of Advanced technologies like Remote Sensing and Geographic Information Systems is
crucial for coordinated efforts across different administrative levels. Advanced technologies like
Remote Sensing and Geographic Information Systems
9
Changes in vegetation cover refer to variations in the distribution, composition, and overall
structure of plant communities across different temporal and spatial scales. These changes can
occur natural.
Exploiting Artificial Intelligence for Empowering Researchers and Faculty, In...Dr. Vinod Kumar Kanvaria
Exploiting Artificial Intelligence for Empowering Researchers and Faculty,
International FDP on Fundamentals of Research in Social Sciences
at Integral University, Lucknow, 06.06.2024
By Dr. Vinod Kumar Kanvaria
A workshop hosted by the South African Journal of Science aimed at postgraduate students and early career researchers with little or no experience in writing and publishing journal articles.
How to Add Chatter in the odoo 17 ERP ModuleCeline George
In Odoo, the chatter is like a chat tool that helps you work together on records. You can leave notes and track things, making it easier to talk with your team and partners. Inside chatter, all communication history, activity, and changes will be displayed.
1. Maths curriculum in Polish
lower-secondary school
GIMNAZJUM IM. ANNY WAZÓWNY, GOLUB-DOBRZYŃ
2. Class 1 ( 13-14 years old) Class 2 ( 14-15 years old) Class 3 ( 15-16 years old)
Arithmetic Arithmetic Arithmetic
1. Rational numbers - repetition from the 1. Indices and roots 1. Real numbers - operations and their
primary school a) positive, negative and zero indices properties - repetition
a) natural numbers (multiples, factors, and the index laws for multiplication 2. Operations on real numbers - repetition
common factors, highest common and division of positive integer
factors, lowest common multiples powers,
and primes) b) laws of indices
b) integers a) standard index form,
c) fraction and decimals 2. Roots
d) rounding off a) square and cube roots
2. Percentages b) simplifying roots, adding and
a) expressing percentage as a fraction or subtracting square roots, multiplying
decimal roots, dividing by square/cube roots,
b) expressing one quantity as a c) basic rule of radicals: roots/surds -
percentage of another irrational numbers
c) increasing/decreasing a quantity by a d) rationalisation of denominators ( type
given percentage reverse percentages a a d
d) problems involving percentages of ,
b c b c
quantities and percentage increases
or decreases;
e) problems involving, e.g., mobile
phone tariffs, currency transactions,
shopping, VAT, discount, simple
interest
Algebra Algebra Algebra
1. Algebraic expressions 1. Algebraic expressions 1. Functions
a) monomials, binomials and a) expanding the product of two linear a) the intuitive concepts of functions,
polynomials expressions including squaring a domains and co-domains, range,
b) translation of simple real-world linear expression independent and dependent variables
situations into algebraic expressions b) multiply expressions of the form e.g.: b) the notation of functions and use
c) collecting like terms, simplifying (ax + b)(cx + d) tabular, algebraic and graphical
expressions, substituting, (ax + b)( cx2+ dx + e) methods to represent functions
3. d) simplifying polynomial expressions c) multiplication of polynomials a) simple linear functions and plot the
by adding, subtracting, and d) use of special products: corresponding graphs arising from
multiplying (a ± b)2 = a2 ± 2ab + b2 real-life problems;
e) multiplying a single term over a a2 − b2 = (a + b)(a − b) b) zeros of functions,
bracket, f) rationalisation of denominators c) determine y-intercept and x-intercept
f) taking out single term common
( types a a b c d) plot graphs of simple quadratic
factors, , )
b c d e functions y = ax2 + b, y = a
g) rearrange formulae 2. Linear simultaneous equations - x
2. Linear equations and inequalities algebraic methods 2. Linear functions
a) linear equations in one unknown, a) the substitution method a) Linear simultaneous equations -
with integer or fractional coefficients b) the elimination method. graphical method
b) formulate a linear equation in one c) find the exact solution of two b) interpreting and finding the equation
unknown to solve problems simultaneous equations in two of a straight line graph in the form
c) solve simple linear inequalities in unknowns by eliminating a variable, y = mx + c
one variable, and represent the and interpret the equations as lines c) condition for two lines to be
solution set on a number line and their common solution as the parallel or perpendicuar
d) types of intervals point of intersection d) finding the gradient of a straight
3. Direct and inverse proportion d) formulate a pair of linear equations in line given the coordinates of two
two unknowns to solve problems points on it
e) determine the equation of a line,
given its graph, the zero and y-
intercept, or two points on
the line.
3. Finding the exact solution of two
simultaneous equations in two
unknowns using determinants
4. System of three linear equations in
three variables
5. Absolute value and distance
Statistics and Probability
1. Finding, collecting and organising data
2. Representing data graphically and
4. numerically
3. Analysing, interpreting and drawing
conclusions from data
4. Mean, median, mode
5. Outcomes of simple random processes
a) Finding the probability of equally
likely outcomes - examples using
coins, dice, urns with different
coloured objects, playing cards,
Geometry Geometry Geometry
1. Basic figures - plane geometry 1. Circle 1. Similar figures
a) segments and lines a) centre, radius, chord, diameter, 2. Similarity of triangles
b) properties of angles at a point, angles circumference, tangent, arc, sector 3. Properties of similar polygons
on a straight line (including right and segment, tangent corresponding angles are equal
angles), perpendicular lines, and b) circumferences of circles and areas corresponding sides are proportional
opposite angles at a vertex - vertically enclosed by circles 4. Ratio of areas of similar plane figures
opposite angles c) arc length and sector area 5. Make and use scale drawings and
c) alternate angles and corresponding d) area of a segment interpret maps
angles e) symmetry properties of circles 6. Ratio of volumes of similar solids
2. Properties of triangles the perpendicular bisector of a 7. Map scales (distance and area)
a) types of triangles chord passes through the centre 8. Theorem of Thales
b) segments in triangles (altitudes and tangents from an external point 9. Pyramids
medians) are equal in length a) surface area of pyramids
c) angle properties of equilateral, the line joining an external point b) draw simple nets of solids e.g. regular
isosceles and right-angled triangles to the centre of the circle bisects tetrahedron, square based pyramid,
d) the interior angles and exterior angle the angle between the tangents ect.
of a triangle f) angle properties of circles 10. Cylinder, cone and sphere
e) similarity of triangles (SSS, SAS, 2. Right triangles a) volume and surface area of cylinder,
ASA)and of other plane figures a) Theorem of Pythagoras cone and sphere
b) determining whether a triangle is 11. Trigonometric functions in right
3. Quadrilaterals right-angled given the lengths of triangles
a) properties of special types of three sides a) use of trigonometric ratios (sine,
quadrilateral, including square, a) equilateral triangle and its properties cosine and tangent) of acute
5. rectangle, parallelogram, trapezium (the formulas of the height and the angles to calculate unknown sides
and rhombus; area of an equilateral triangle) and angles in right-angled
b) classification of quadrilaterals by c) special right triangles - properties of triangles
their geometric properties sides in right triangles of 30°, 60°, 90° b) simple trigonometrical problems
4. Areas of triangles and quadrilaterals and of 45°, 45°, 90° in two and three dimensions
5. Angle sum of interior and exterior angles 3. Polygons and circles including angle between a line and
of any convex polygon b) use a straight edge and compasses to a plane
6. Cartesian coordinates in two dimensions construct: – the midpoint and
a) finding the length of a line segment perpendicular bisector of a line
given the coordinates of its end segment – the bisector of an angle
points c) properties of perpendicular bisectors
b) midpoint of line segment of line segments and angle bisectors
c) finding the area of simple rectilinear d) constructions: inscribed and
figure given its vertices circumscribed circles of a triangle,
7. Central symmetry and axial symmetry of and a tangent line to a circle from a
plane figures point outside a circle
8. Properties of perpendicular bisectors of e) inscribed and circumscribed circles of
line segments and angle bisectors a triangle
9. Construction of simple geometrical f) the radius of the inscribed circle and
figures from given data using compasses, circumscribed circle in an equilateral
ruler, set squares and protractors, where triangle/a right triangle
appropriate g) inscribed and circumscribed
quadrilaterals
h) inscribed and circumscribed
polygons
i) regular polygons
j) calculating the interior or exterior
angle of any regular polygon
k) inscribed and circumscribed
regular polygons
4. Polyhedra - prisms
a) surface area of cuboids and
(rigth)prisms
6. b) volumes cuboids and (rigth)prisms
c) draw simple nets of solids, e.g.
cuboid, triangular prism etc.
The topics in red are out of the curriculum but I am usually able to introduce these topics to my students because I prepare them to
different Maths contests.