Downloaded 166 times
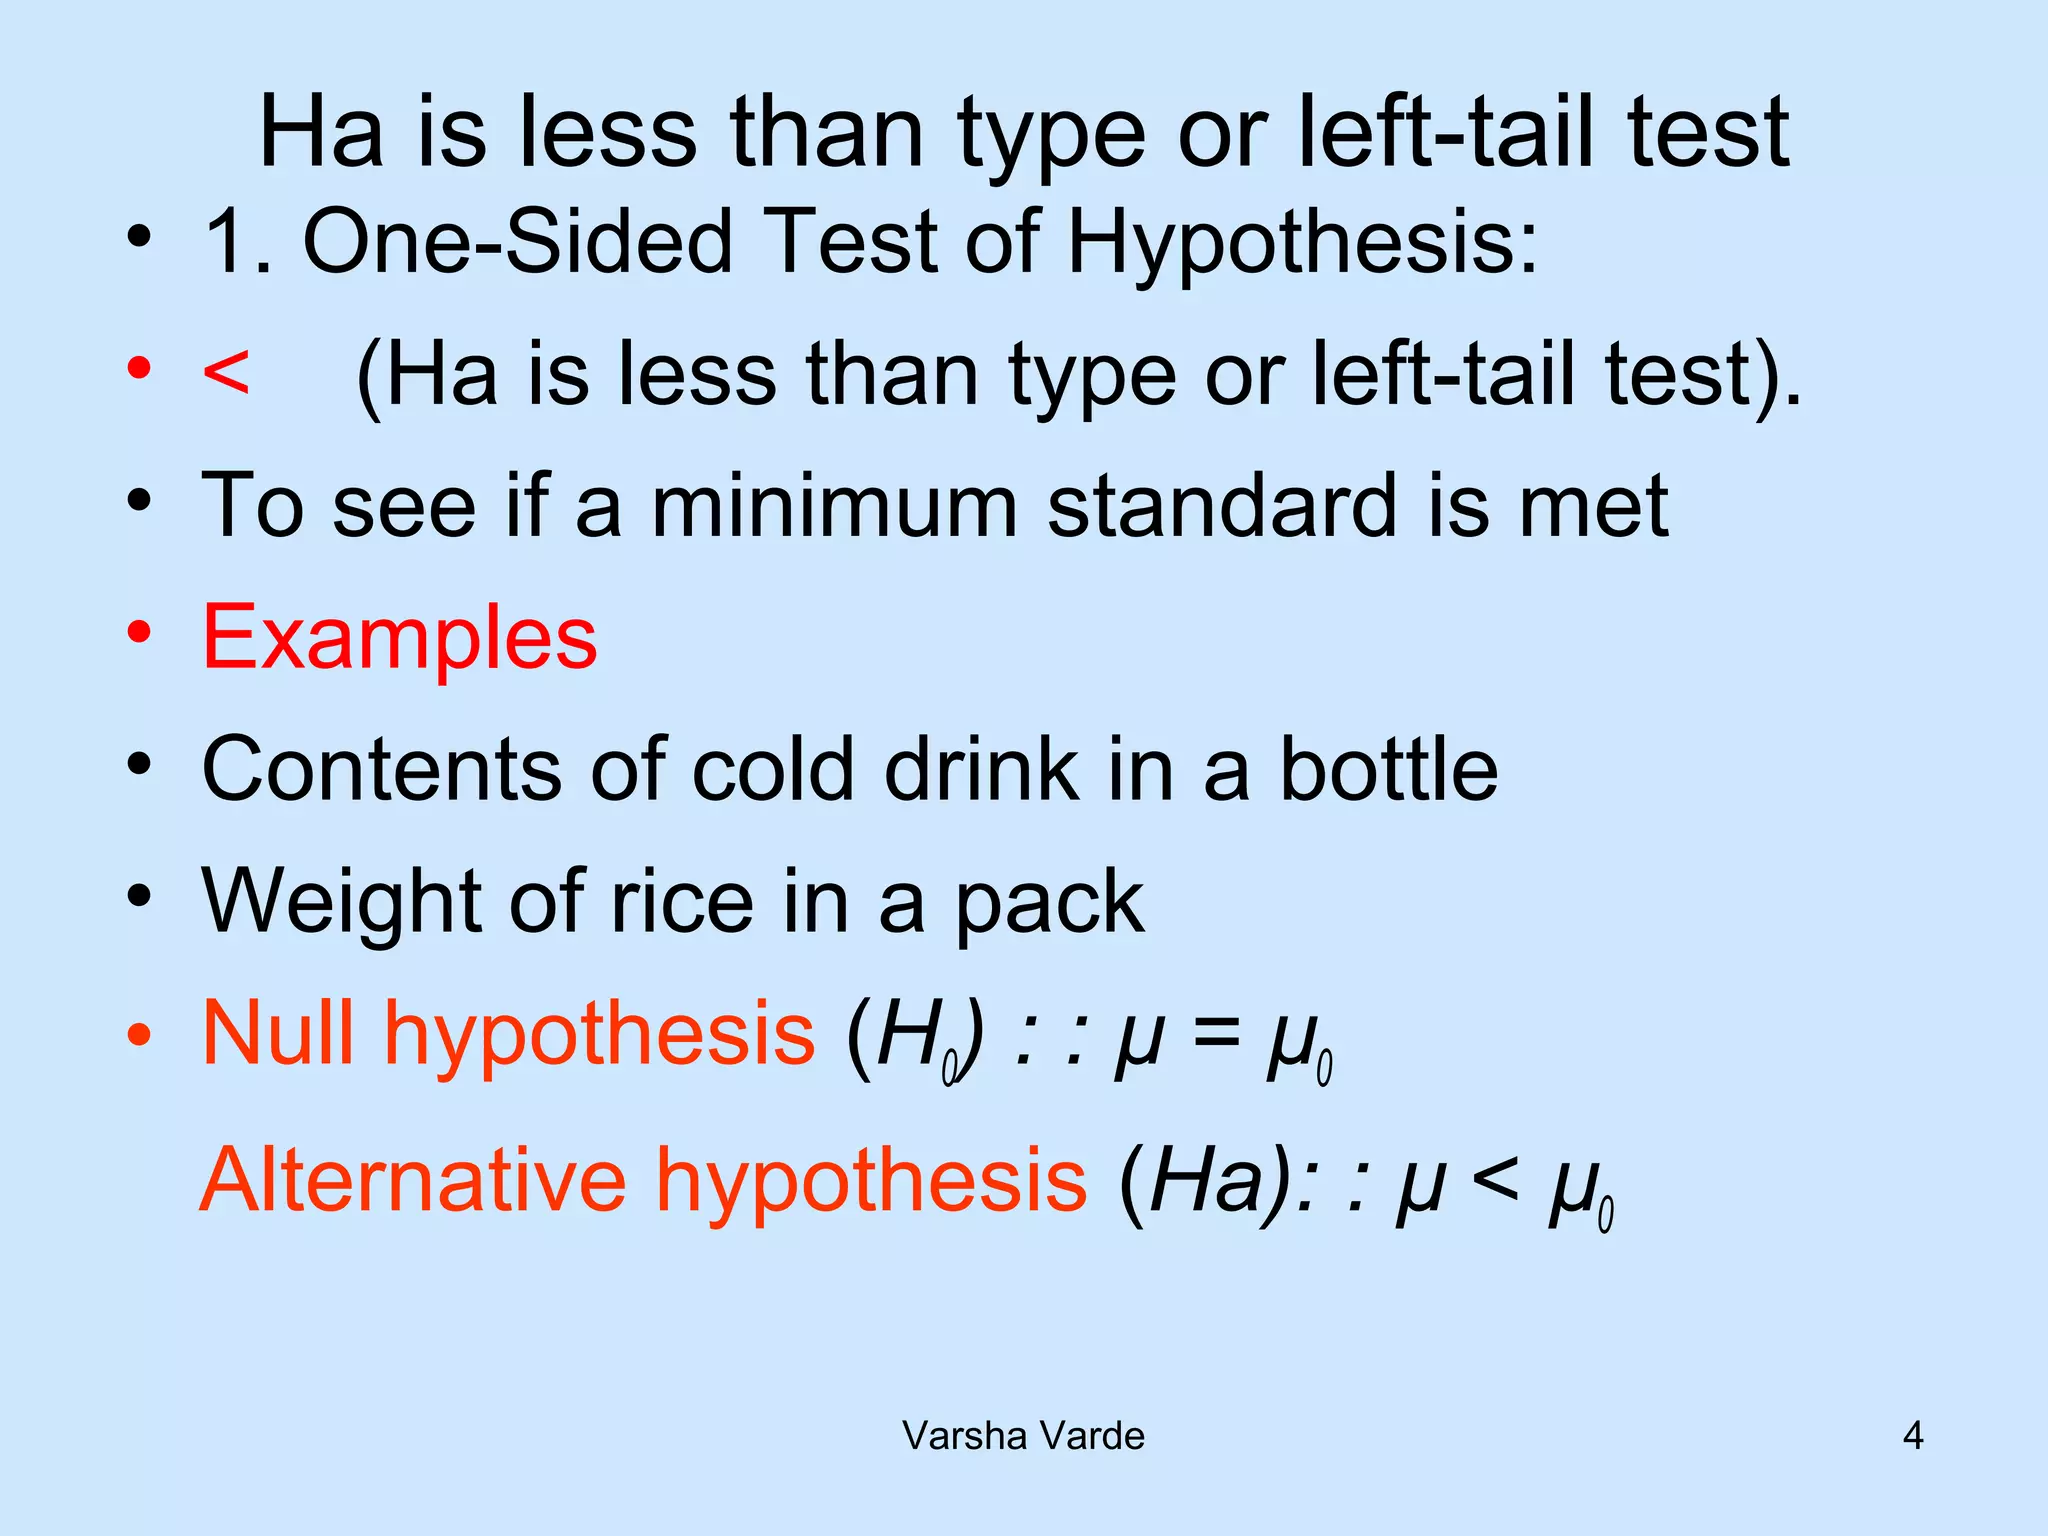
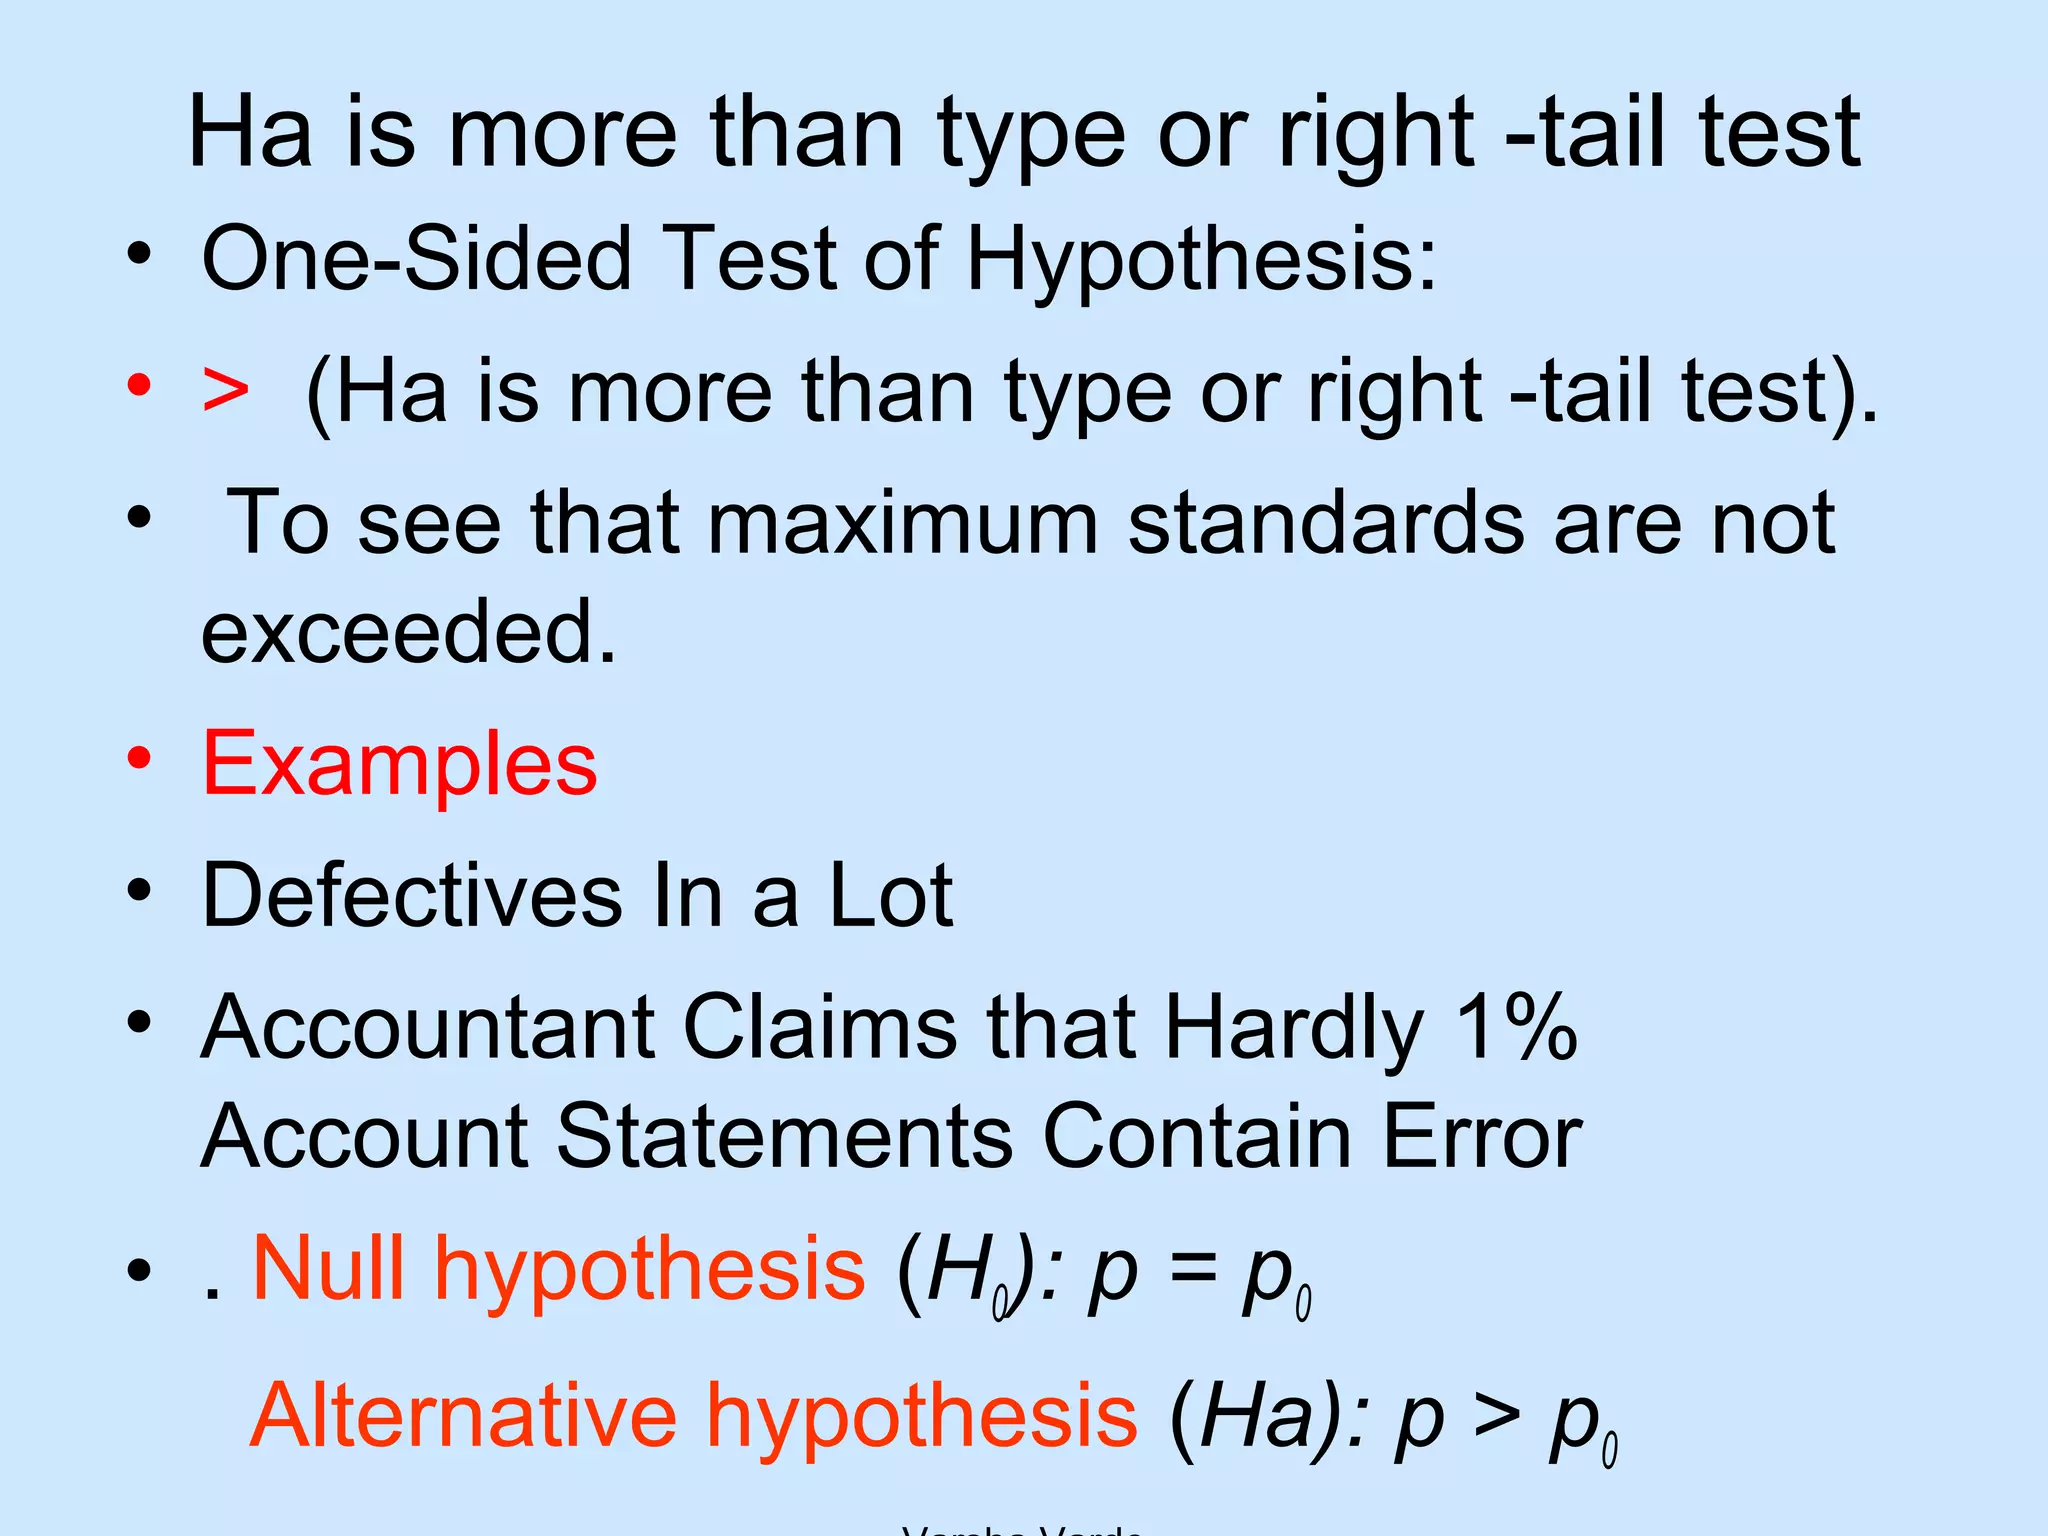
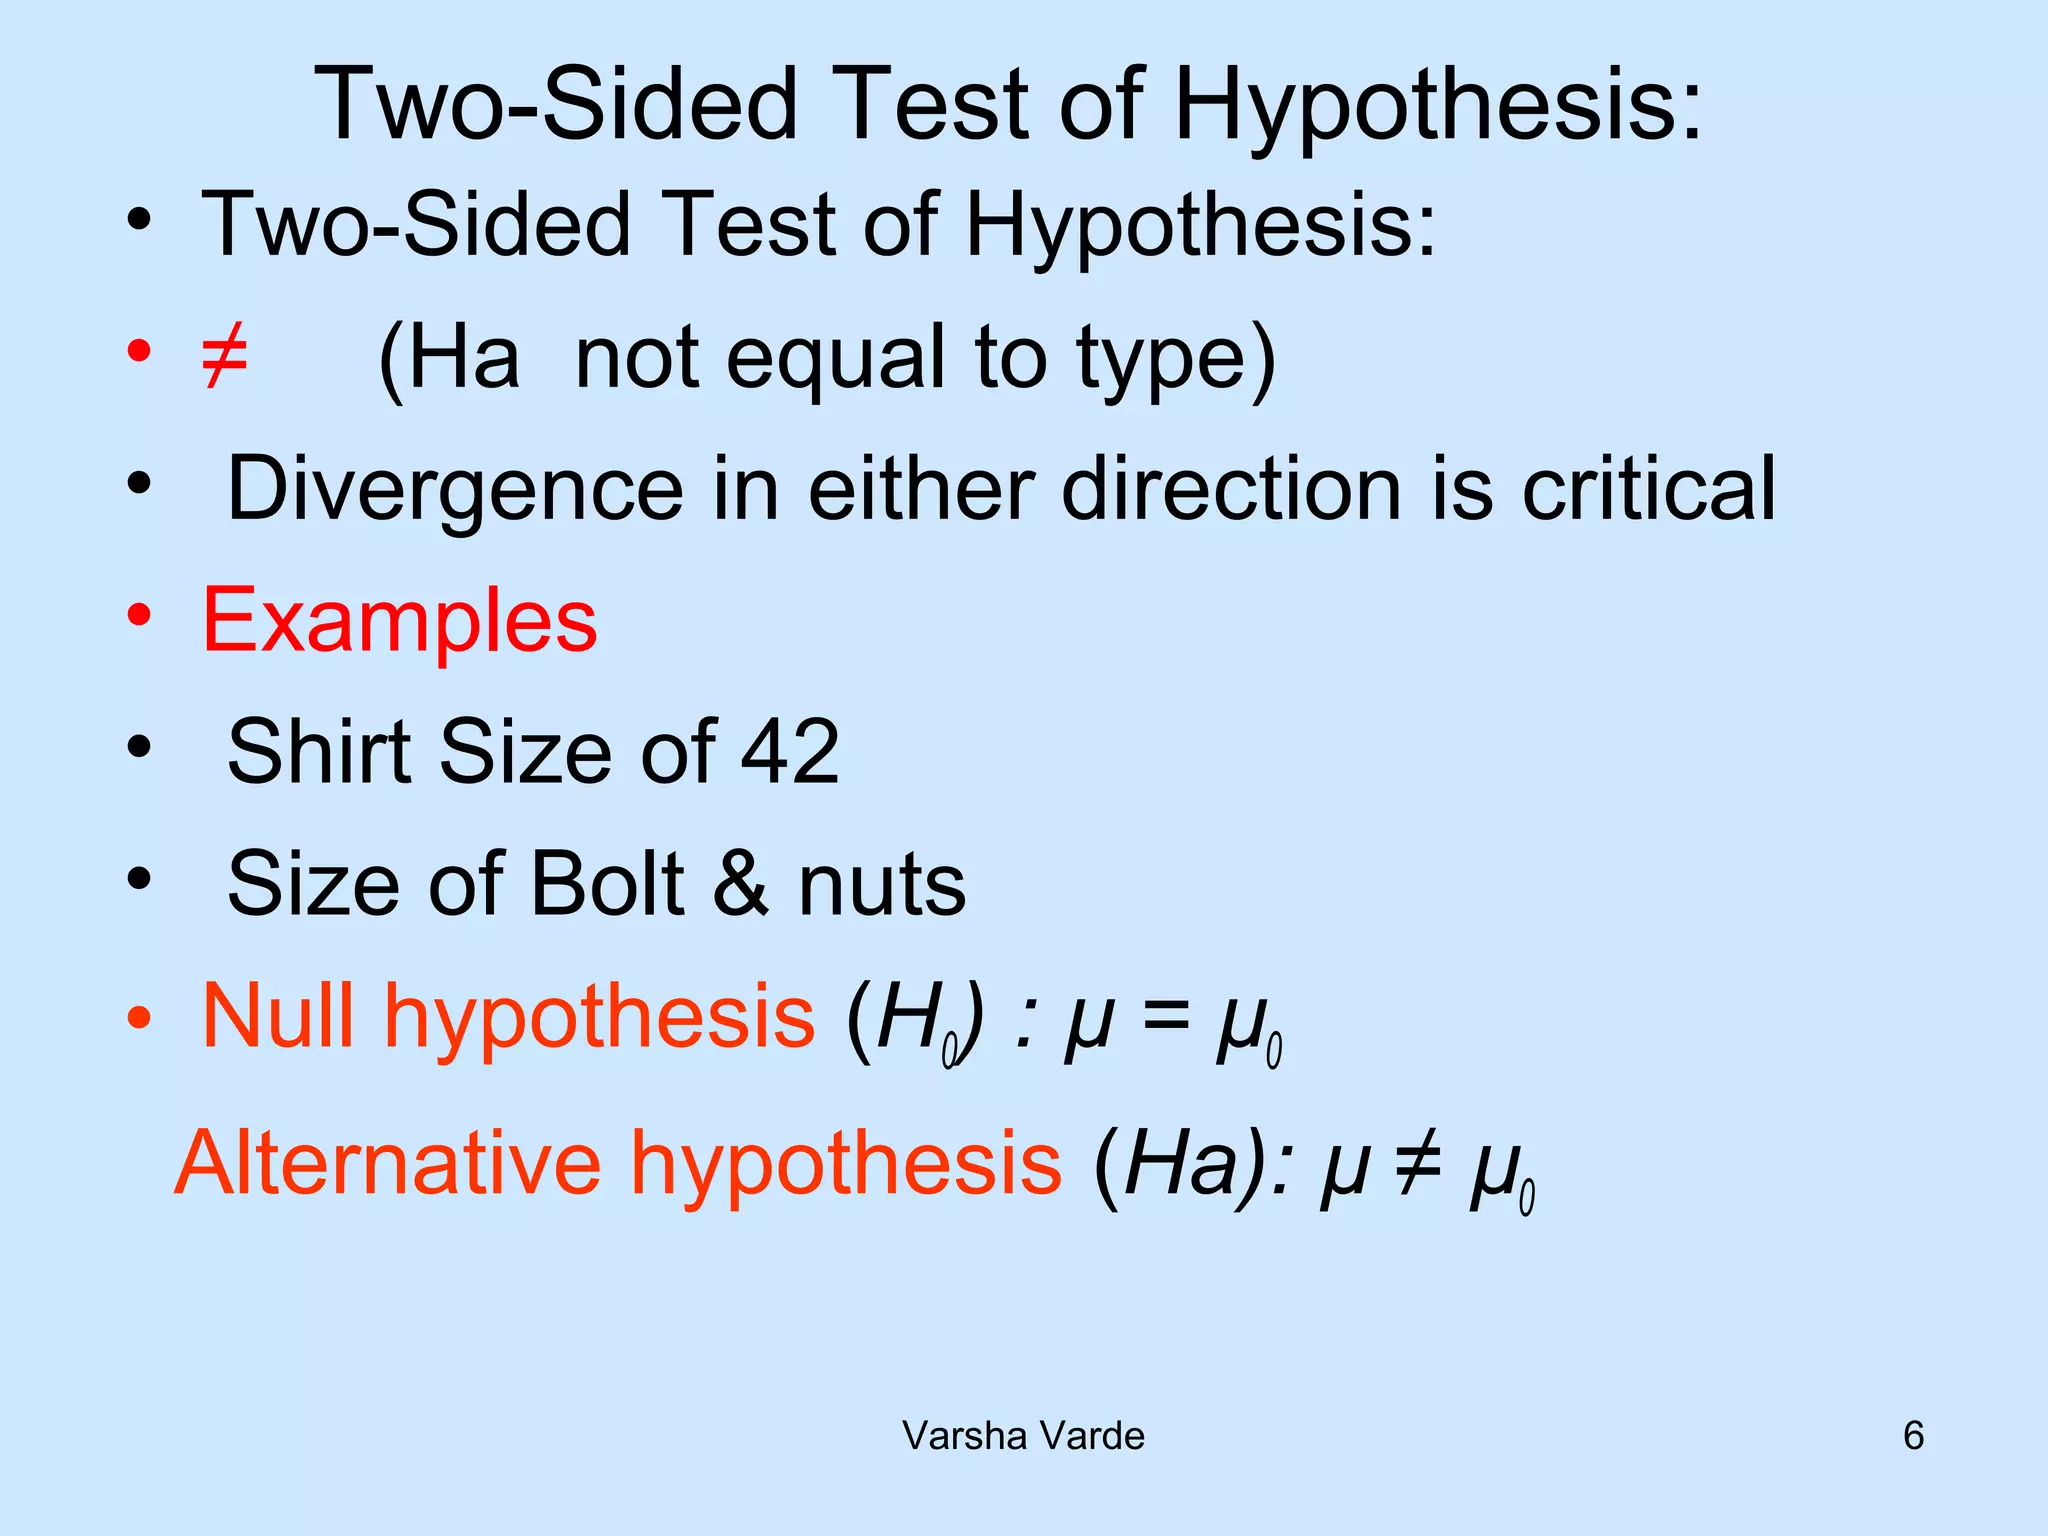
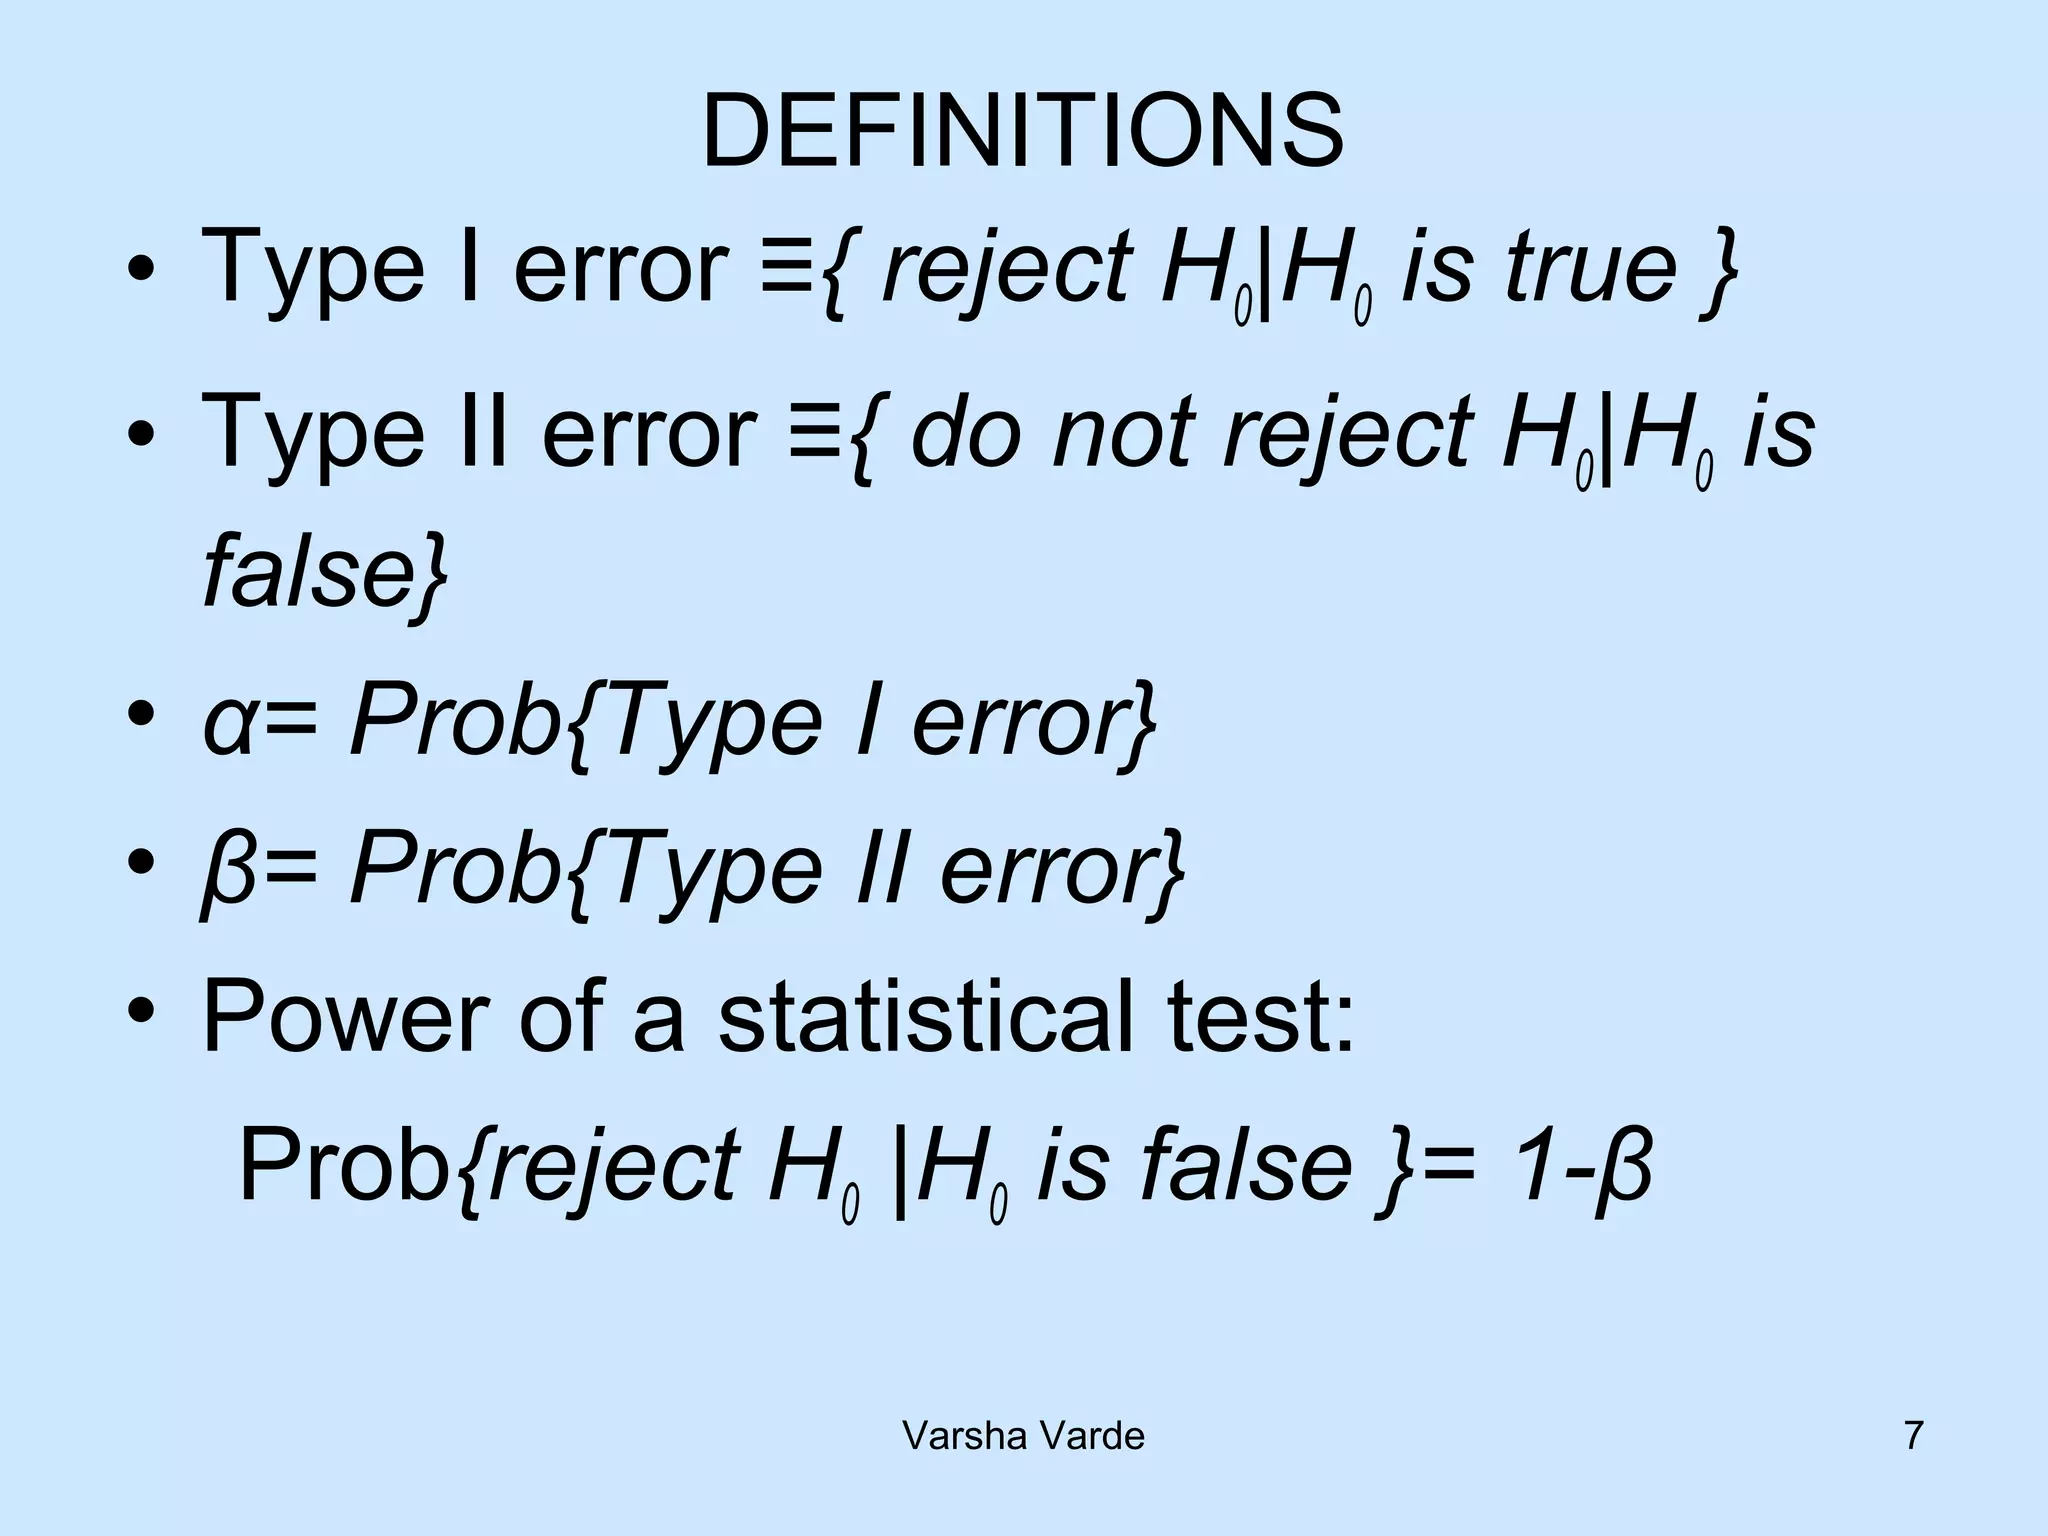
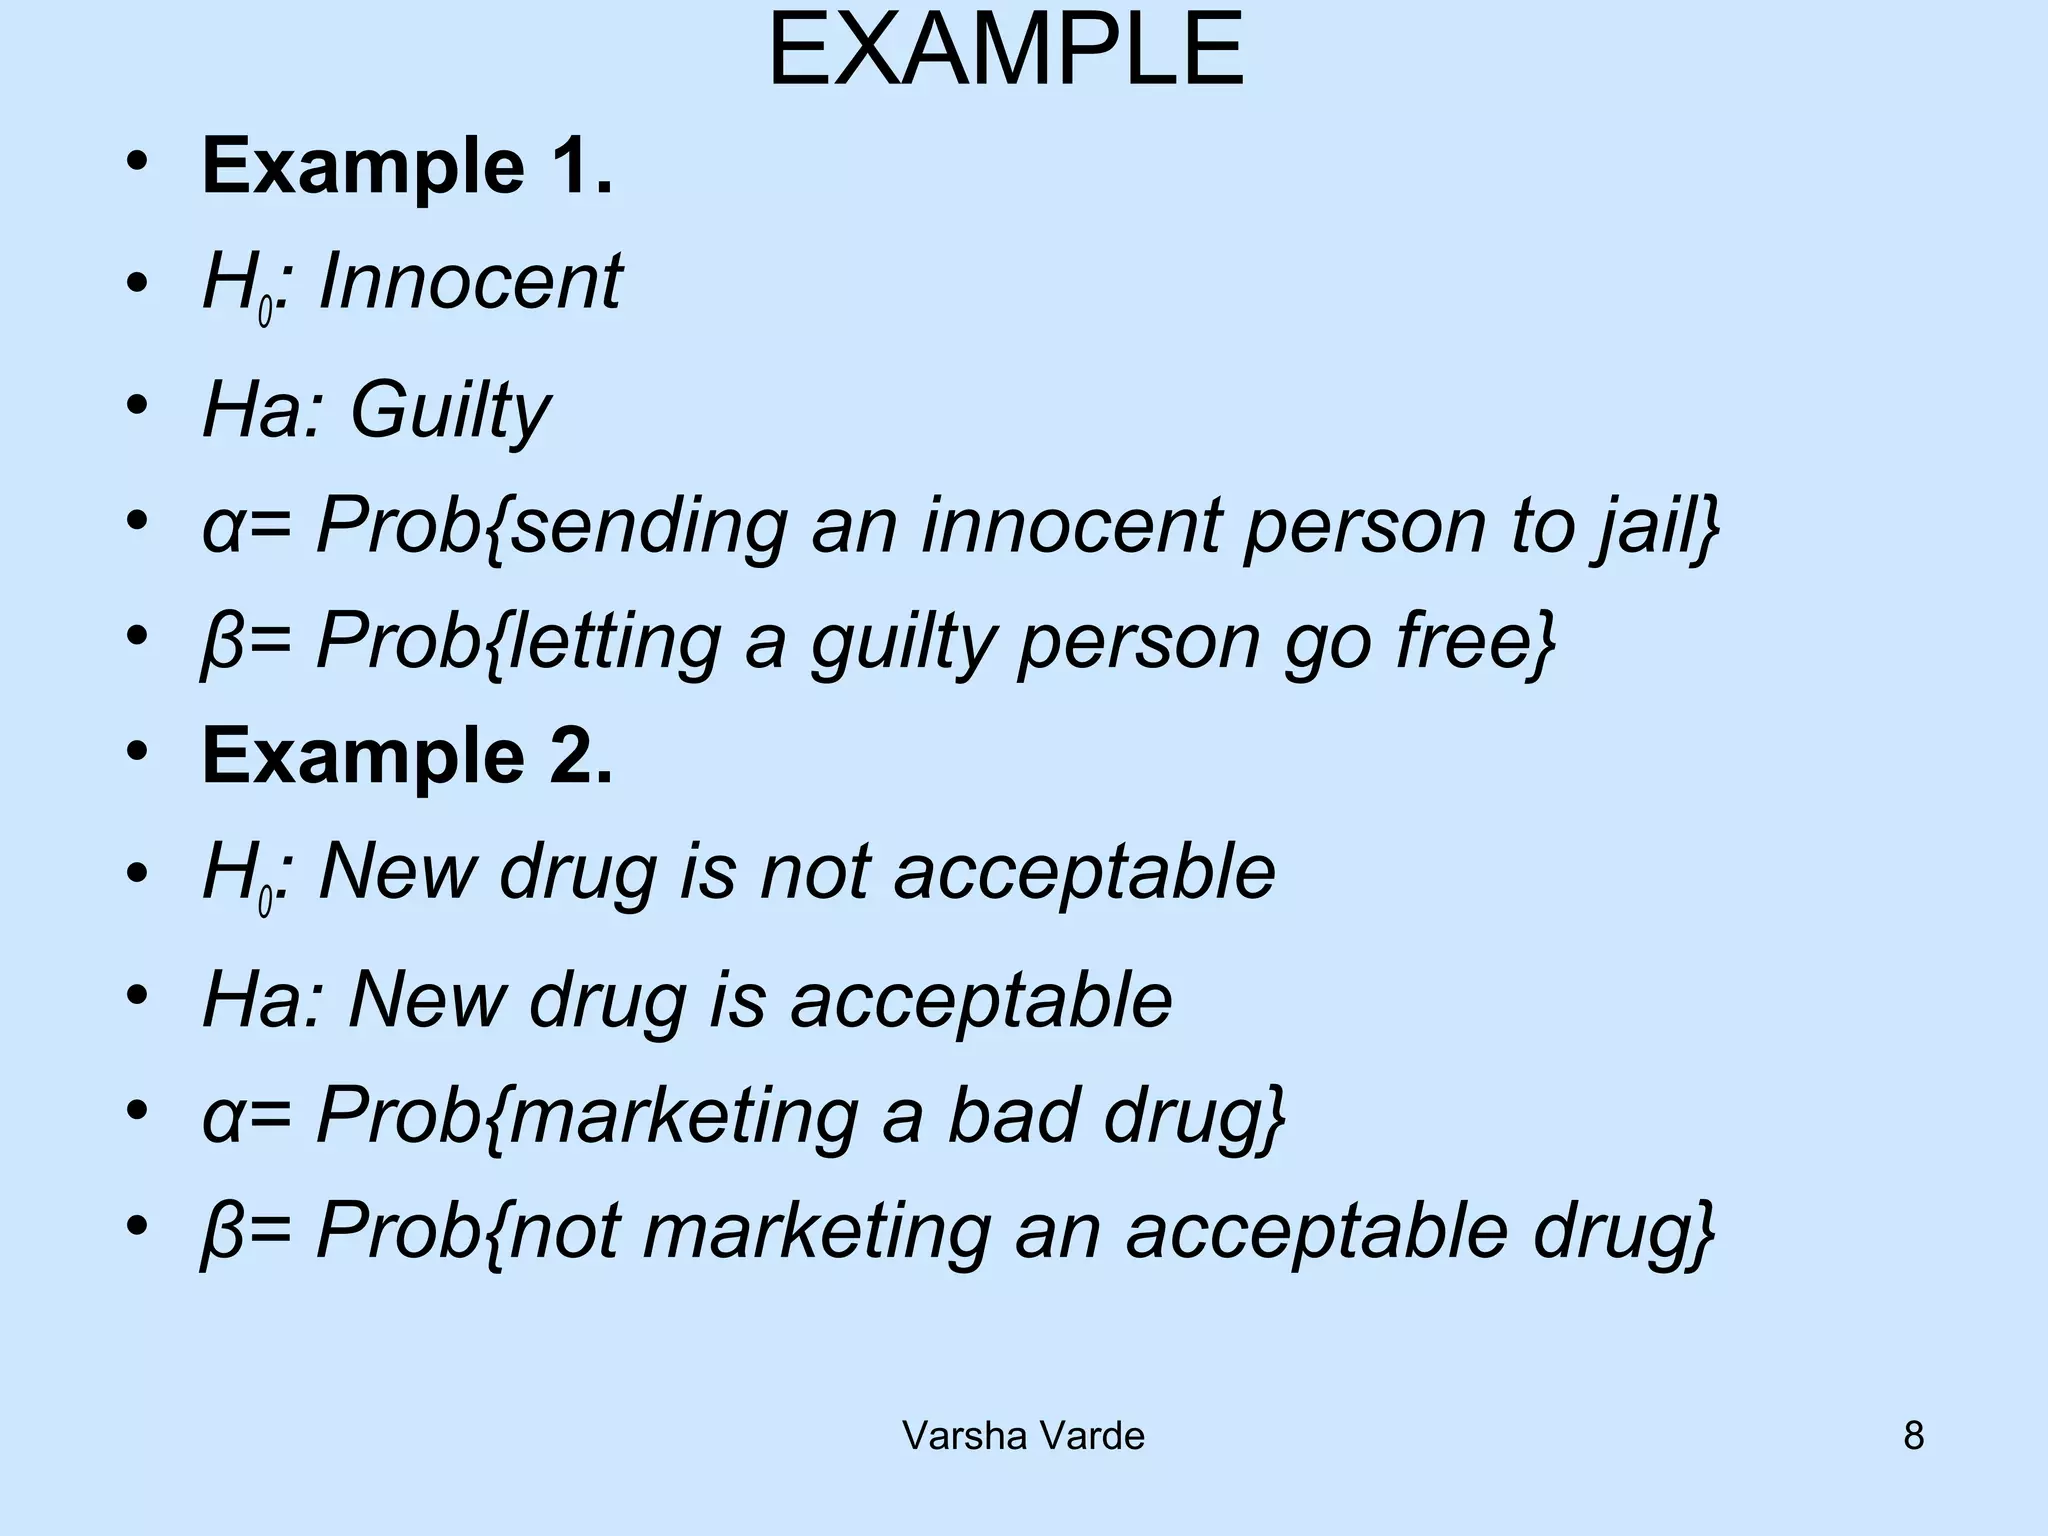
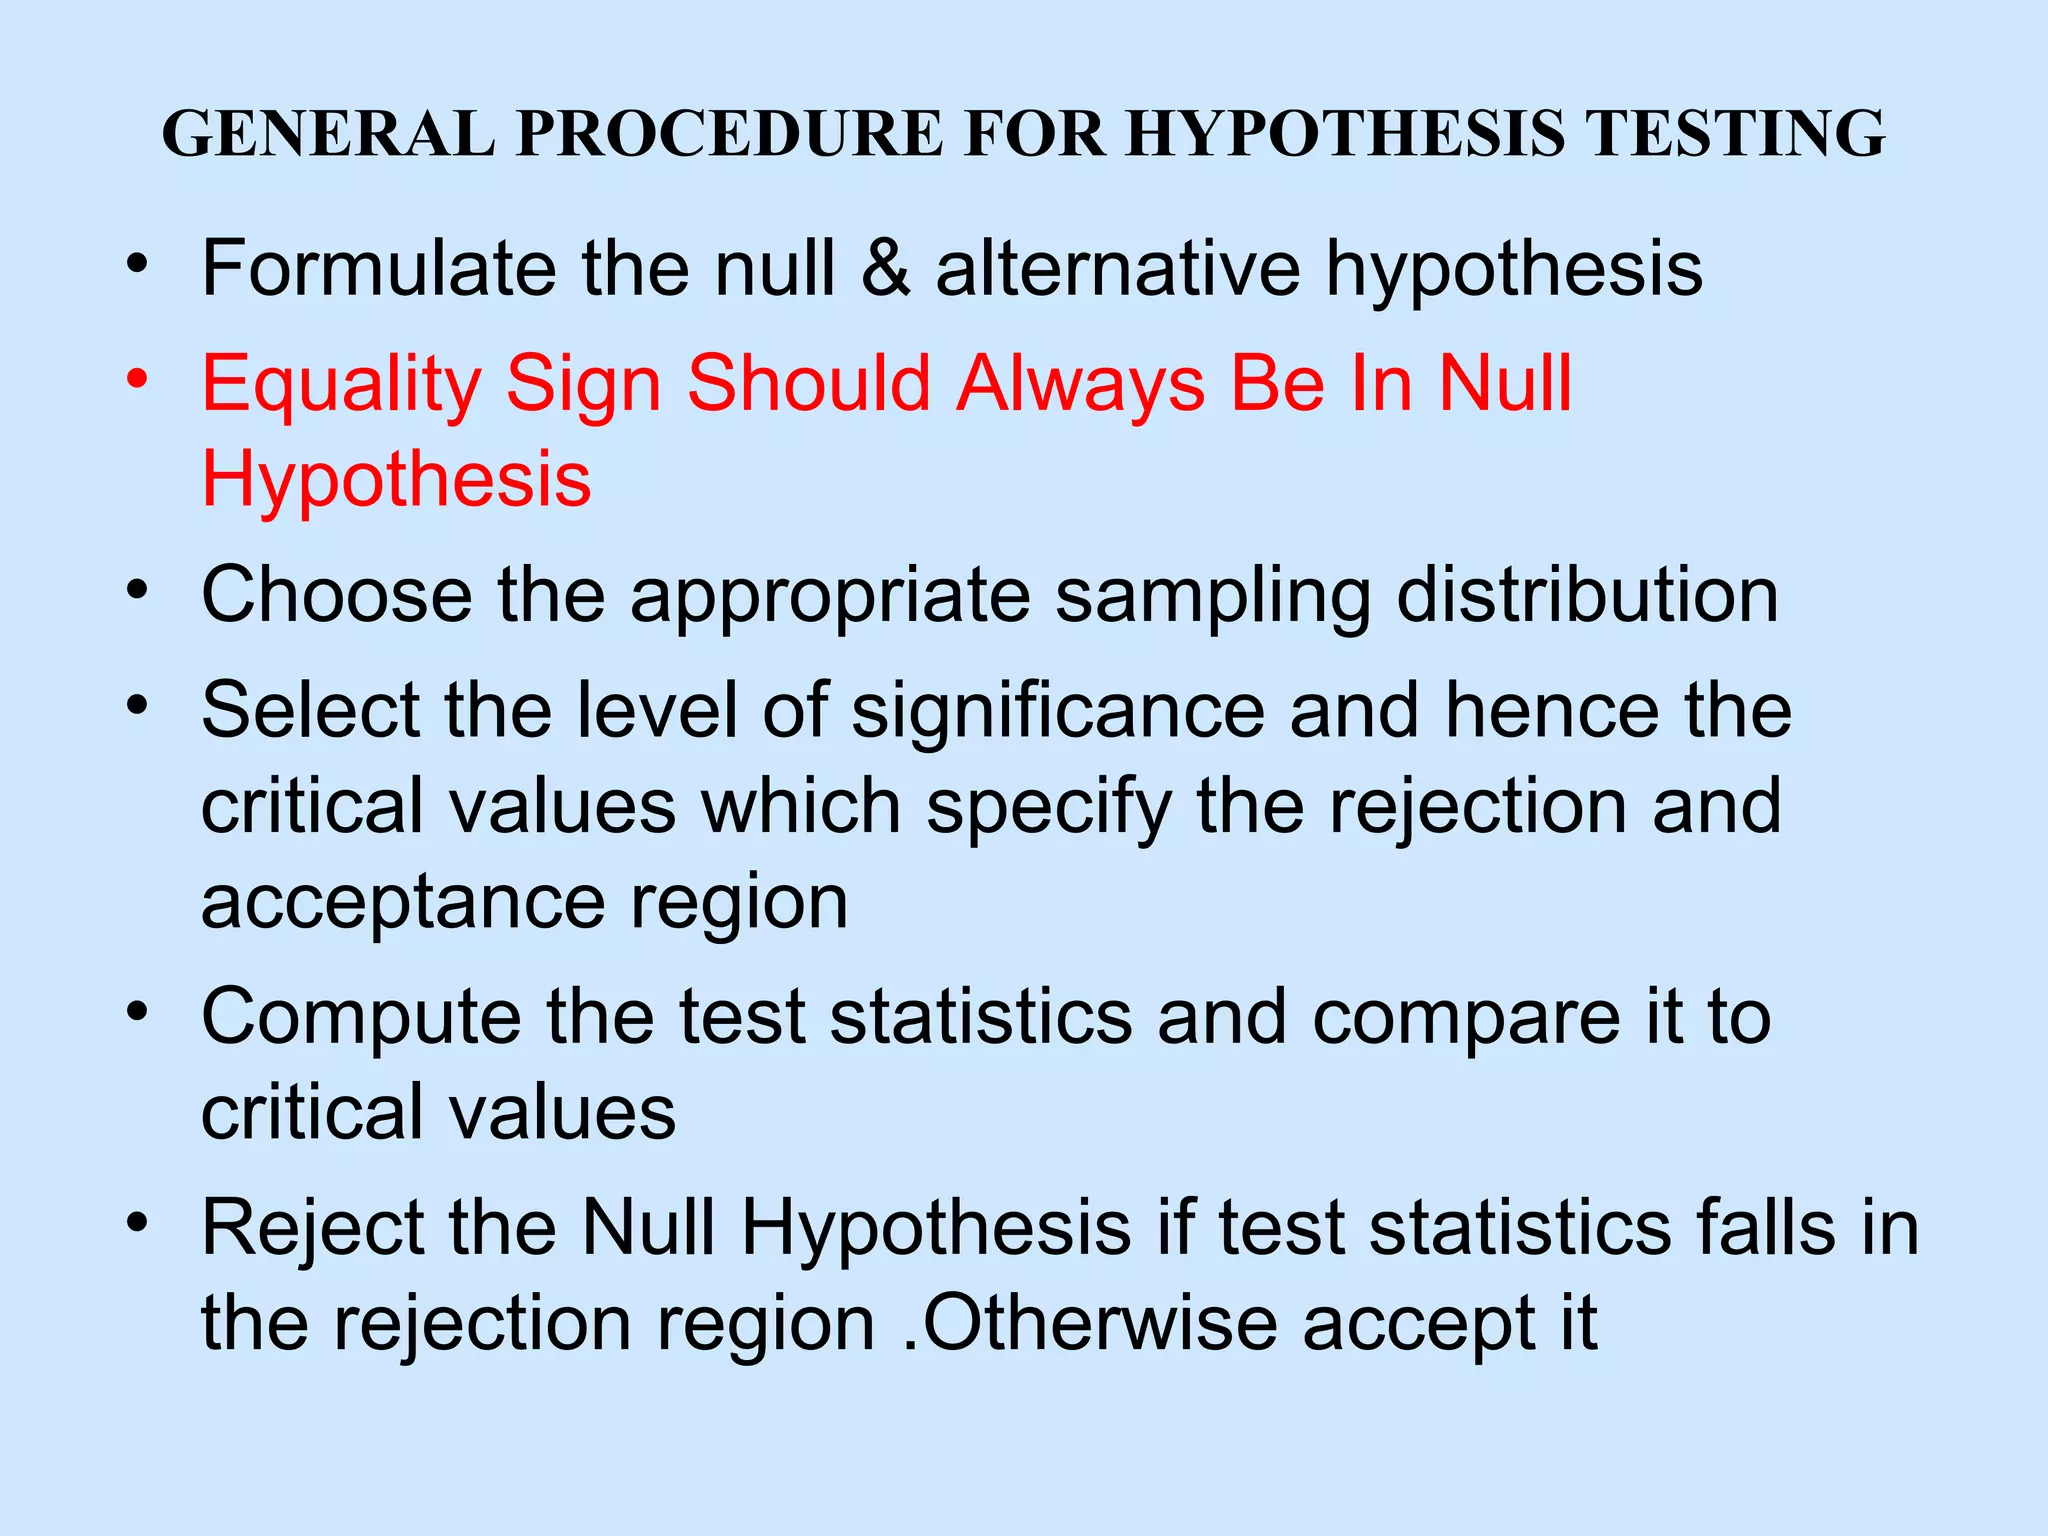
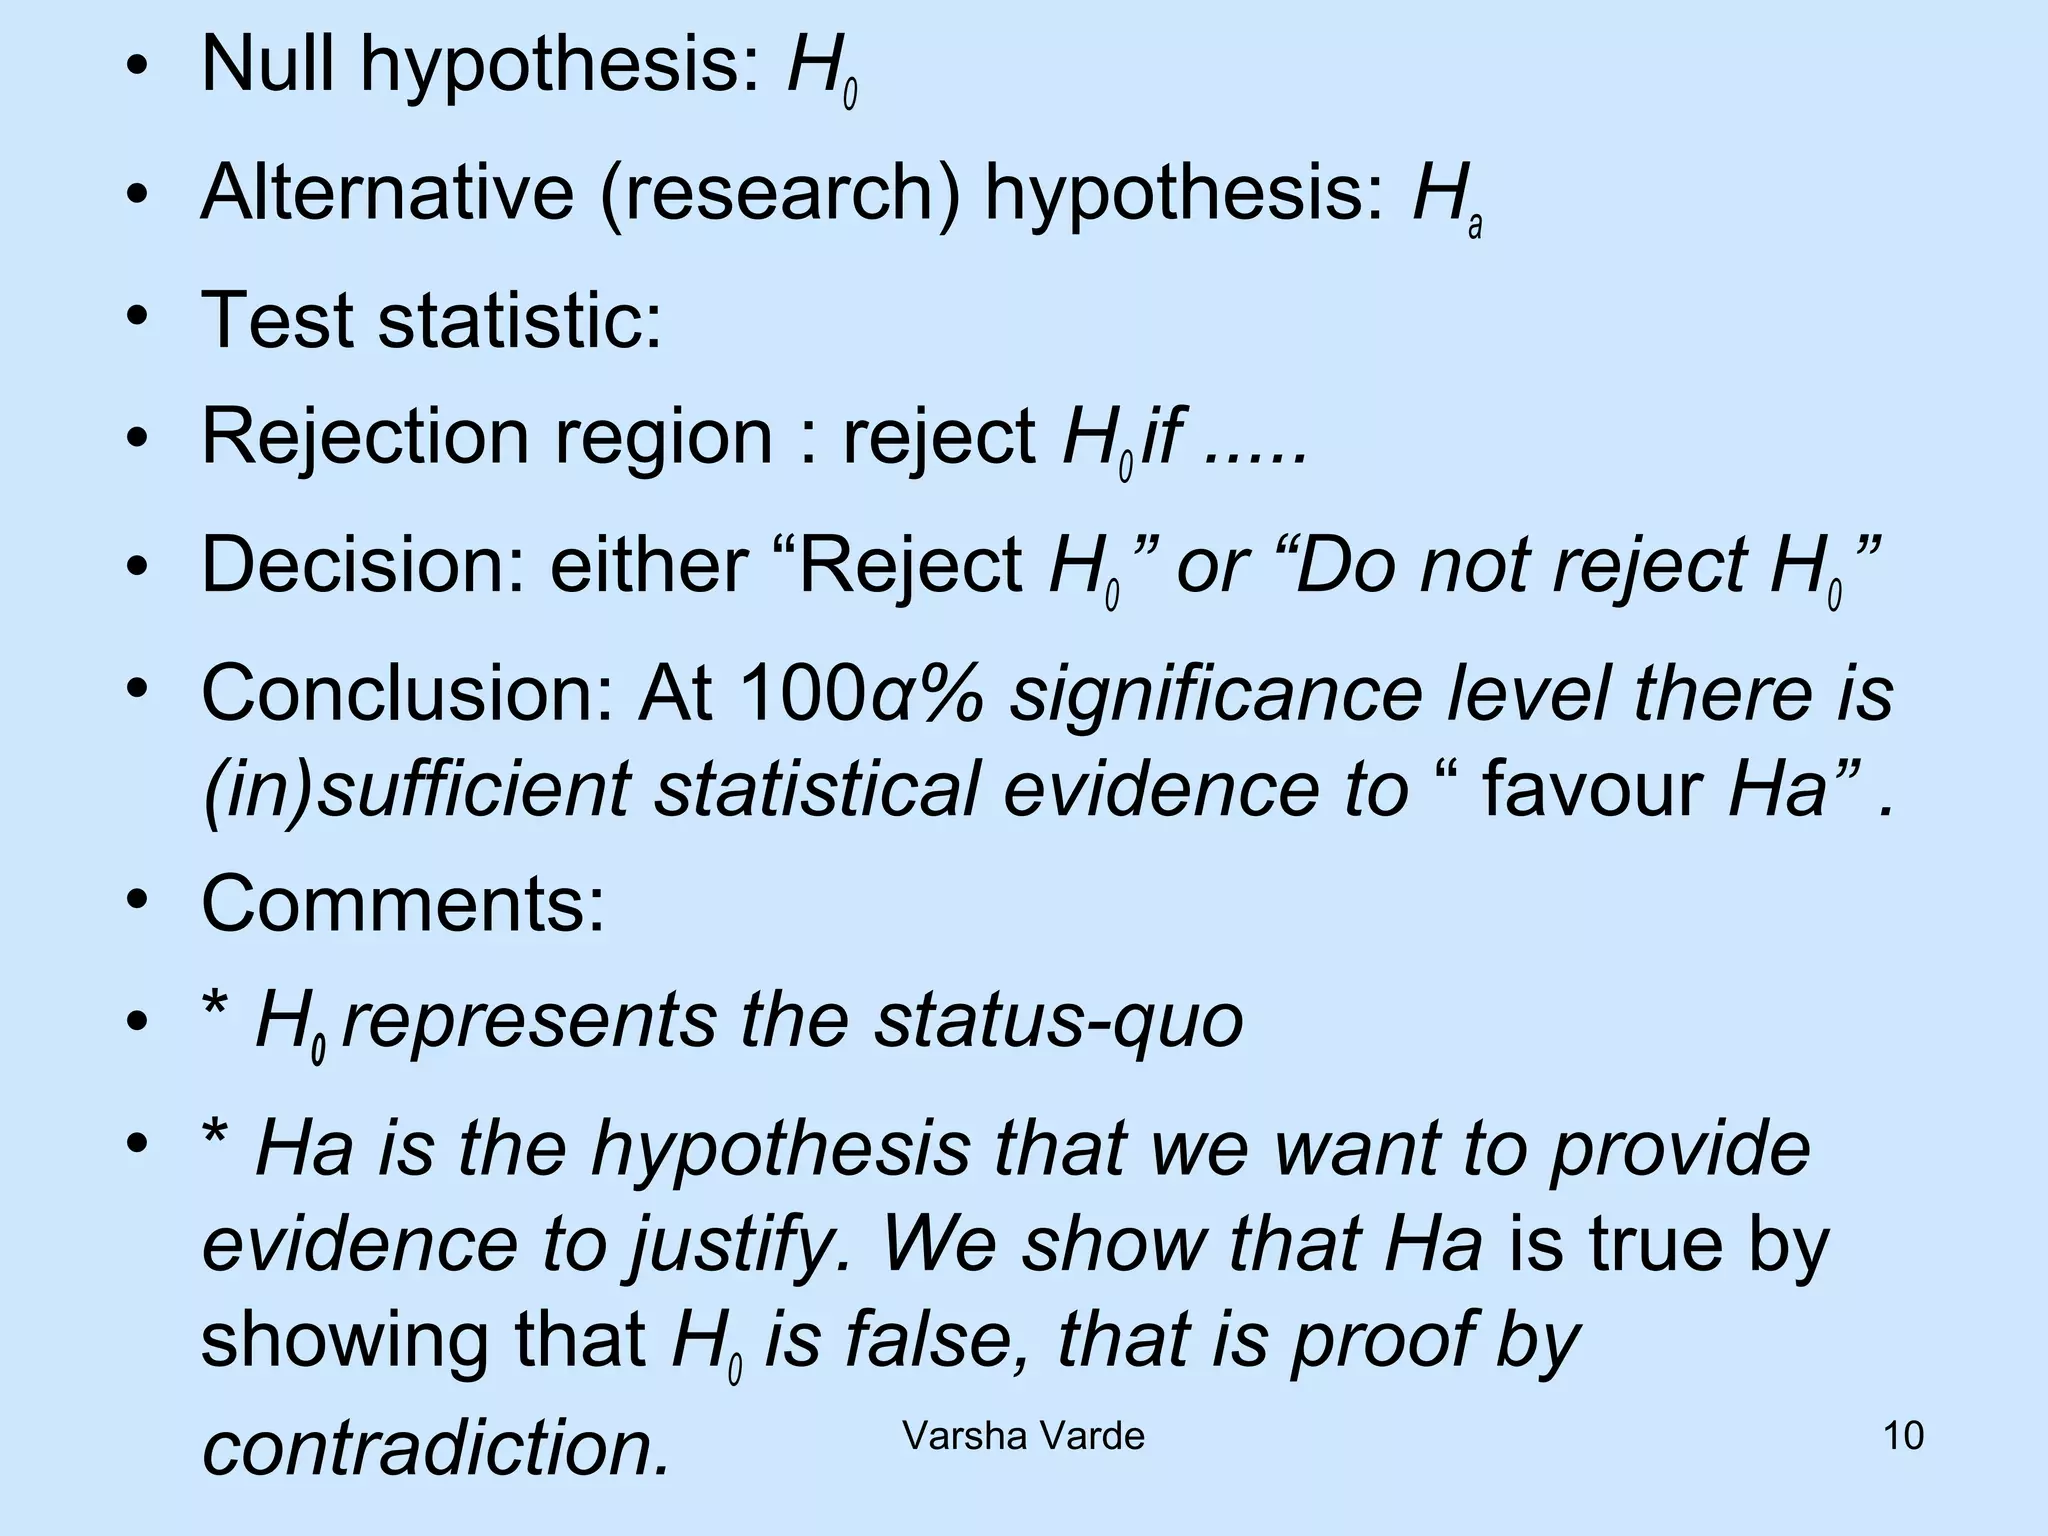
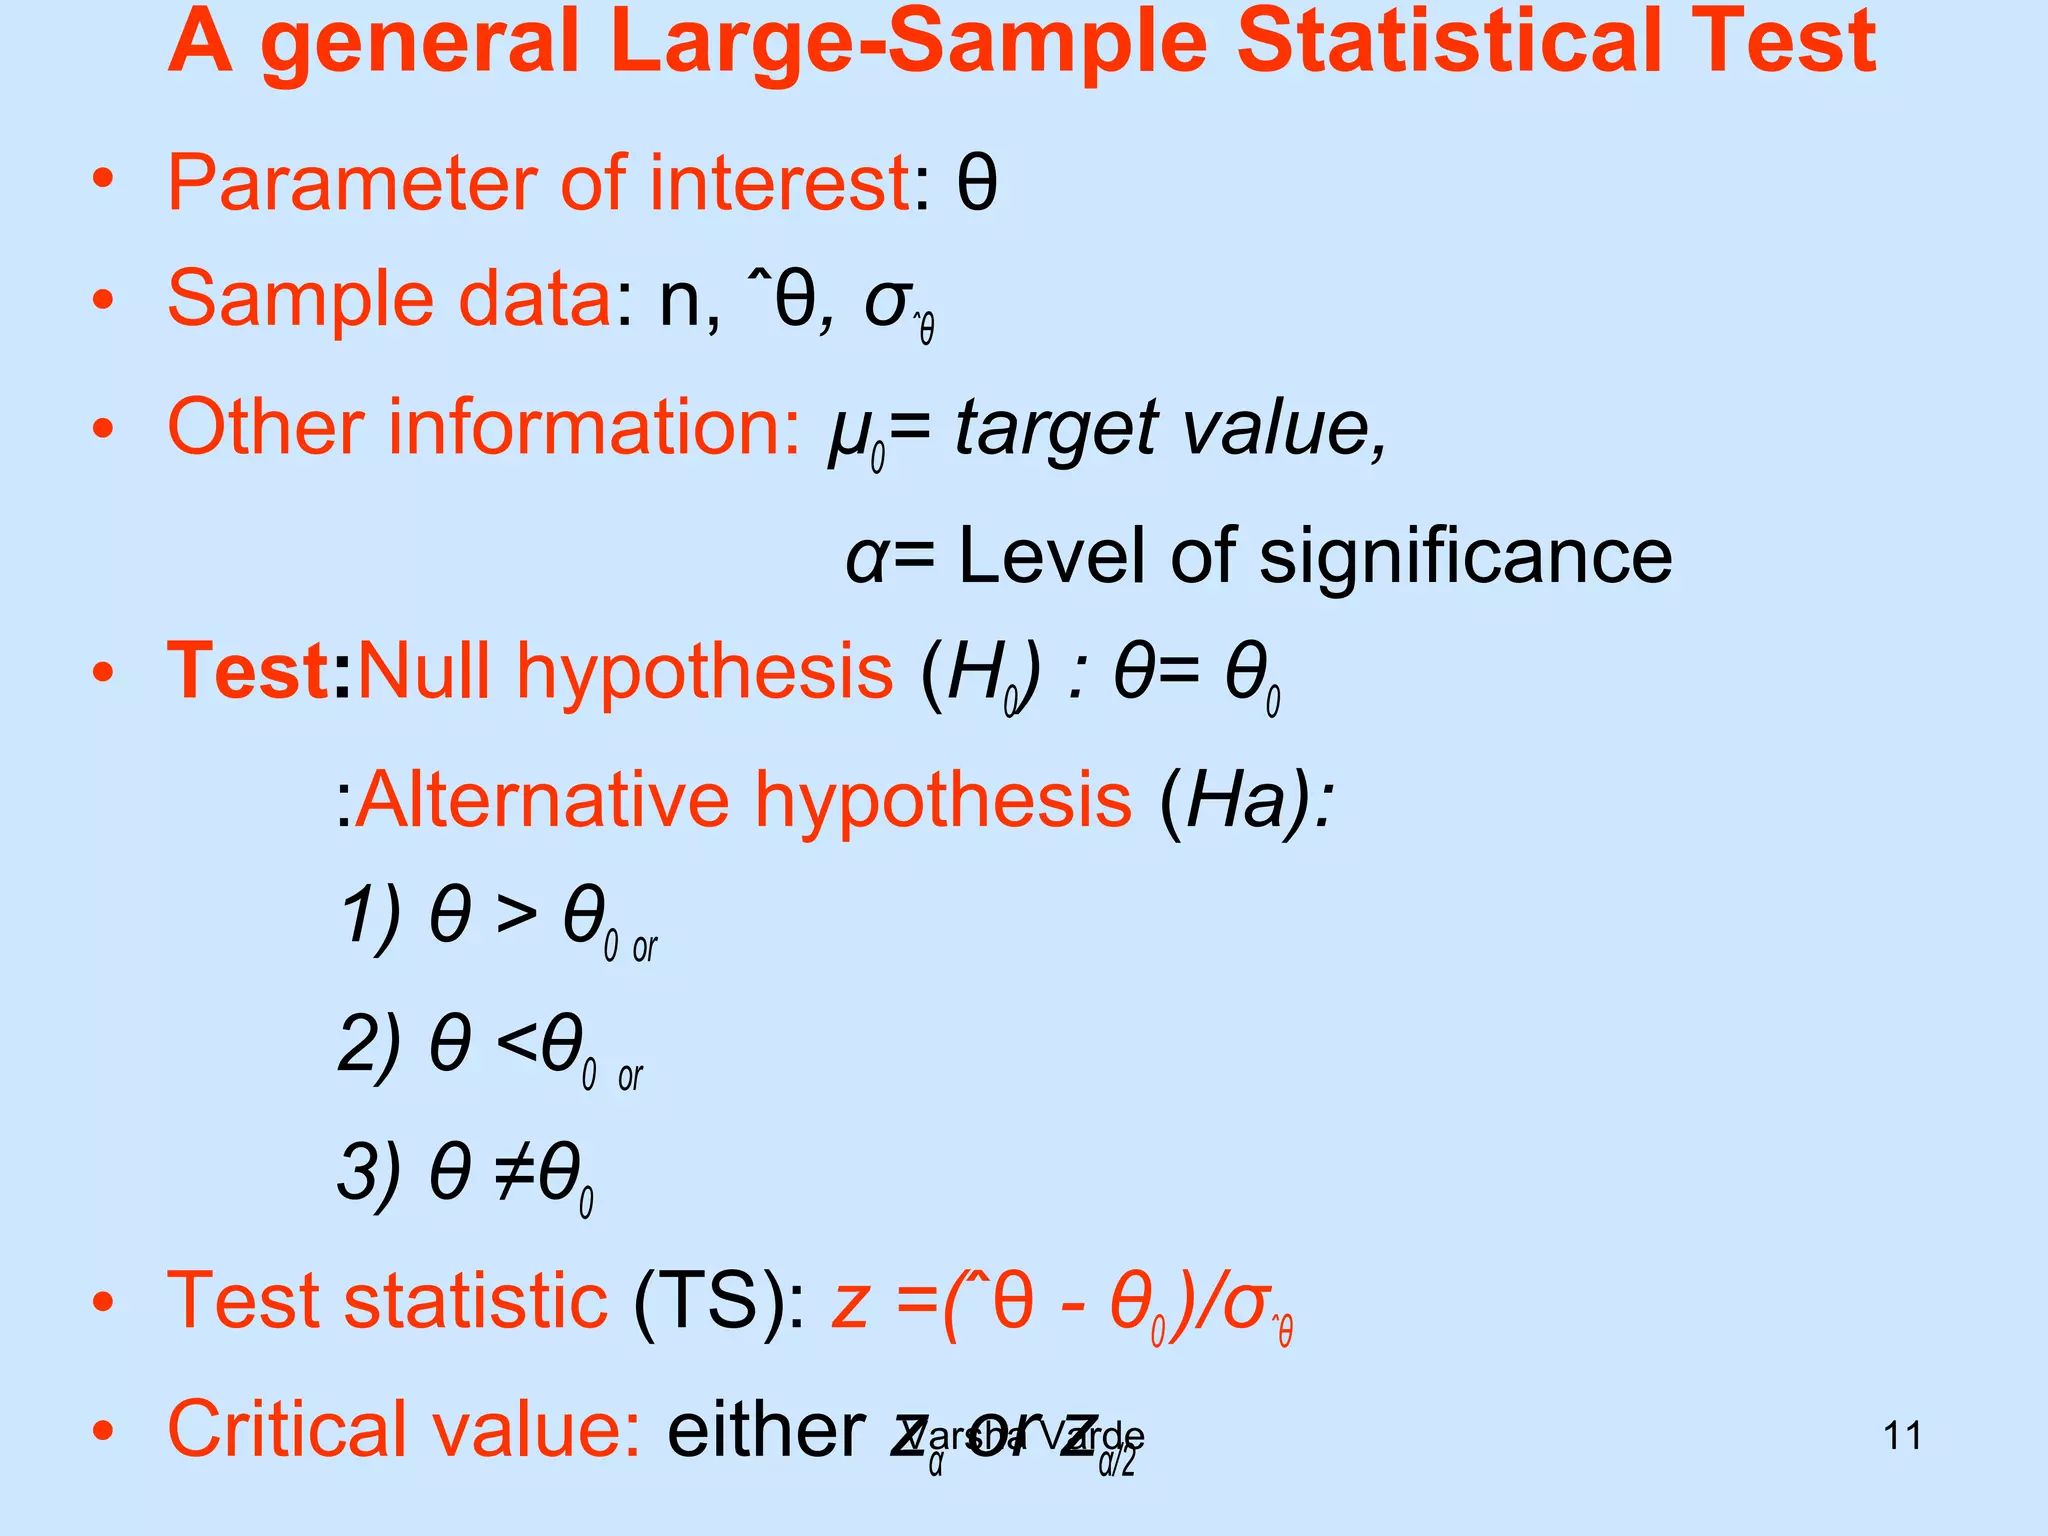
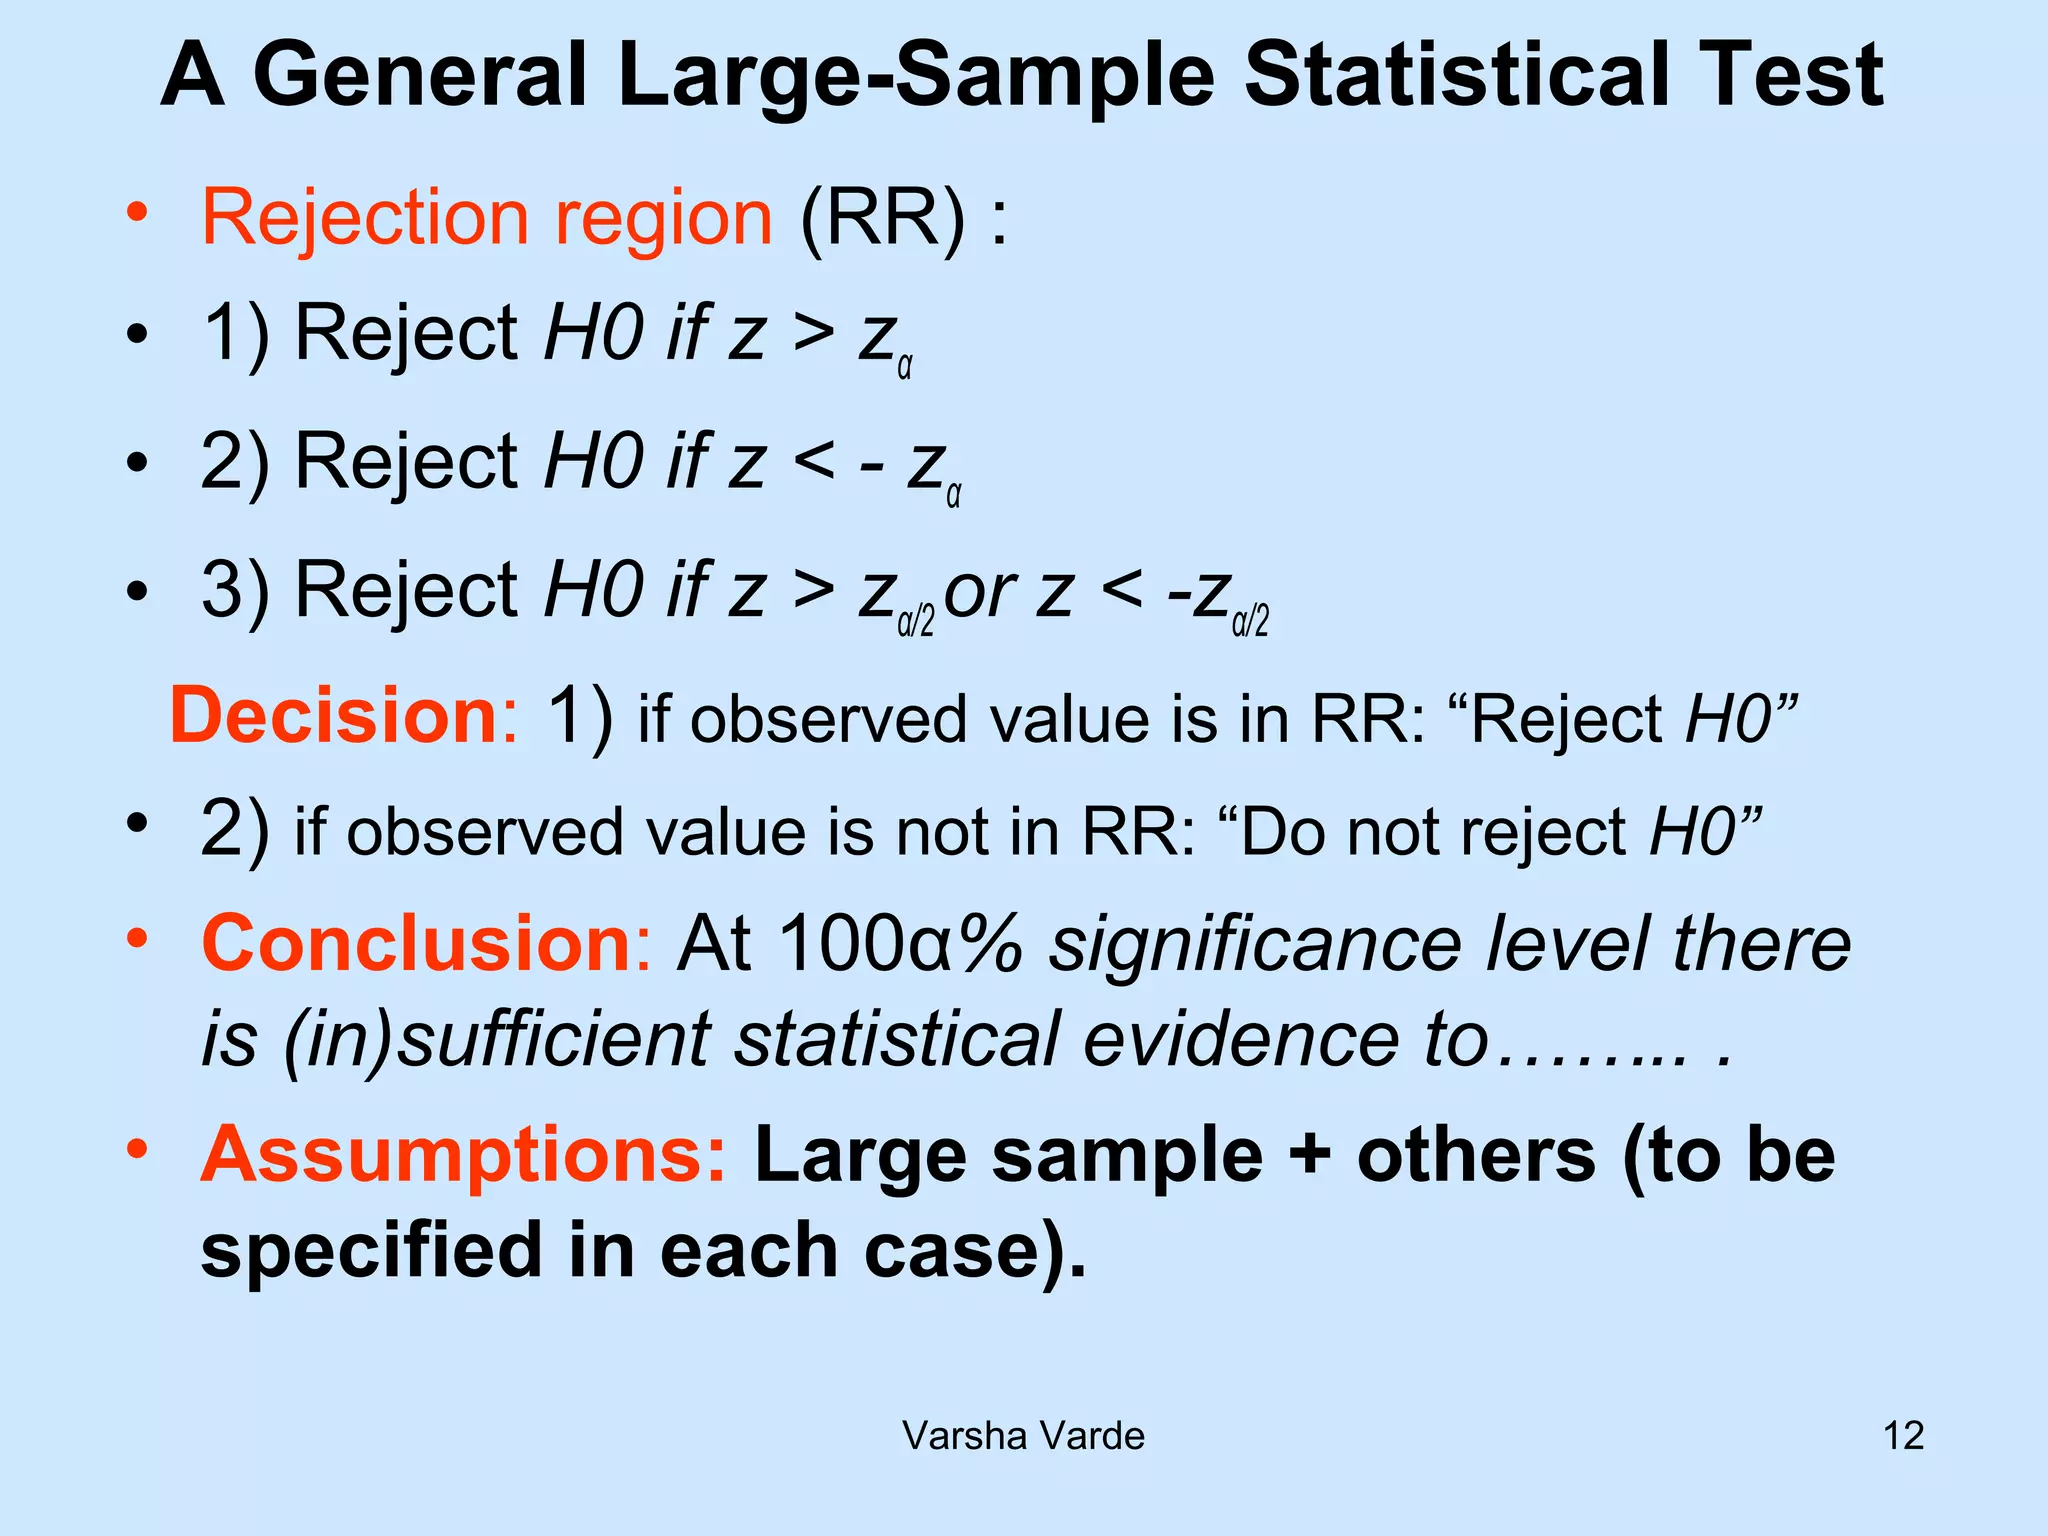
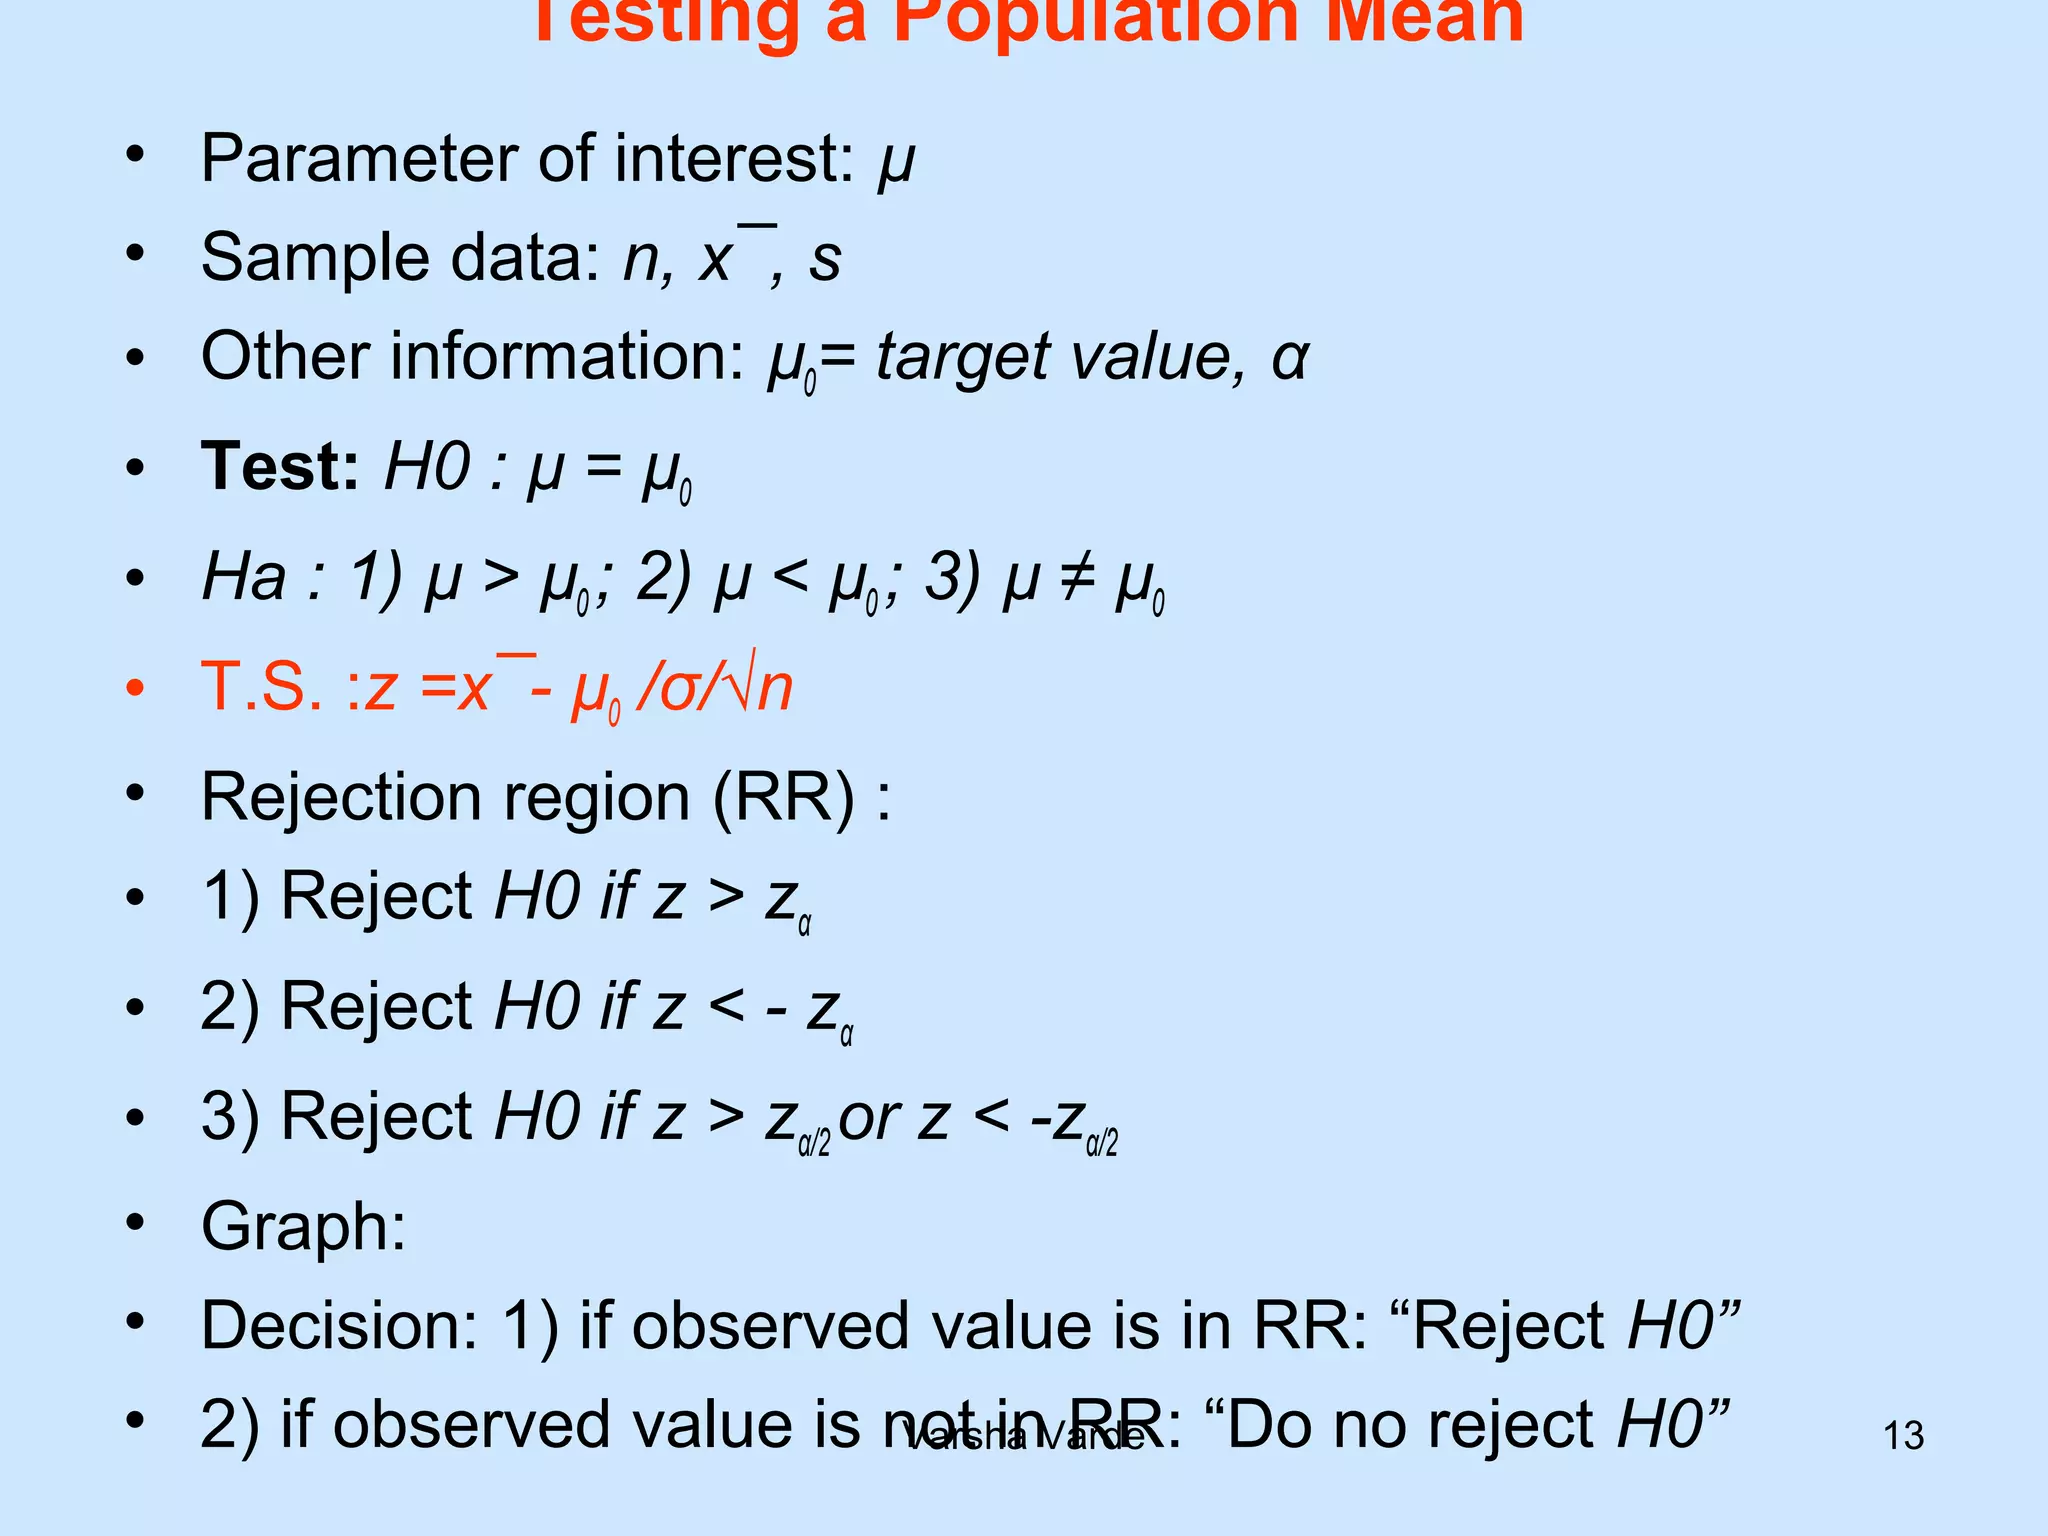
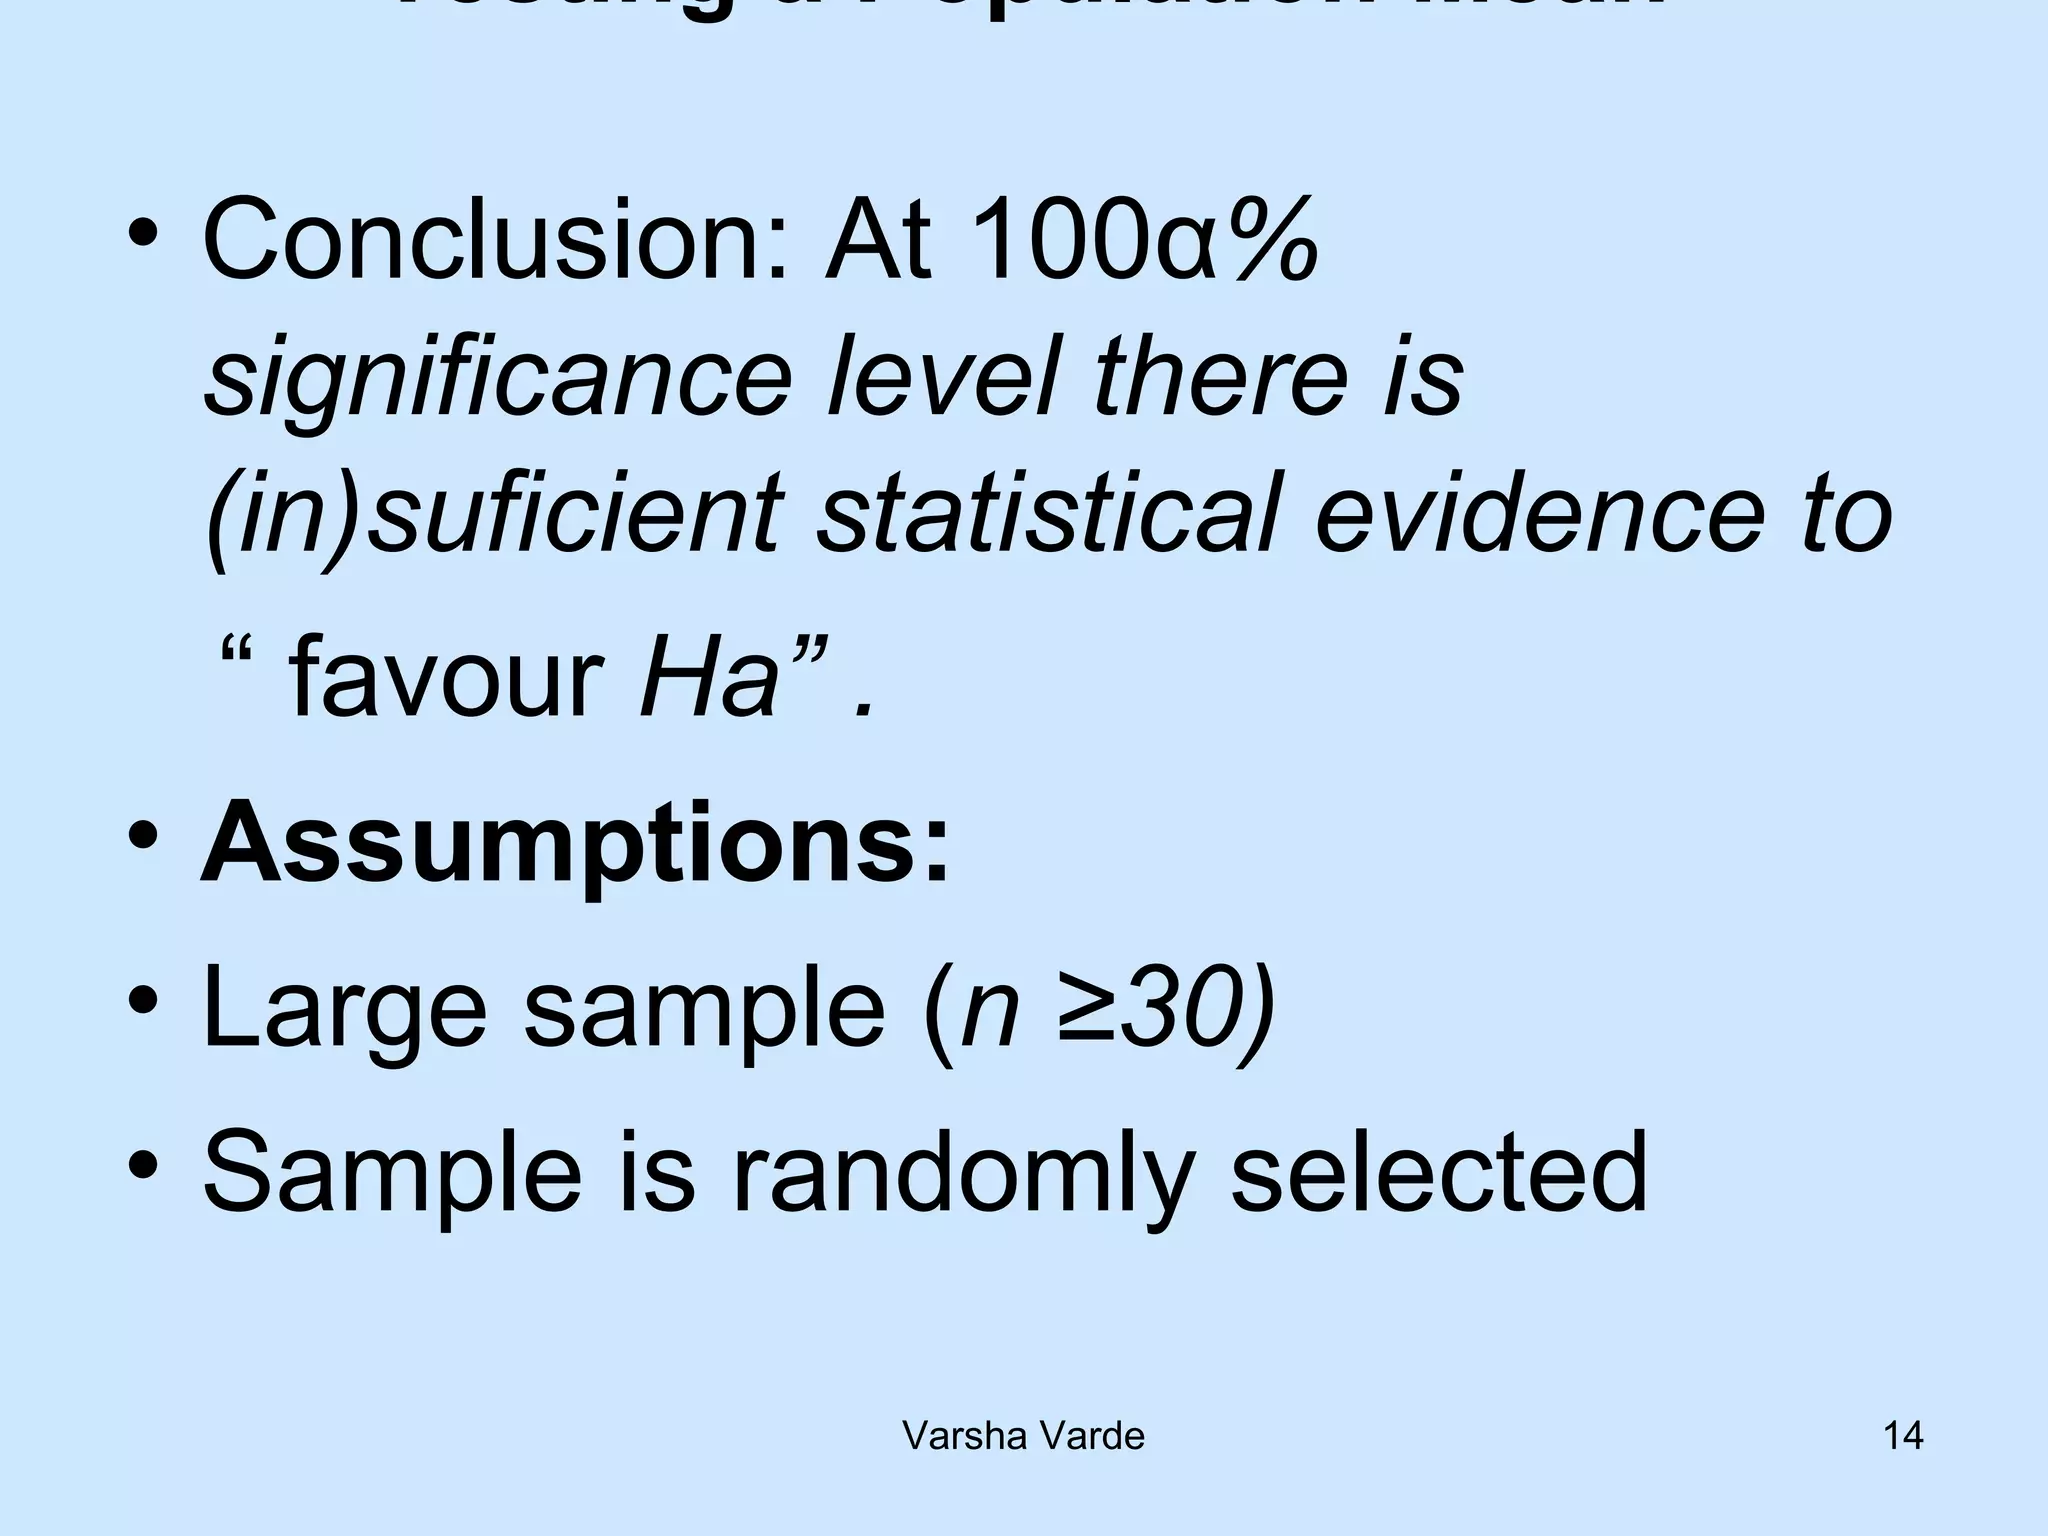
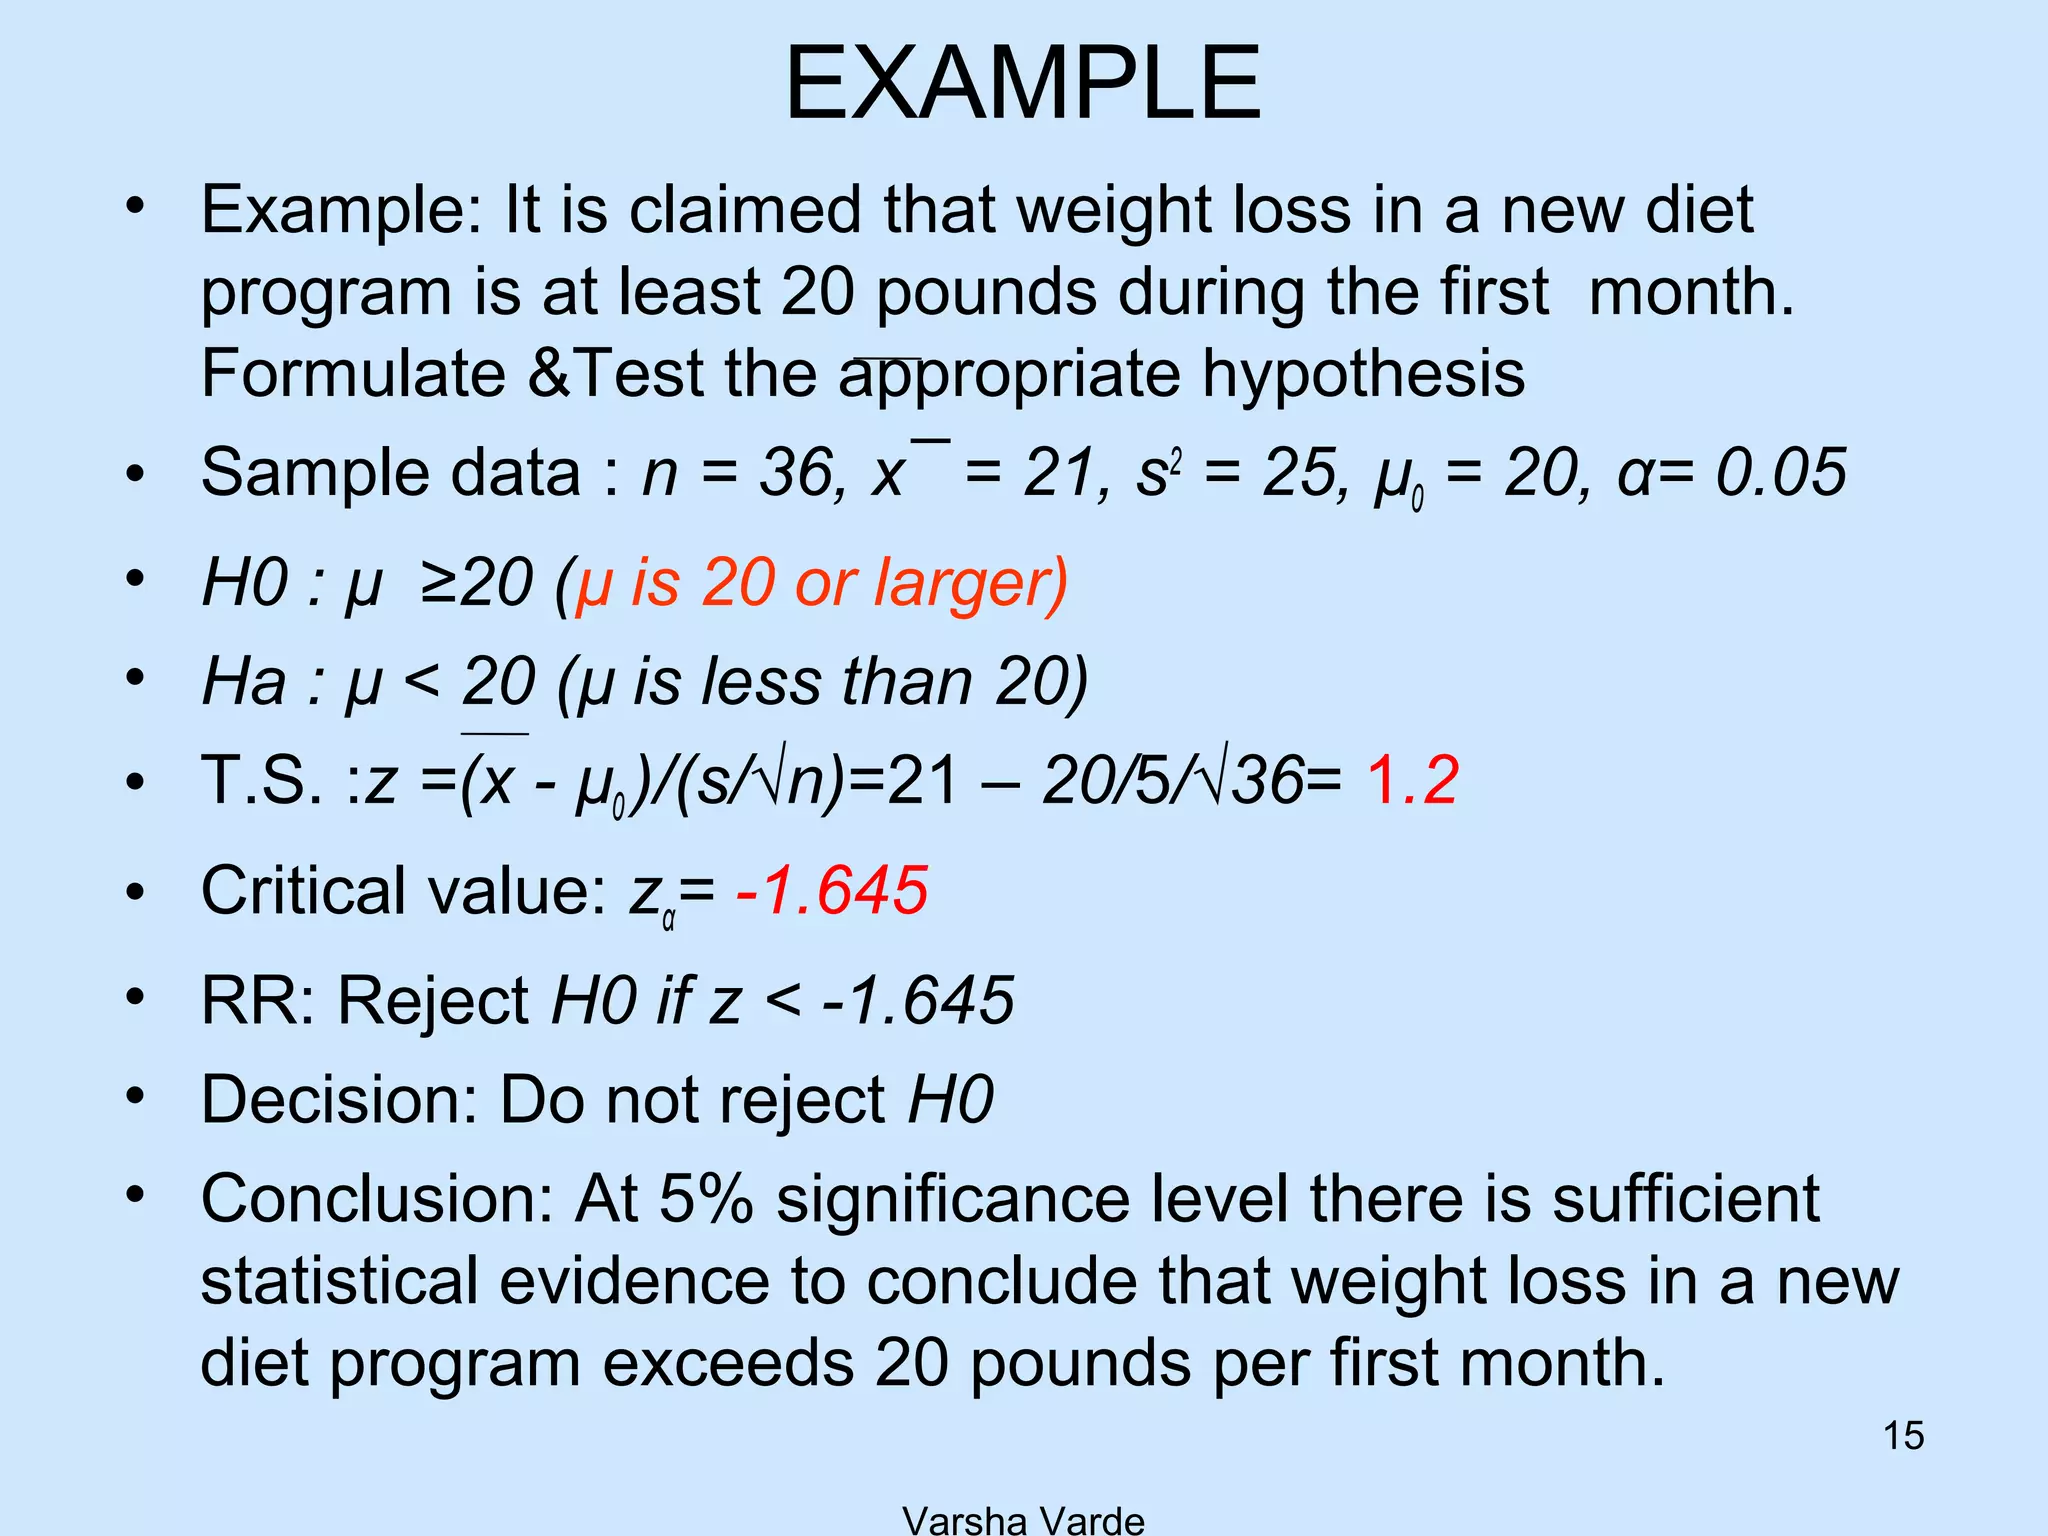
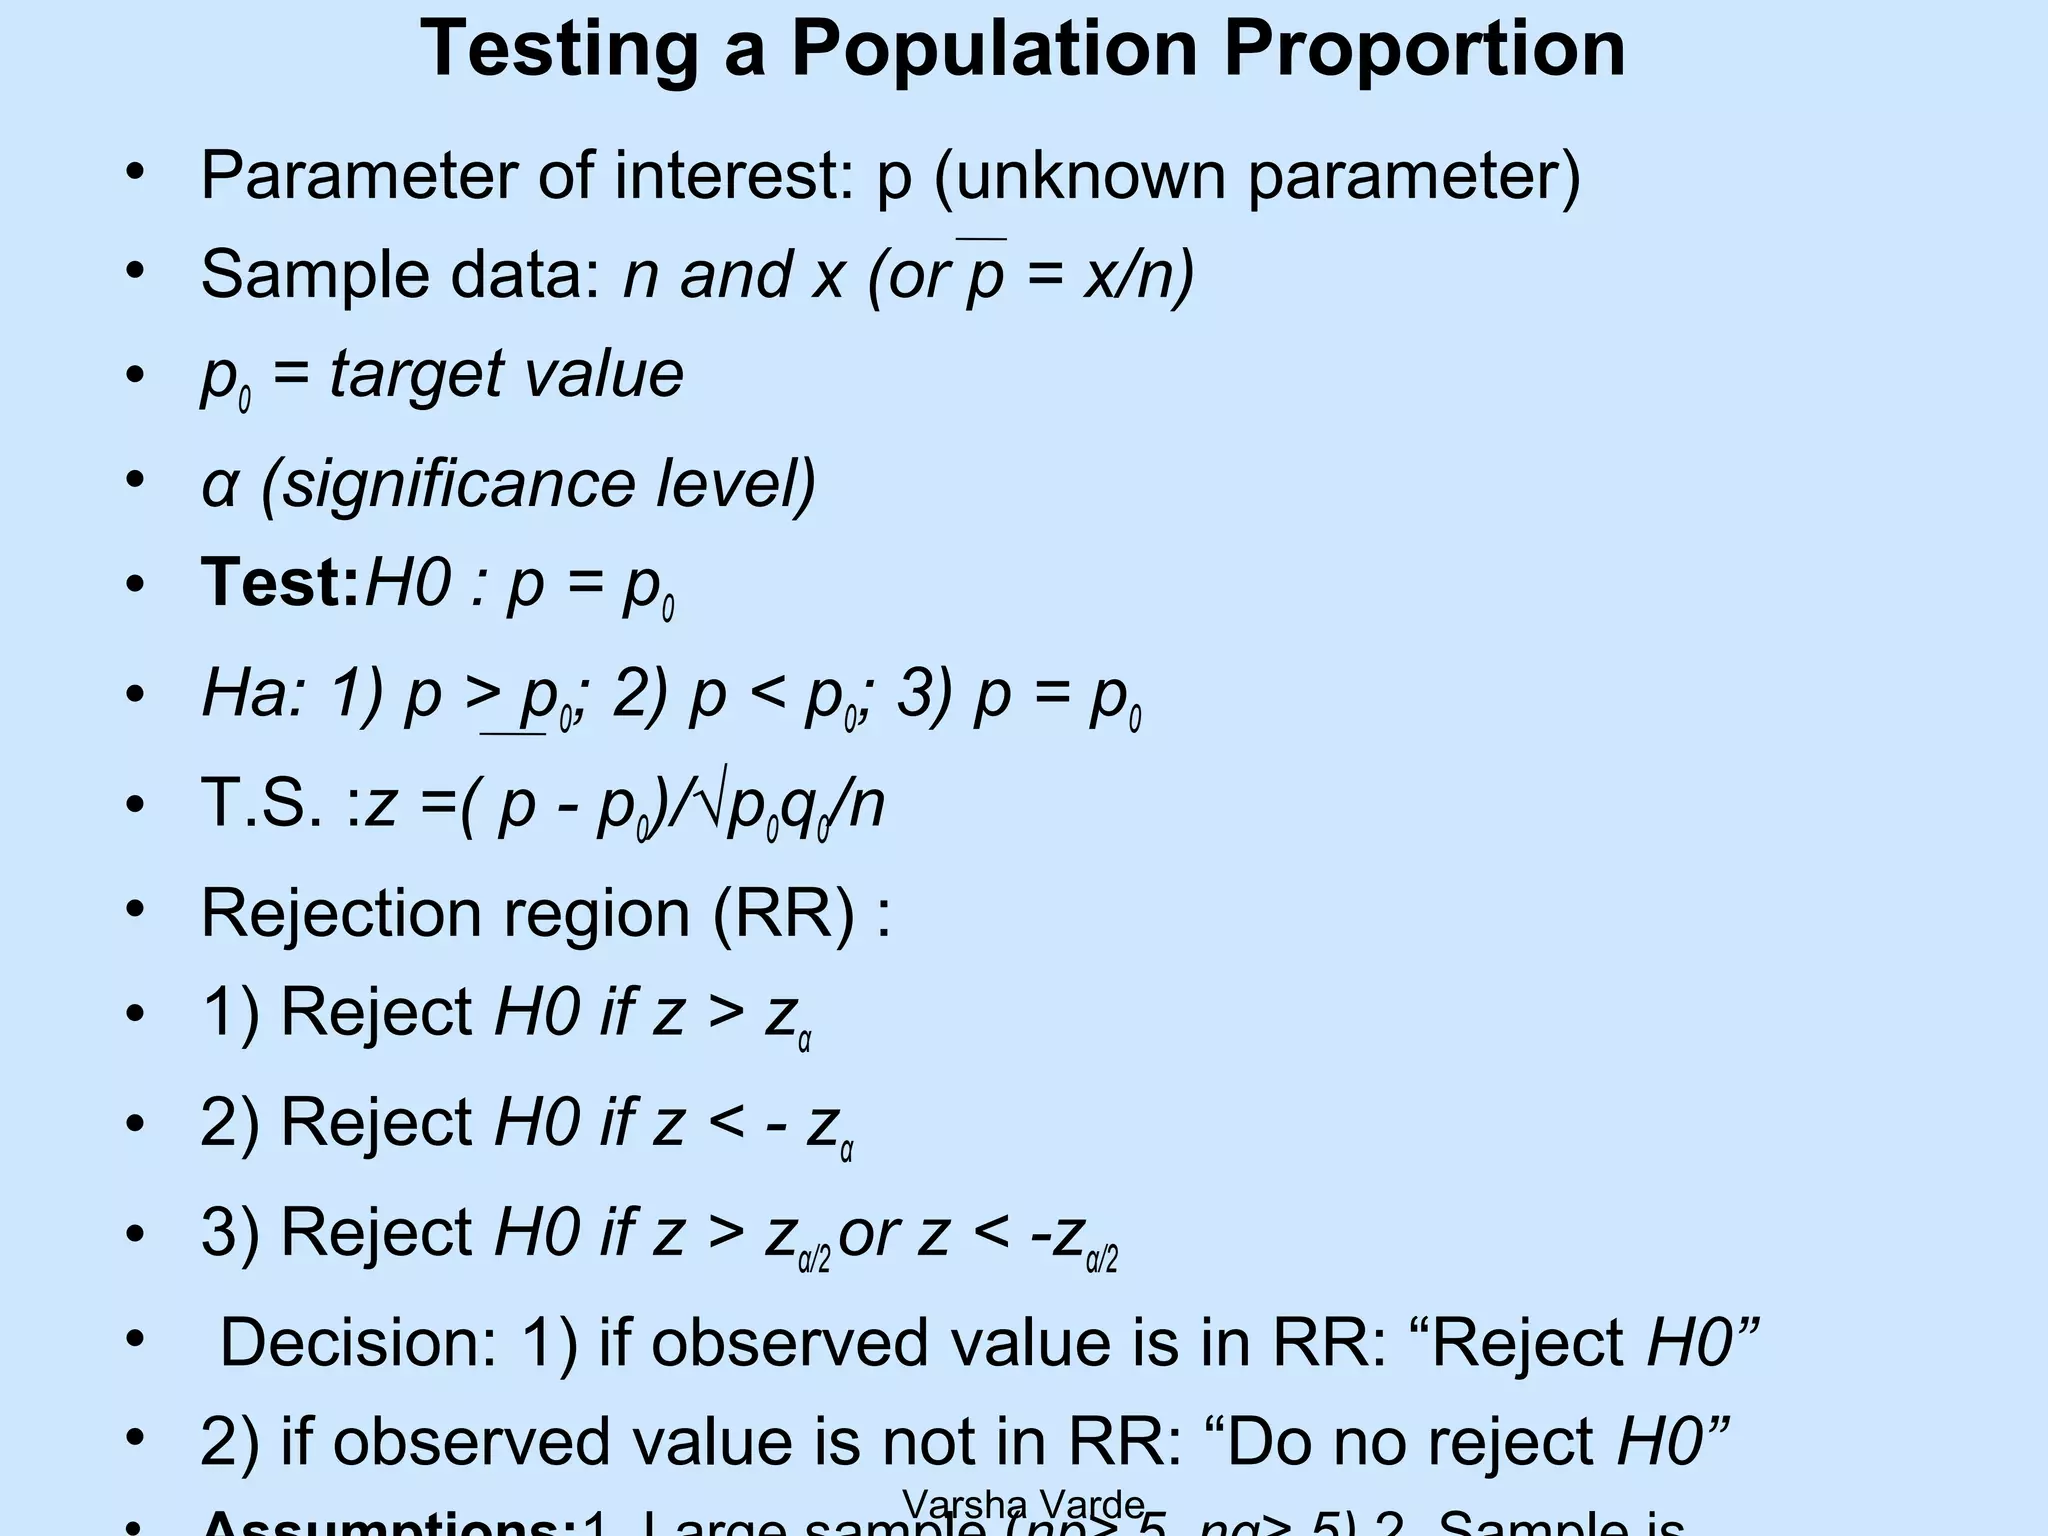
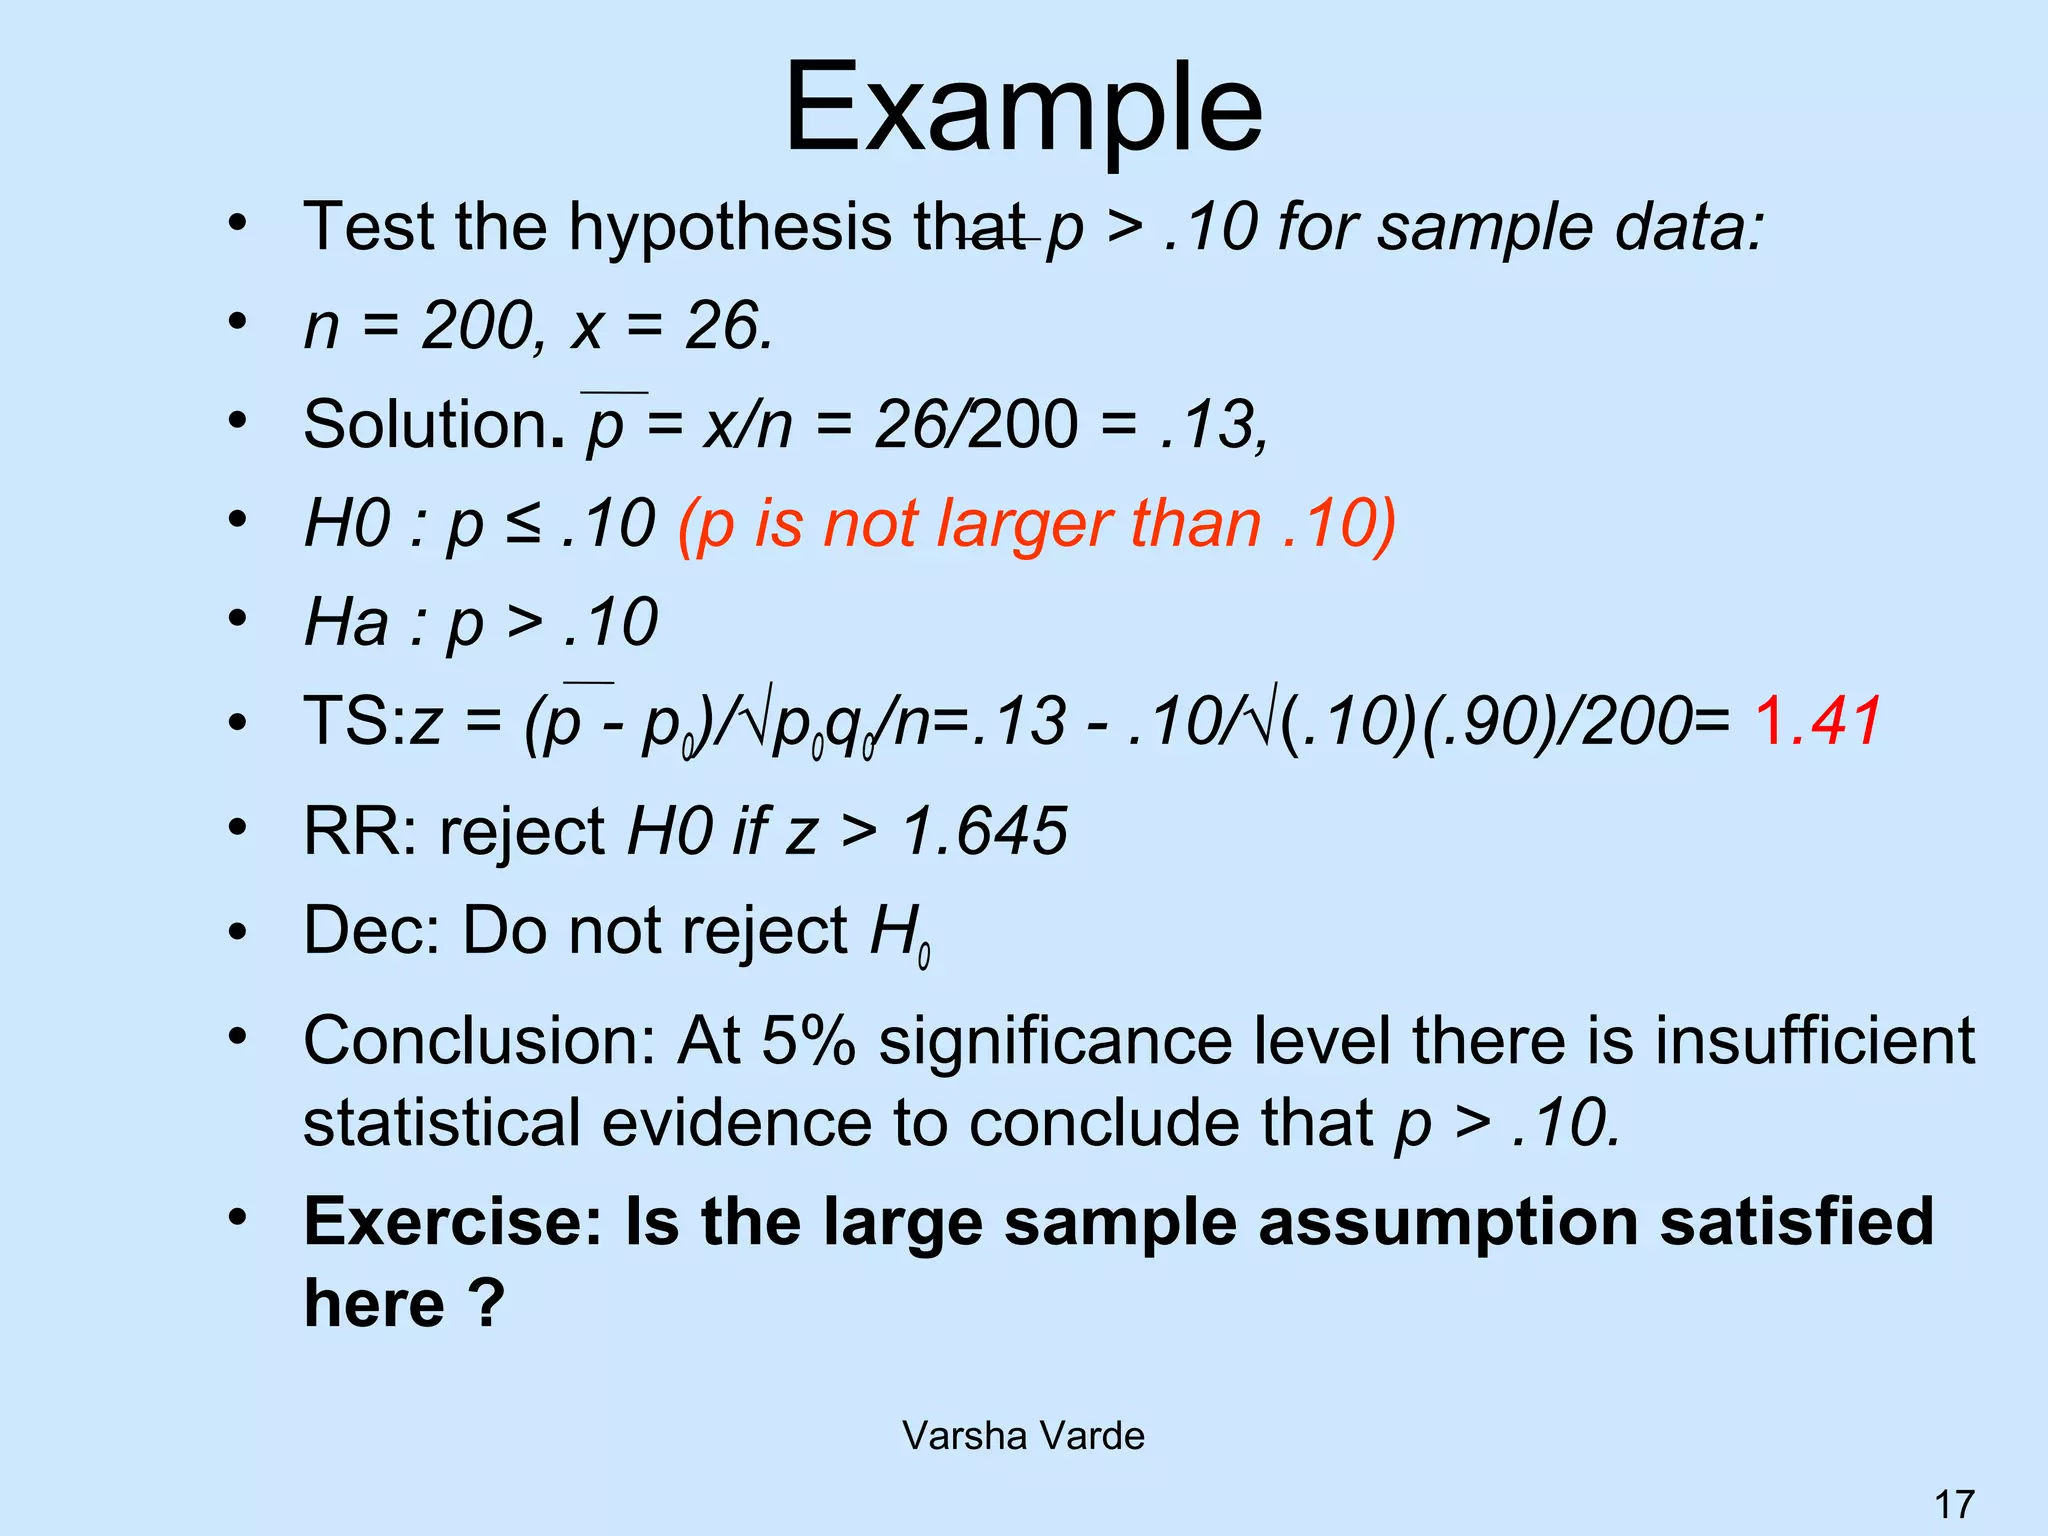
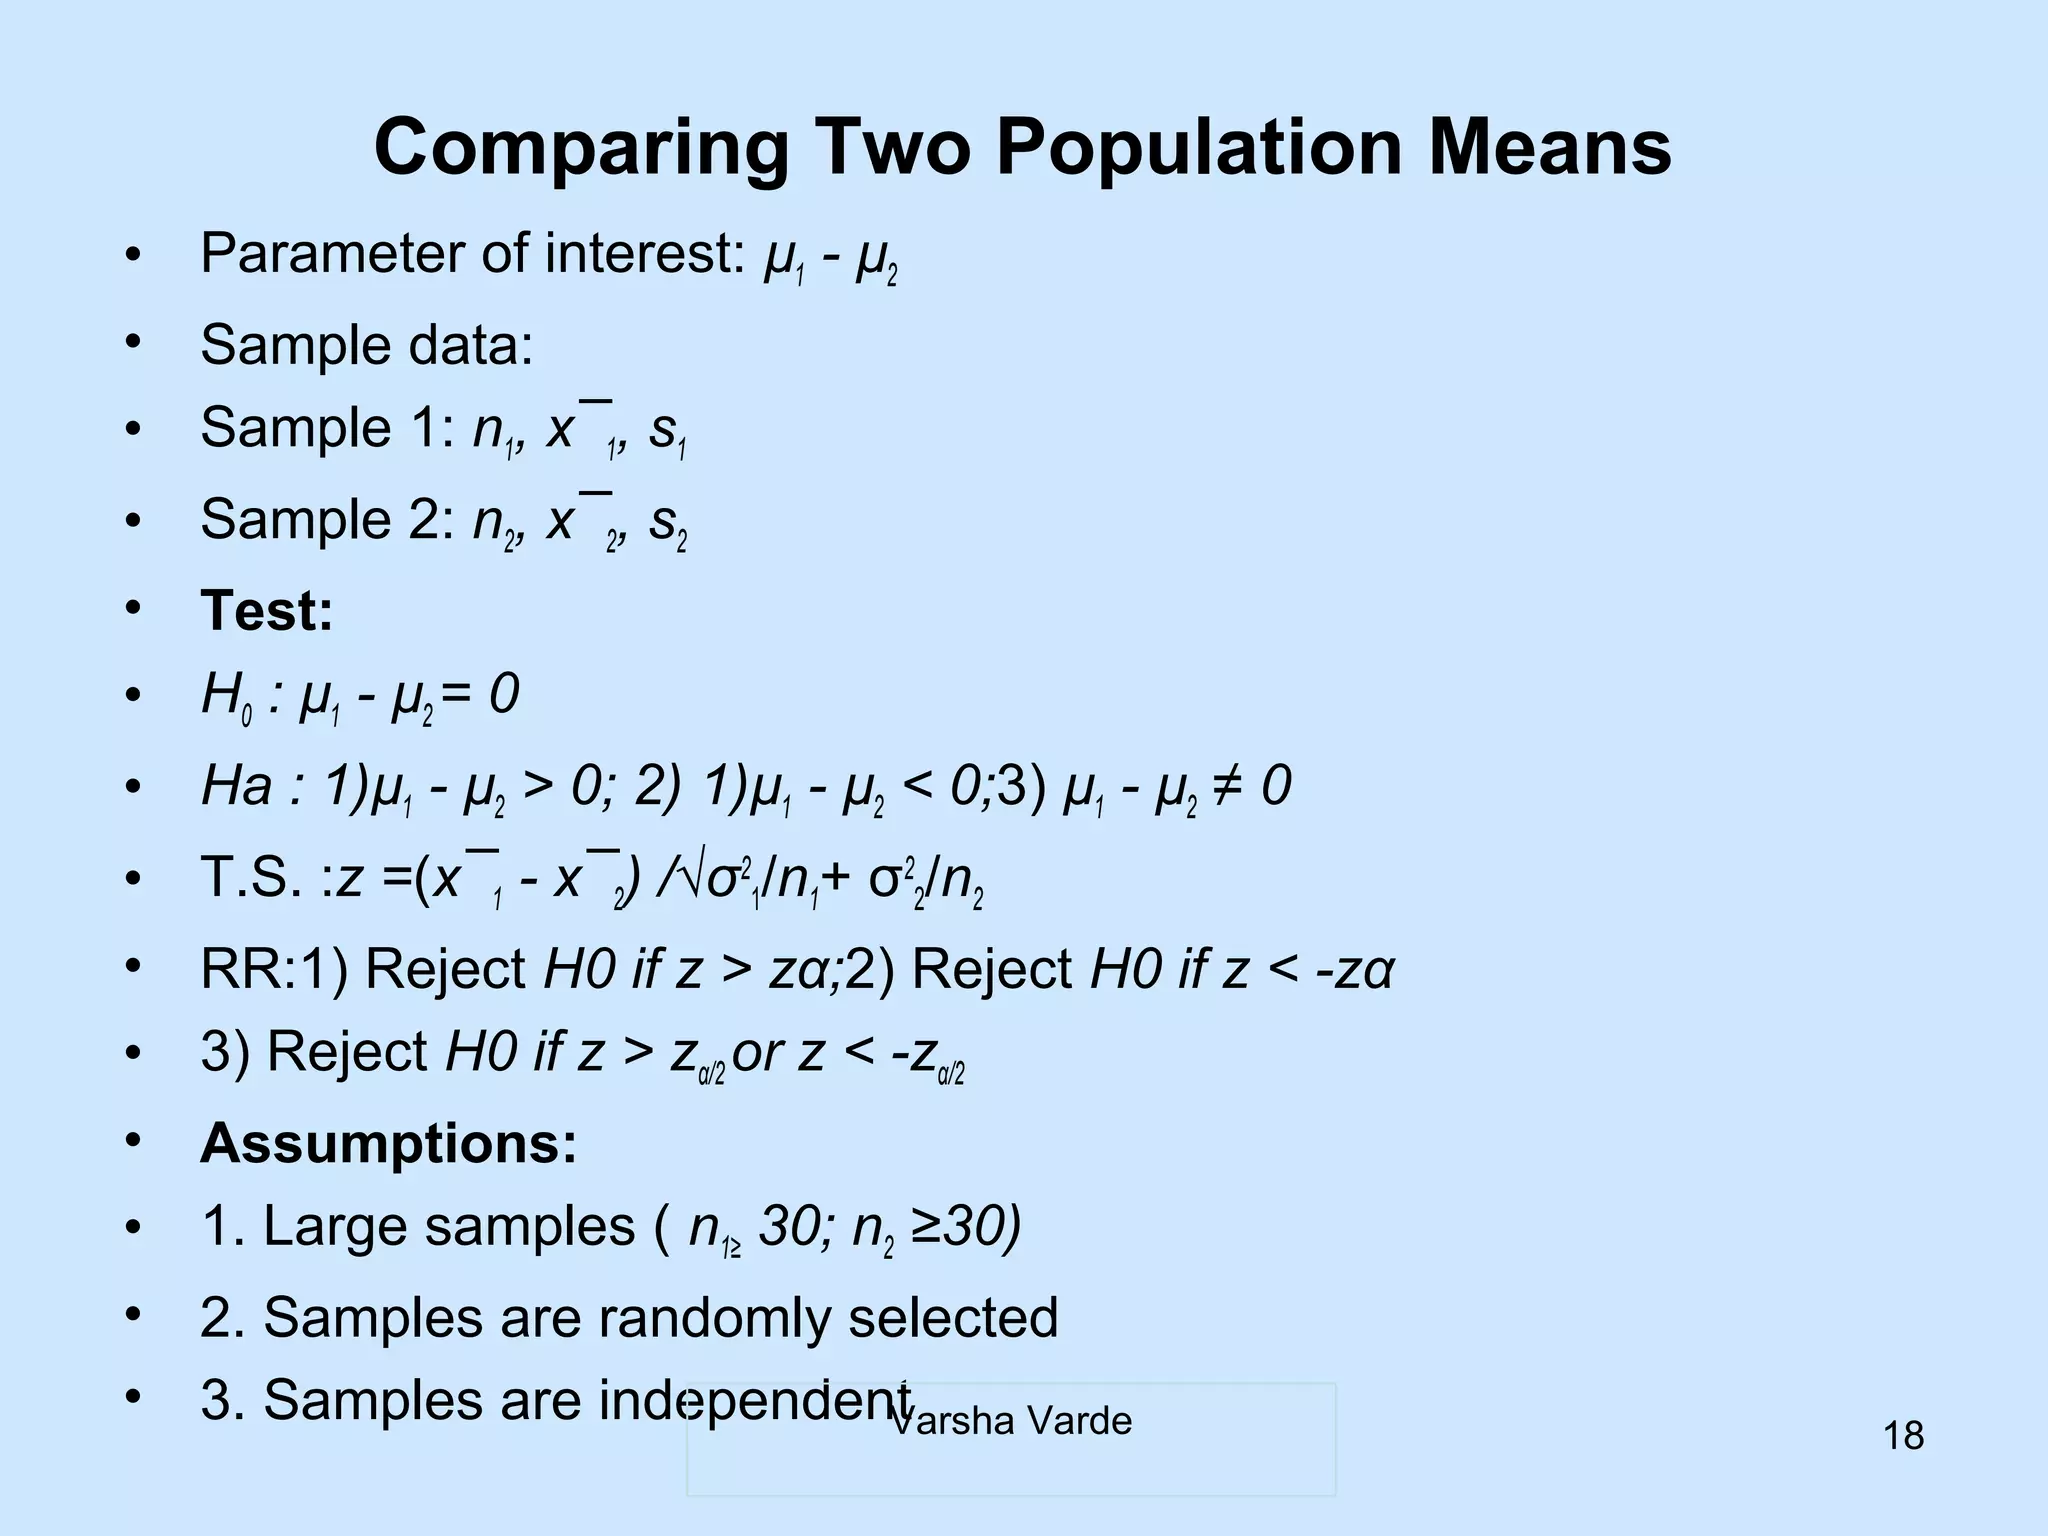
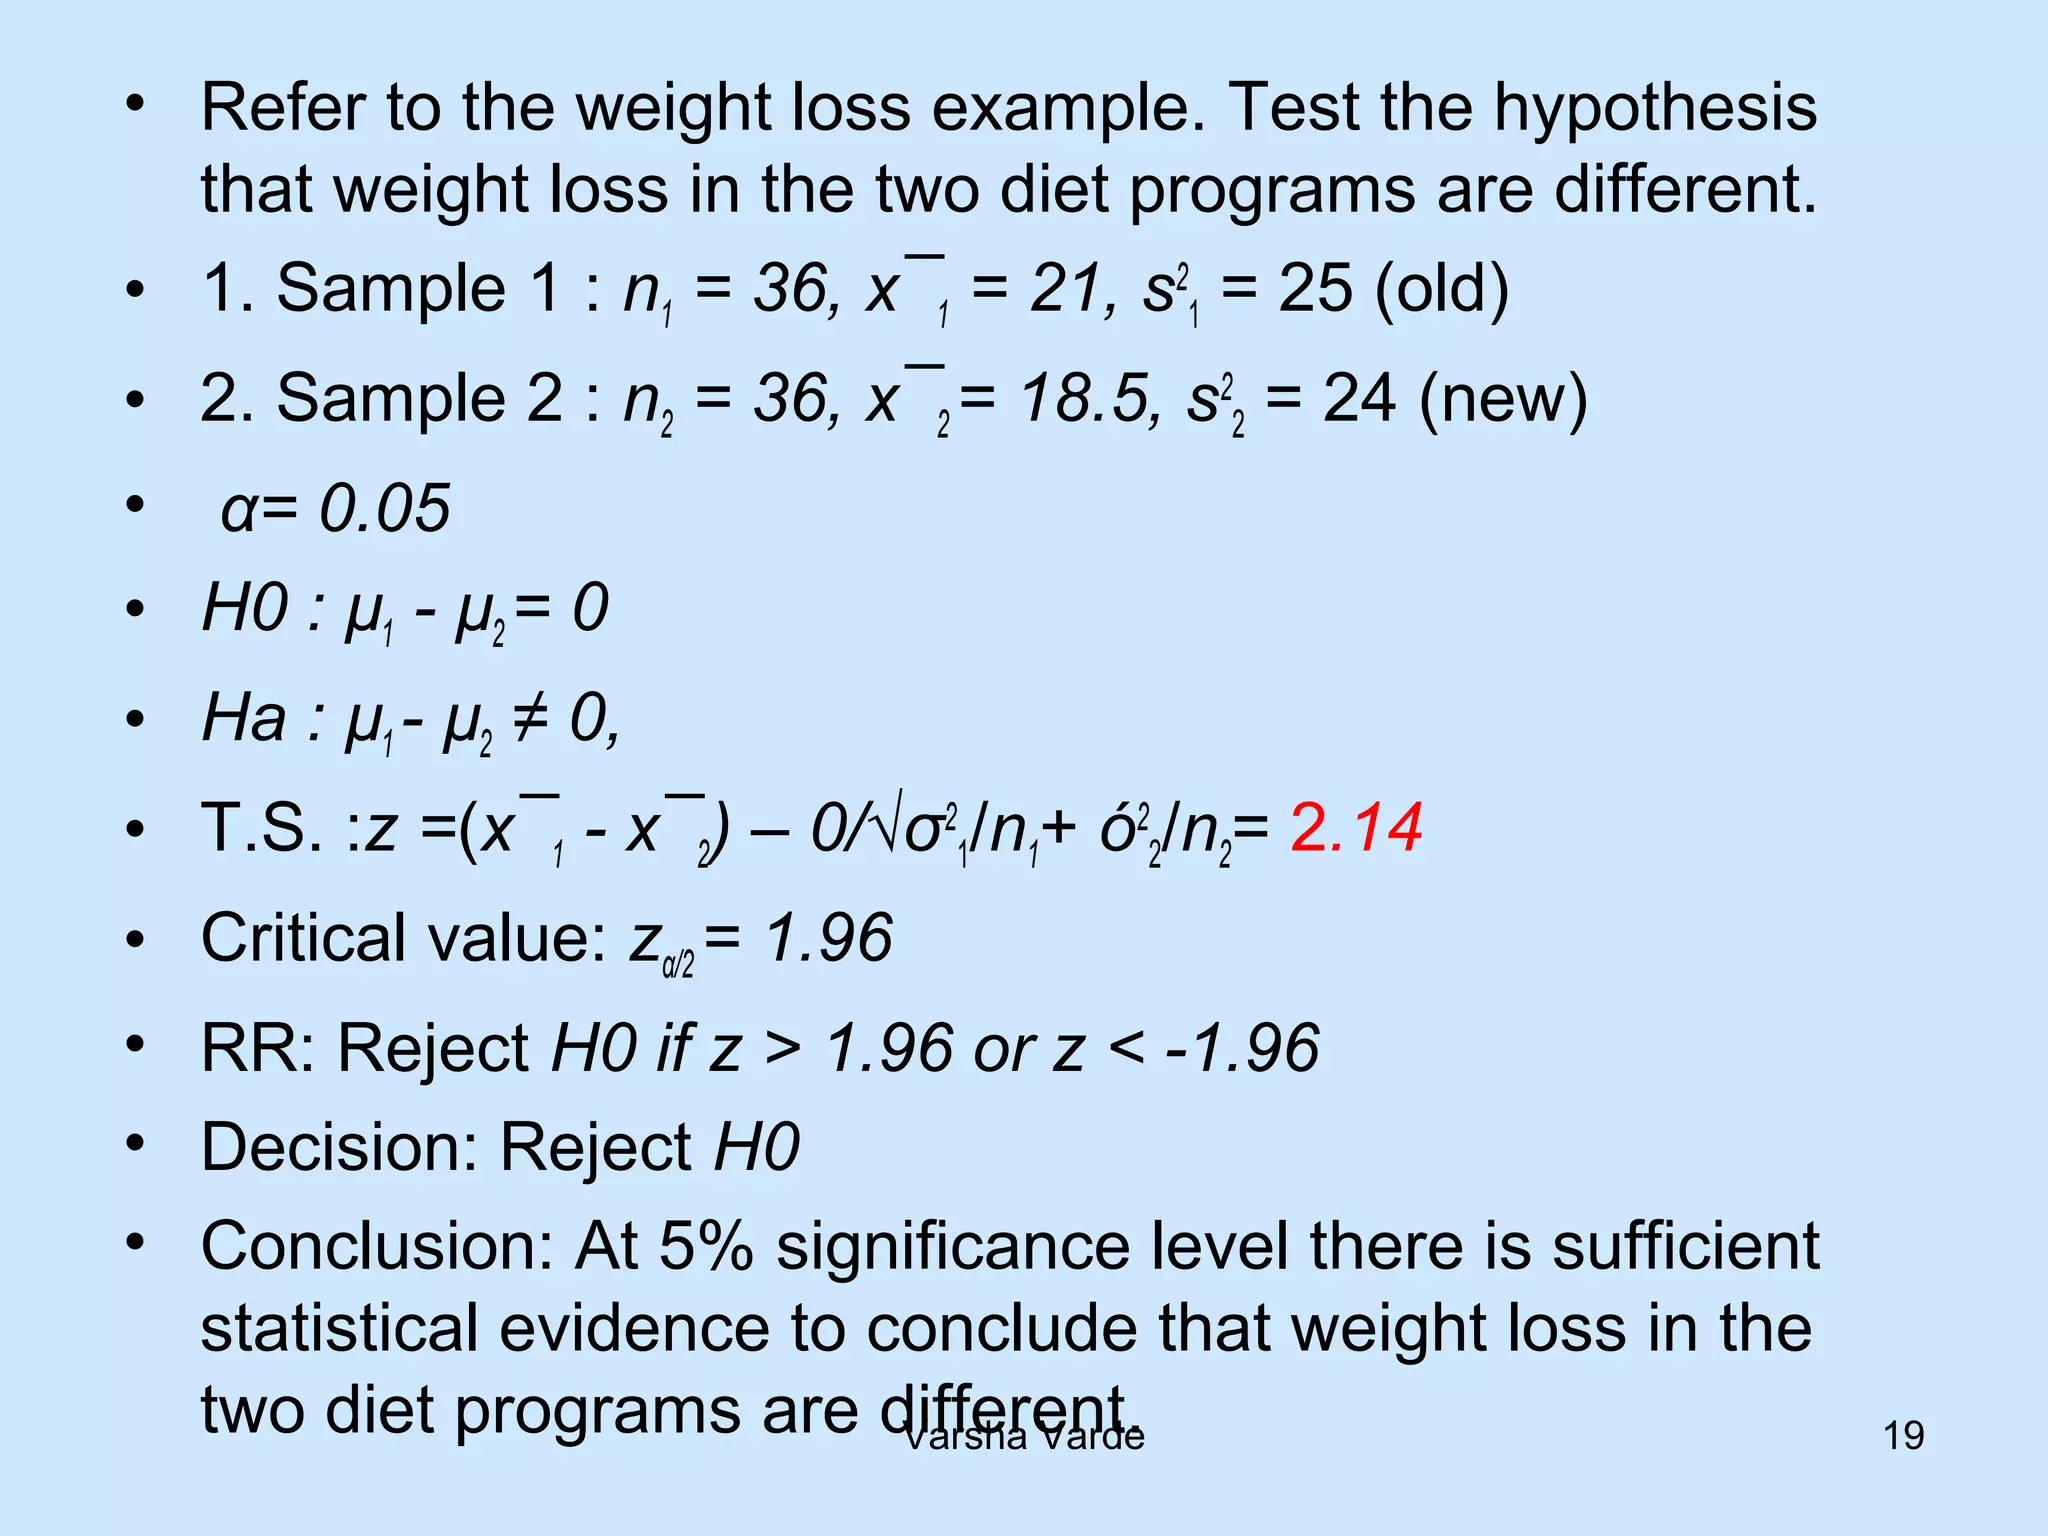
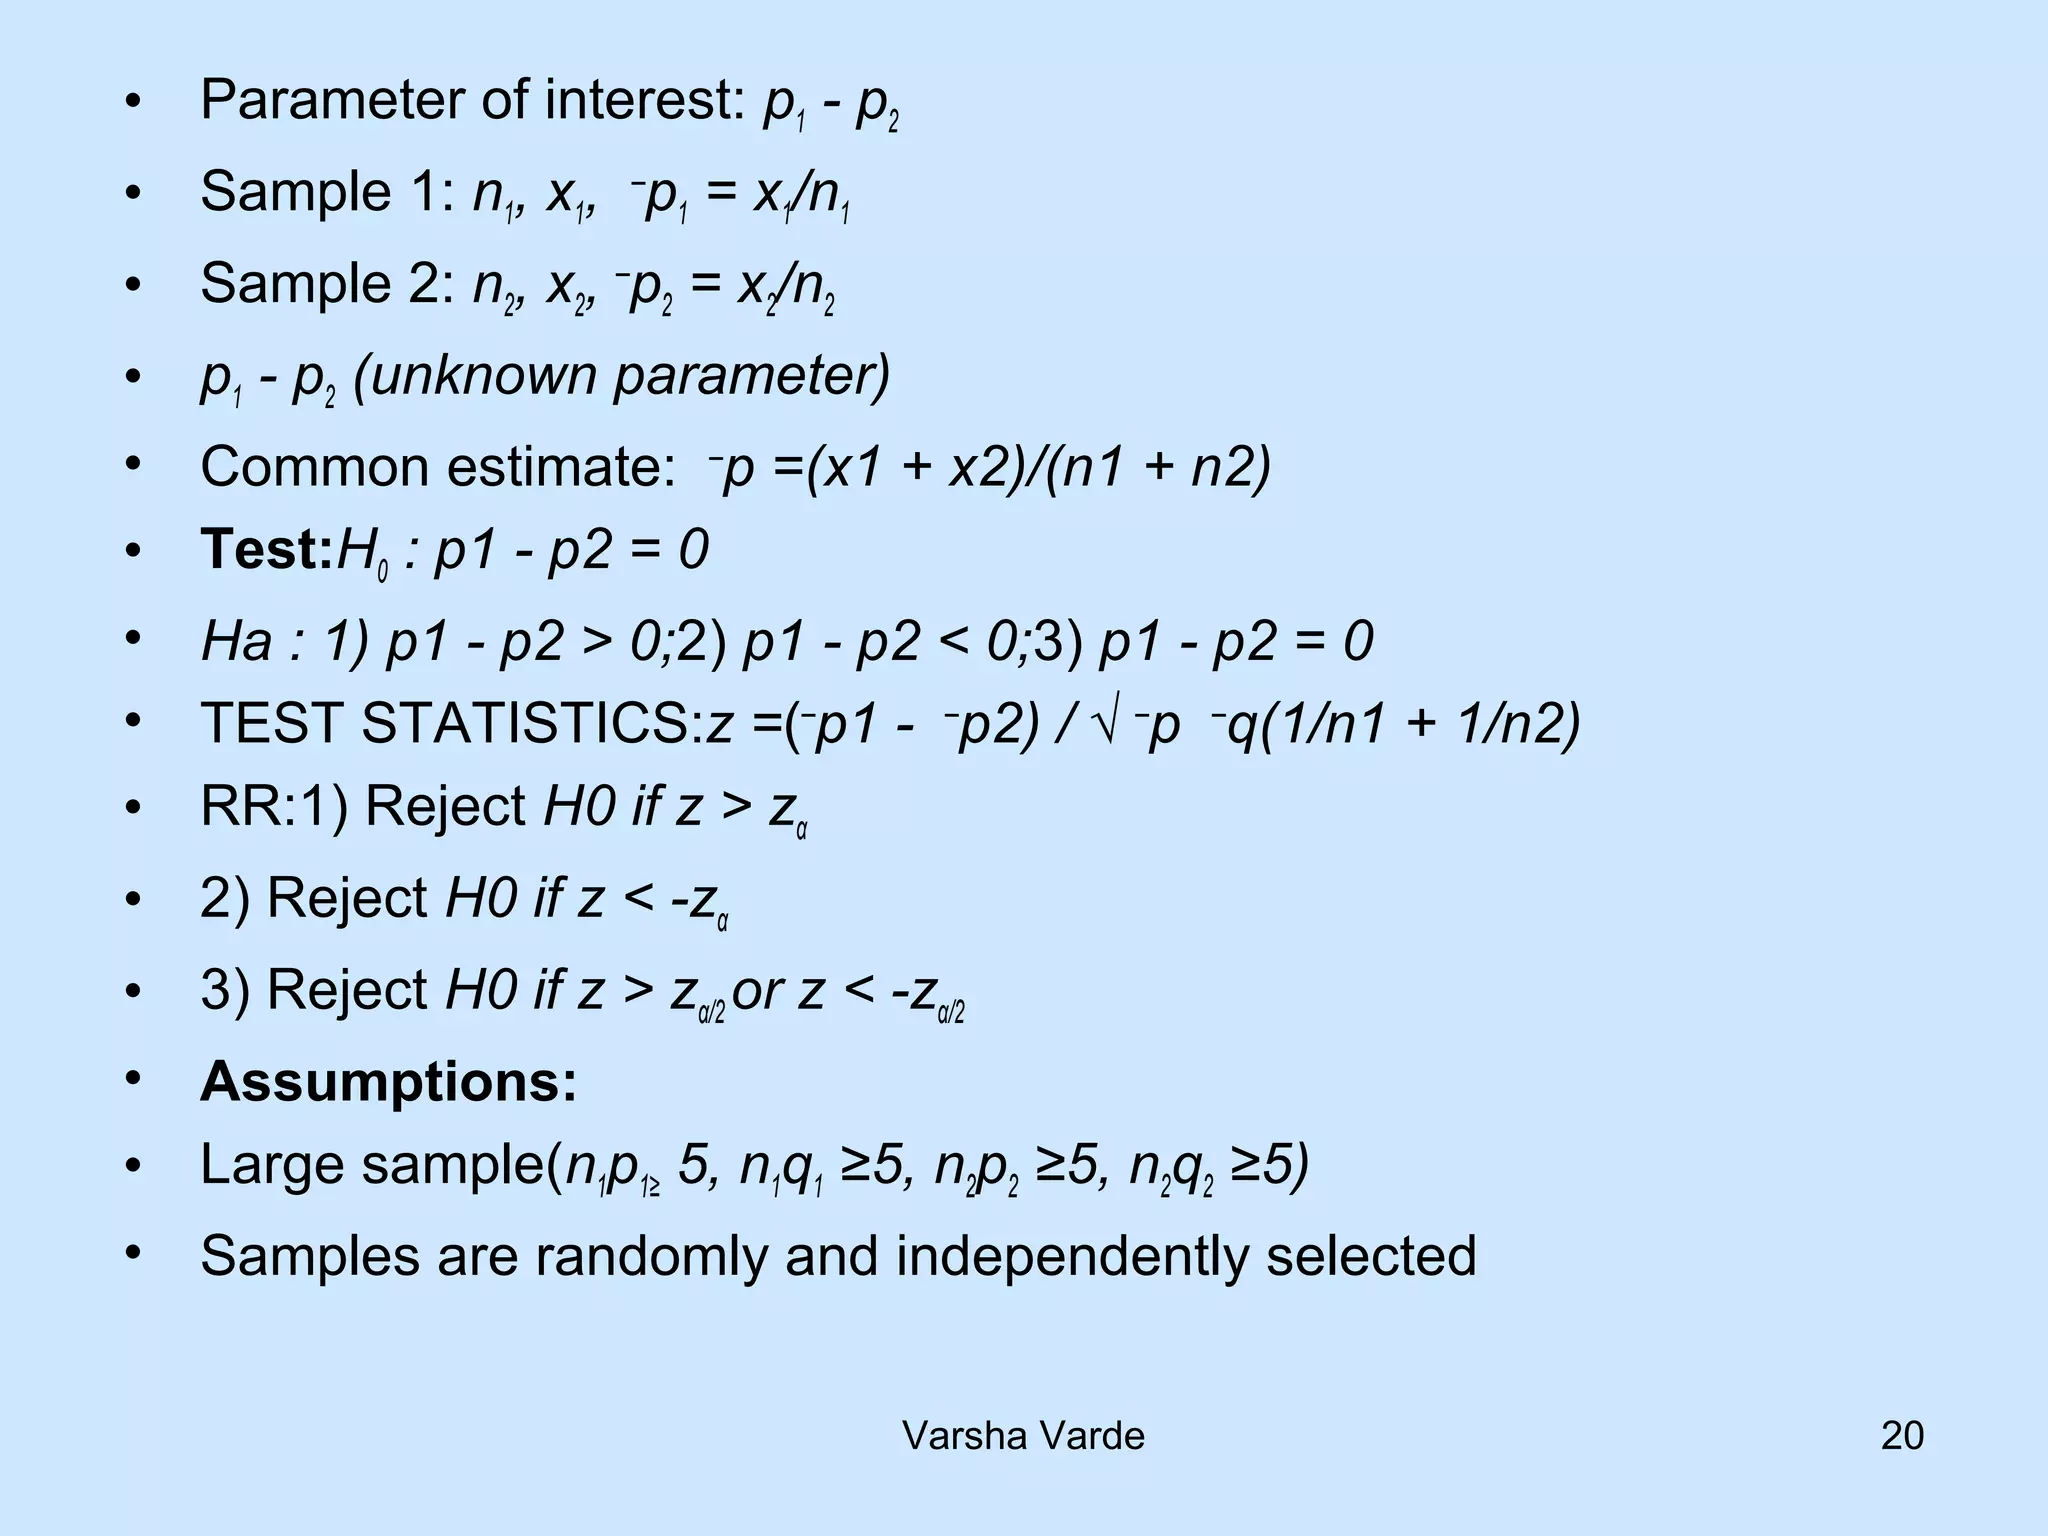
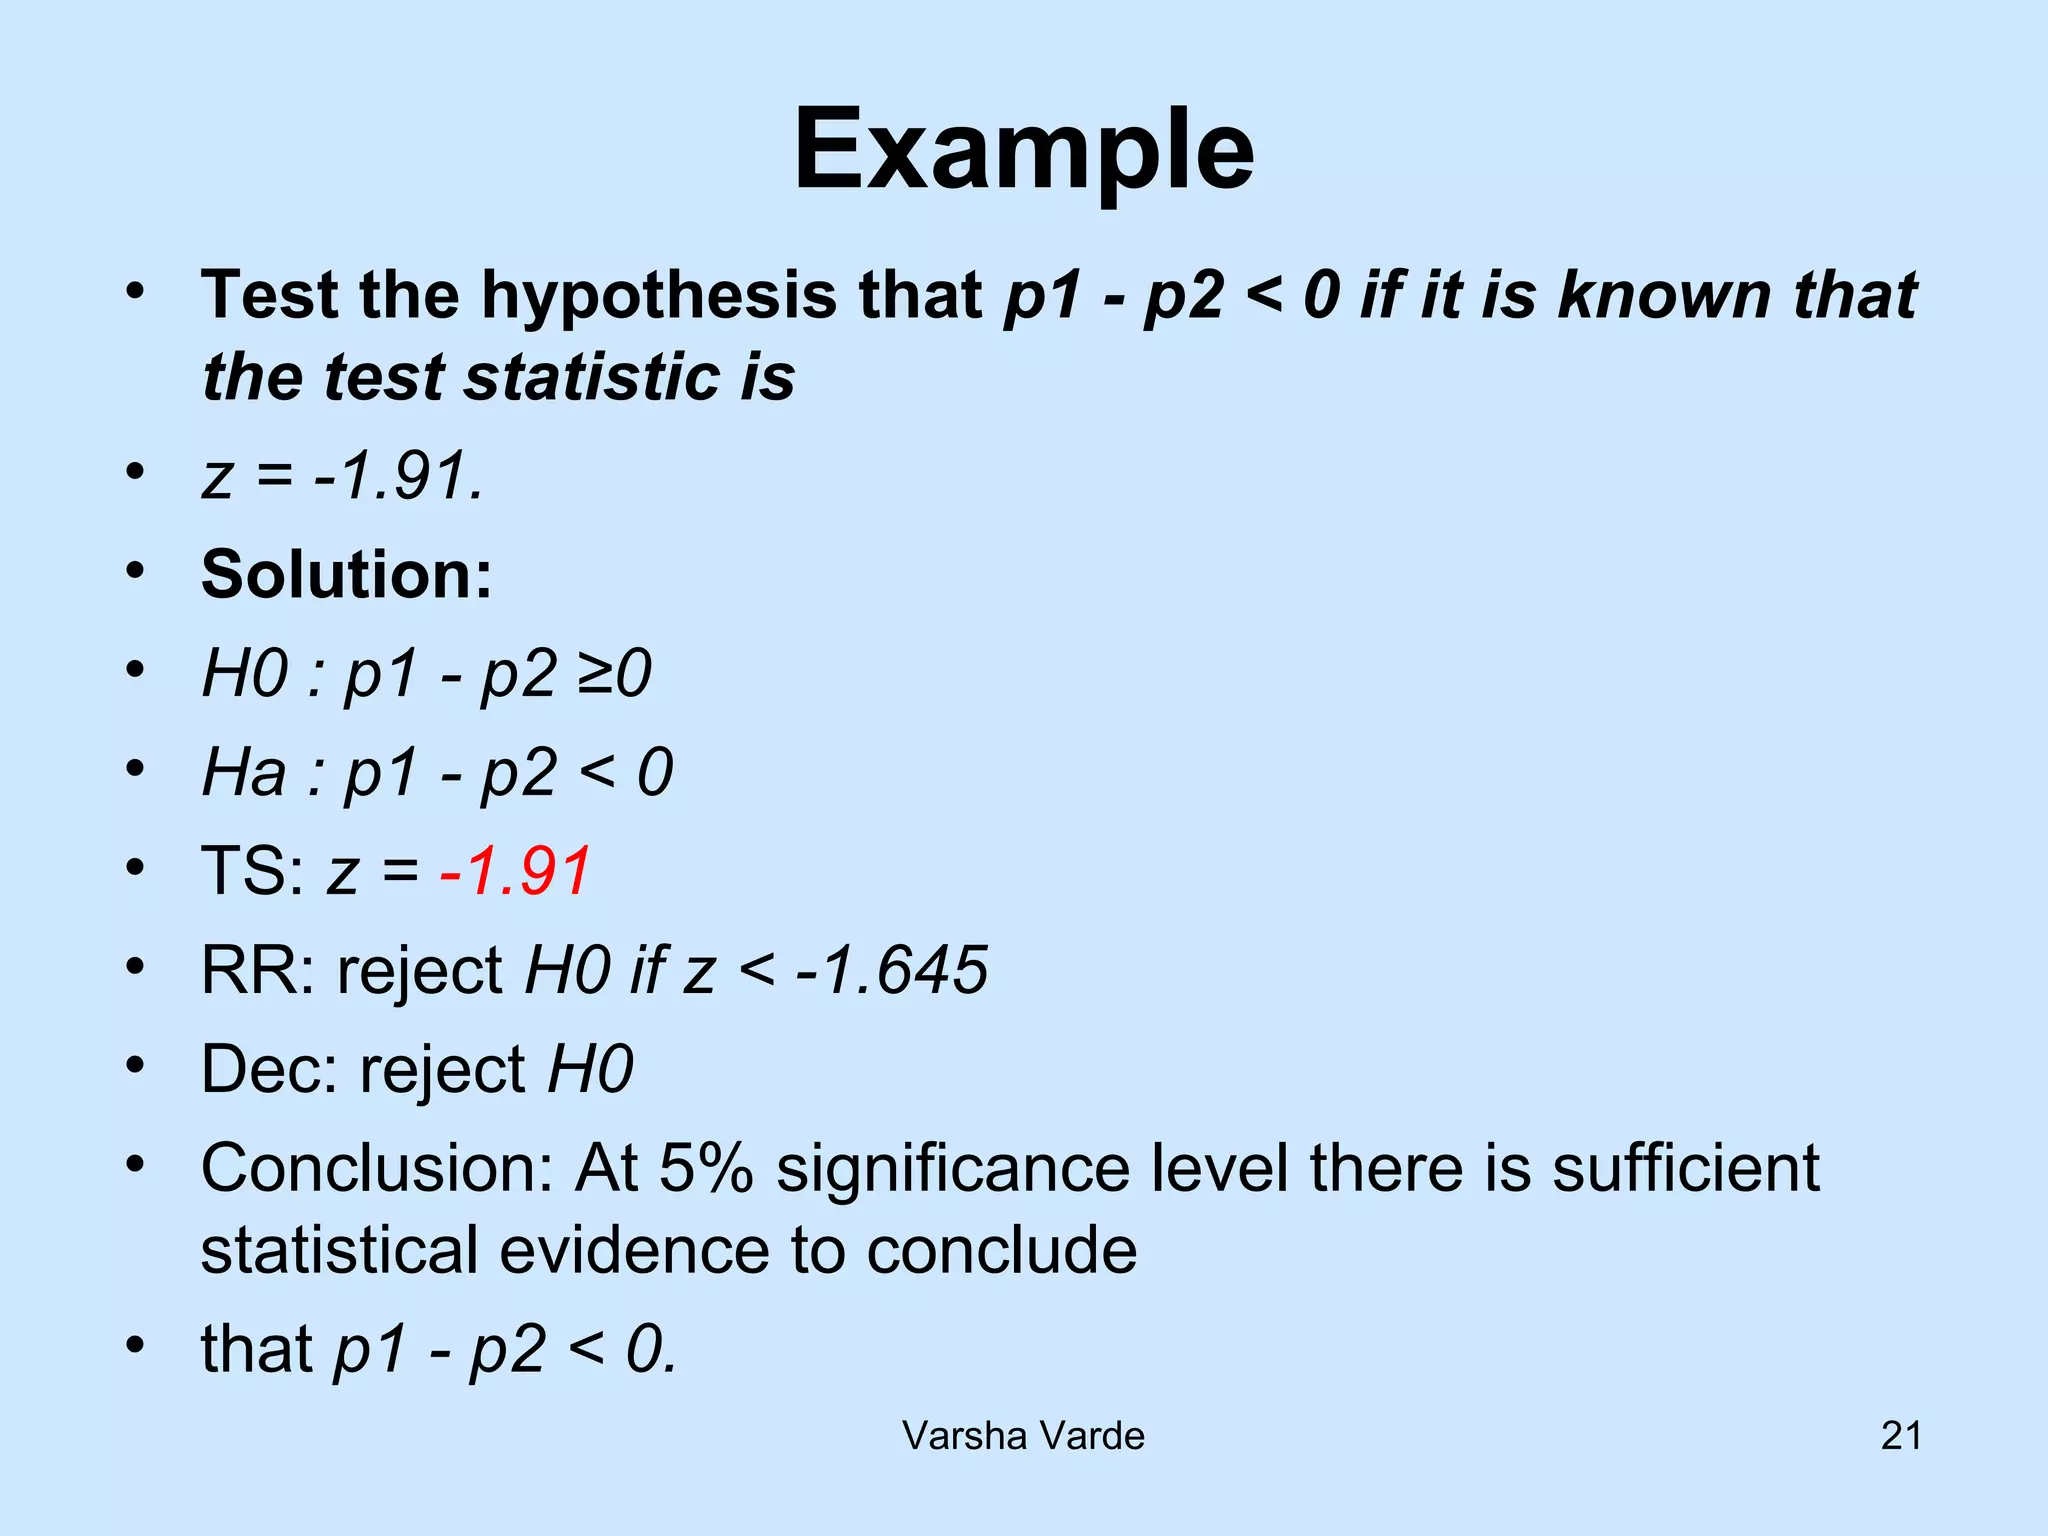
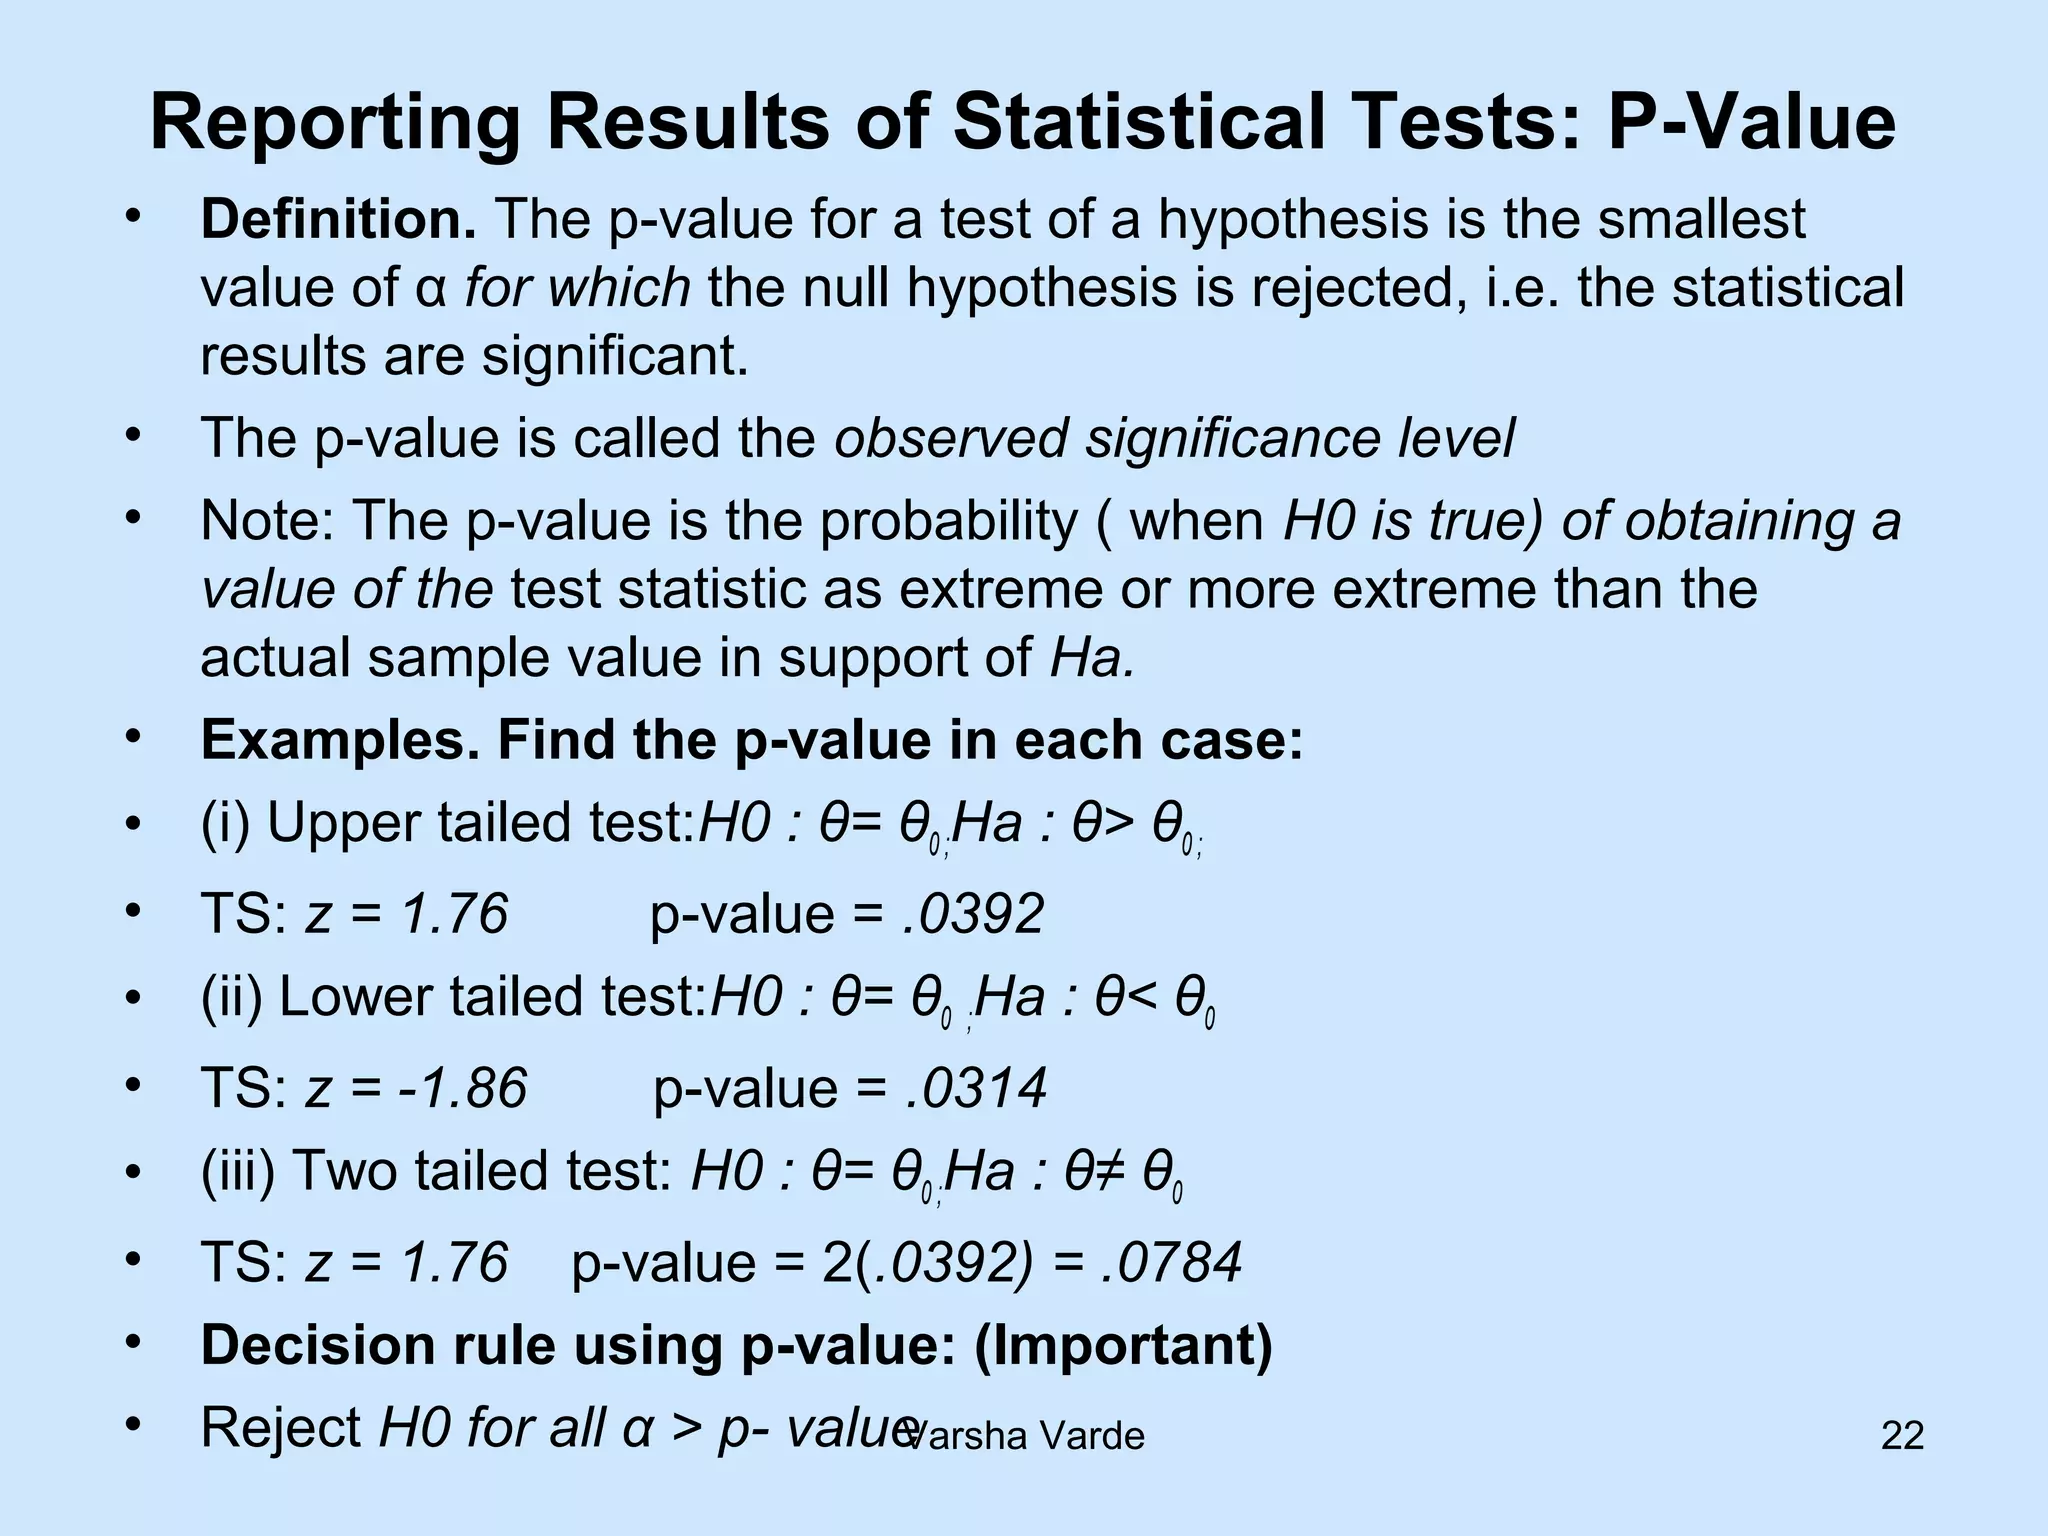


The document discusses quantitative methods and hypothesis testing. It covers key concepts like null and alternative hypotheses, types of hypothesis tests, test statistics, rejection regions, and p-values. Examples are provided to illustrate hypothesis testing for population means, proportions, differences between means and proportions. The goal is to introduce the mechanics and general procedure of hypothesis testing and how to report results through p-values.


![Dividends and _dividend_policy_powerpoint_presentation[1]](https://cdn.slidesharecdn.com/ss_thumbnails/dividendsanddividendpolicypowerpointpresentation1-130929215028-phpapp02-thumbnail.jpg?width=640&height=640&fit=bounds)


