Downloaded 473 times

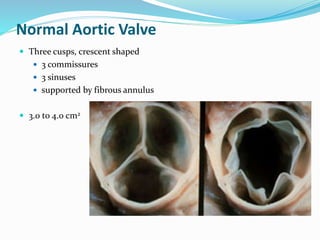
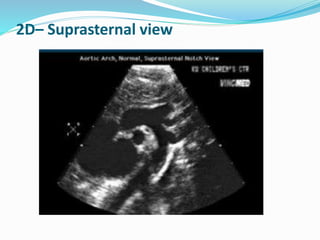


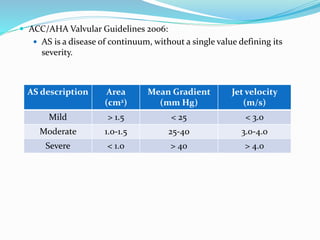
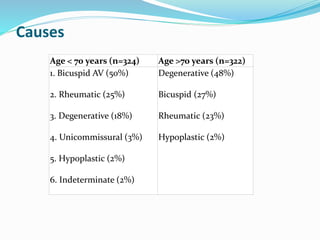
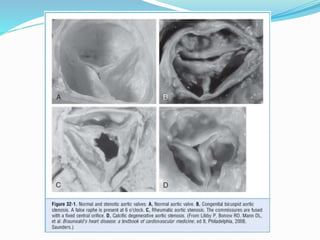

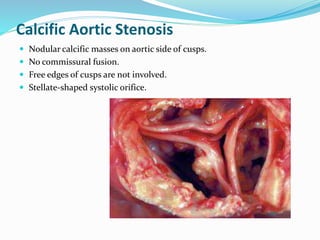
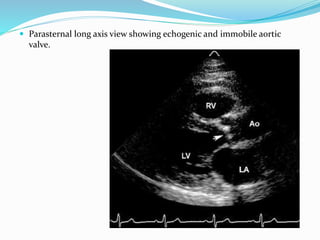
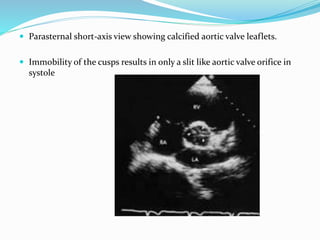
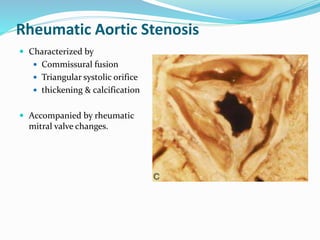
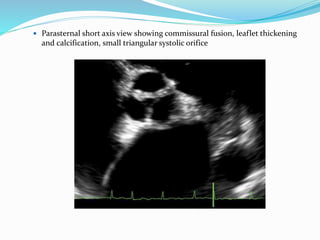
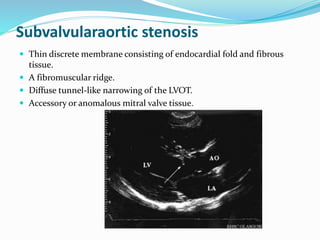
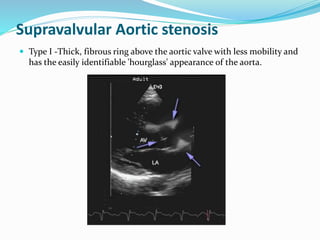
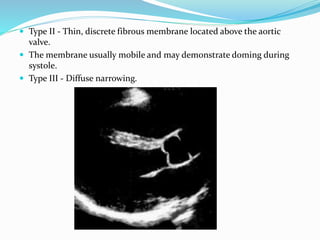


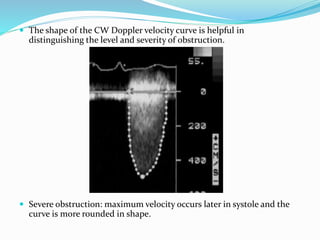


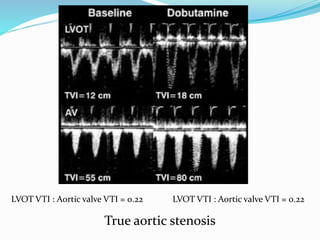

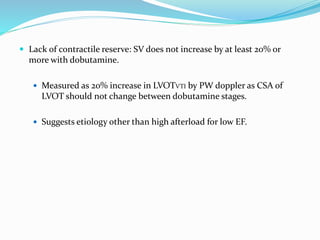
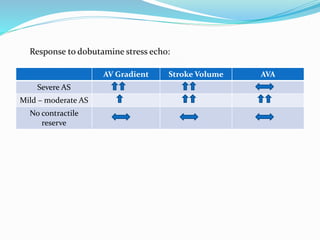
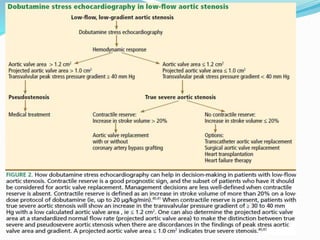


This document summarizes the evaluation of aortic valve stenosis using echocardiography. It describes the normal aortic valve anatomy and various types of aortic valve stenosis including calcific, bicuspid, rheumatic, and supravalvular or subvalvular stenosis. Doppler echocardiography is used to evaluate aortic valve stenosis severity based on valve area, mean gradient, and peak jet velocity. Stress echocardiography with dobutamine can help distinguish true severe from pseudo-severe low-flow, low-gradient aortic stenosis.


