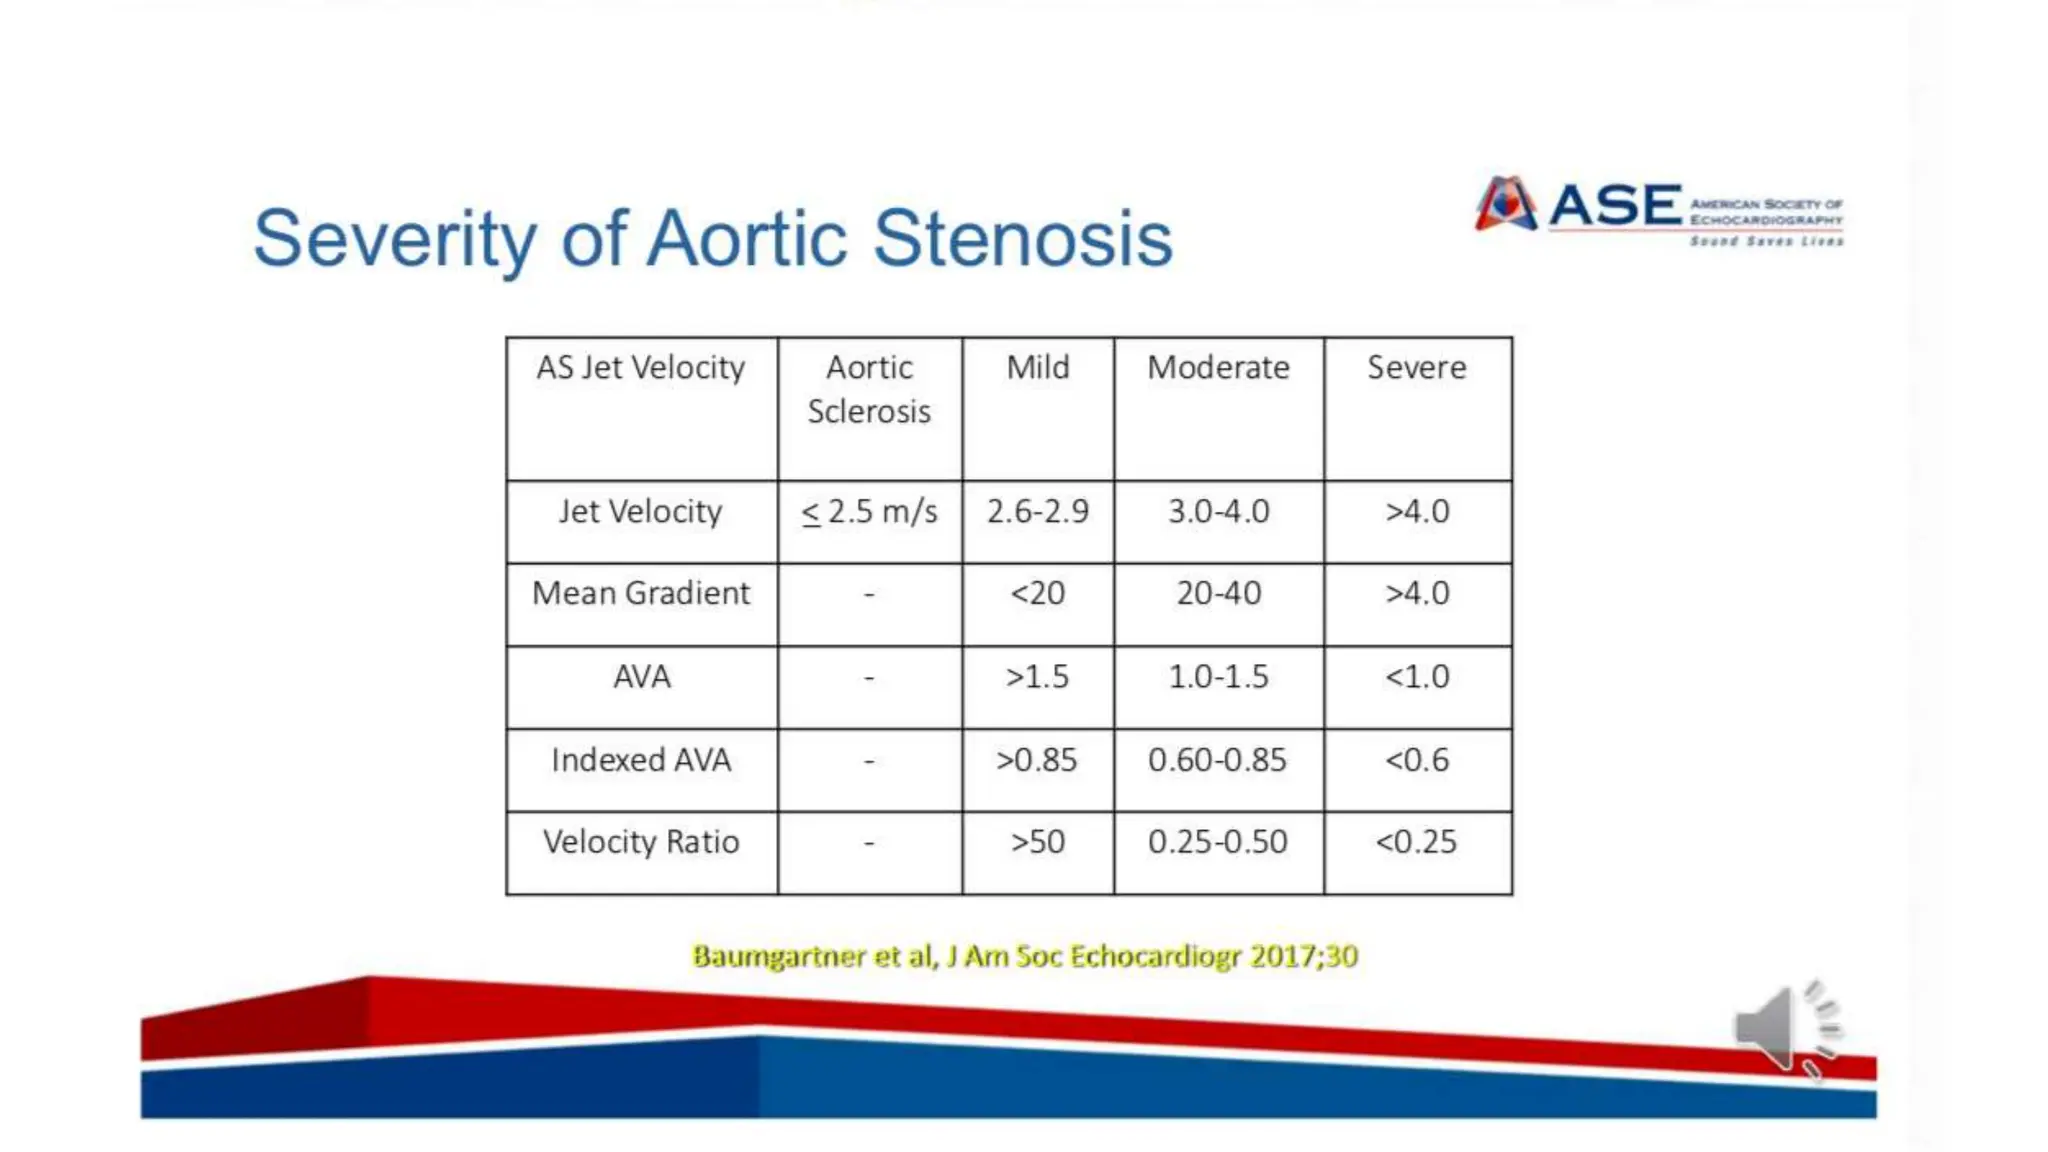
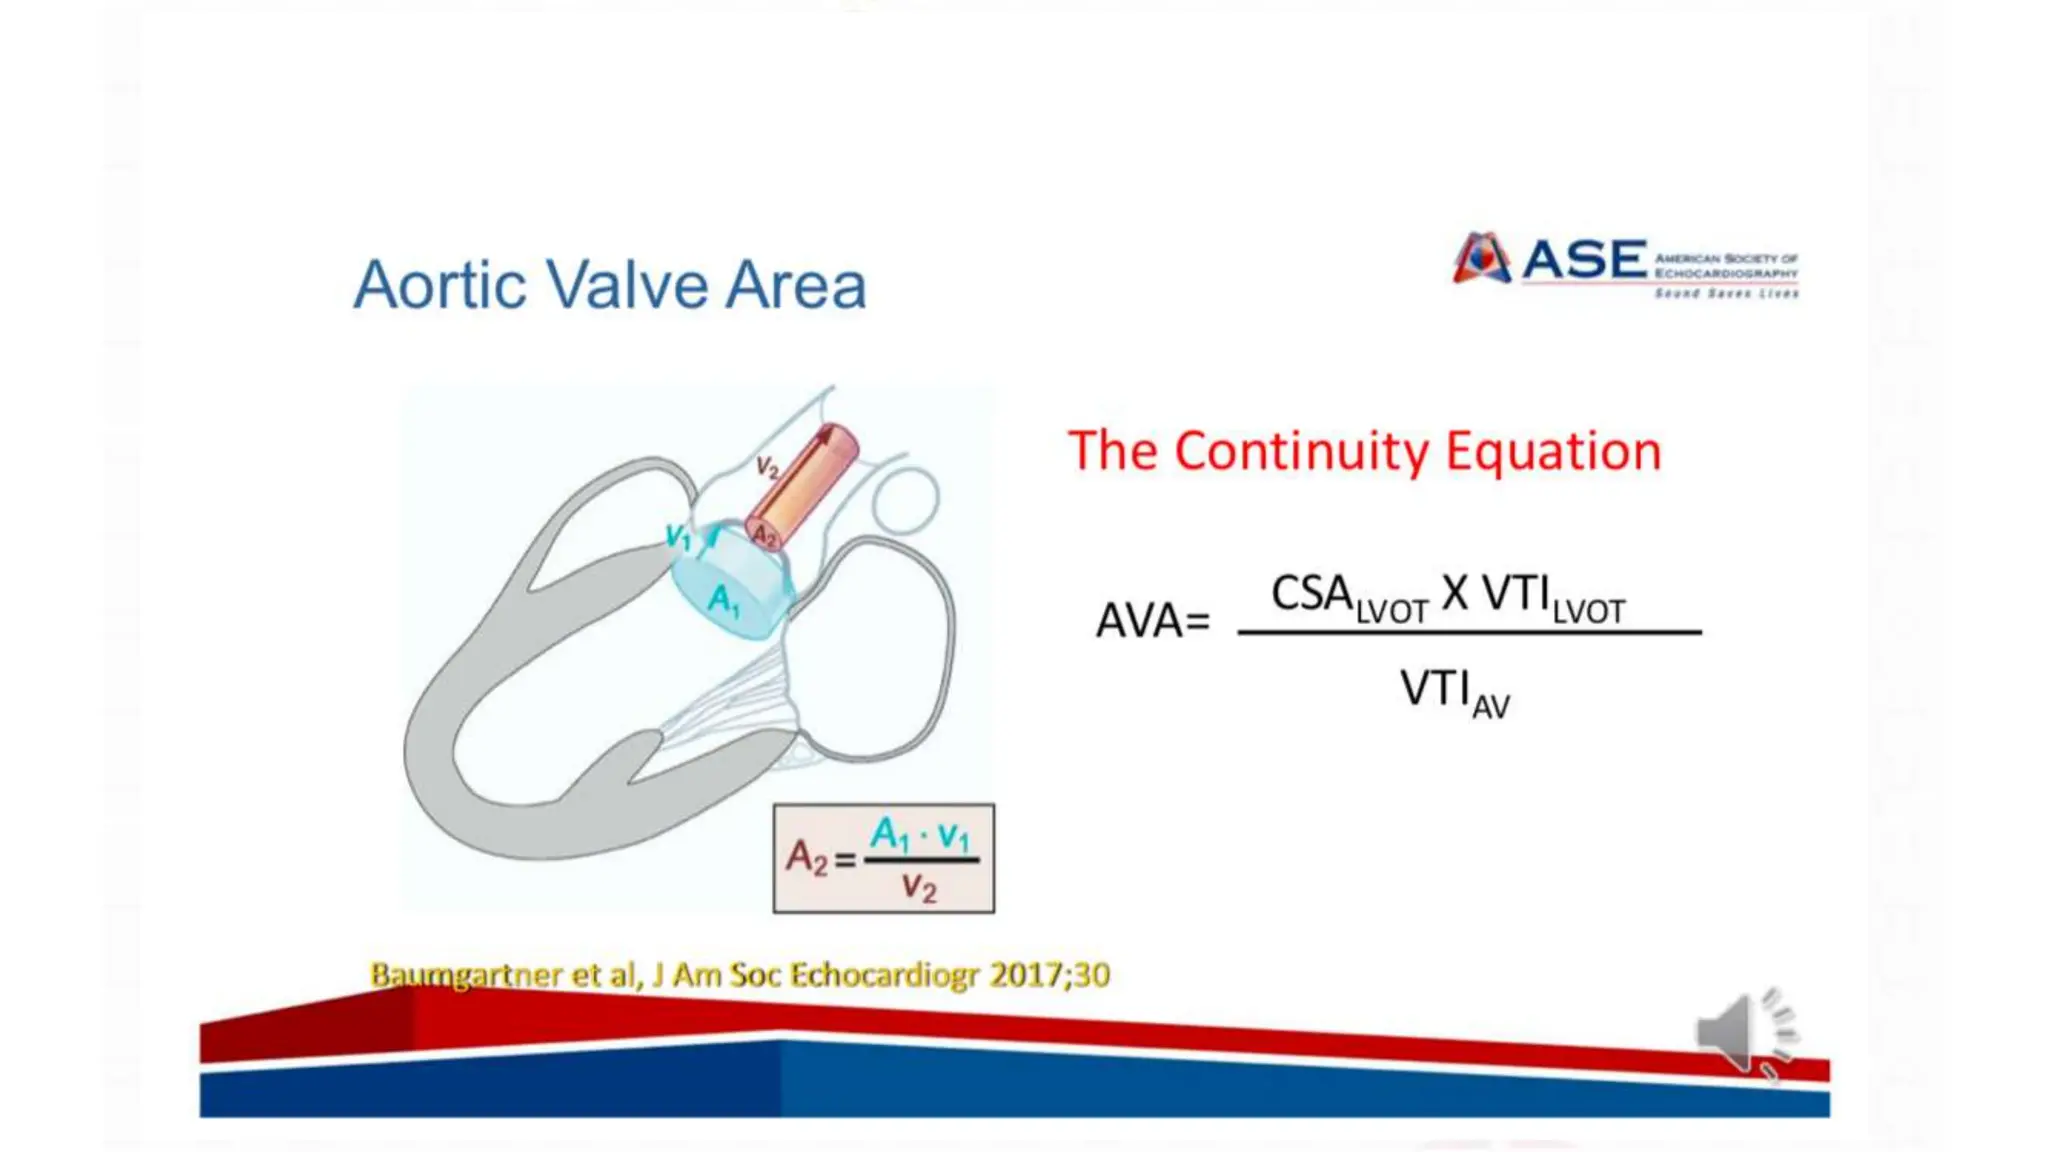
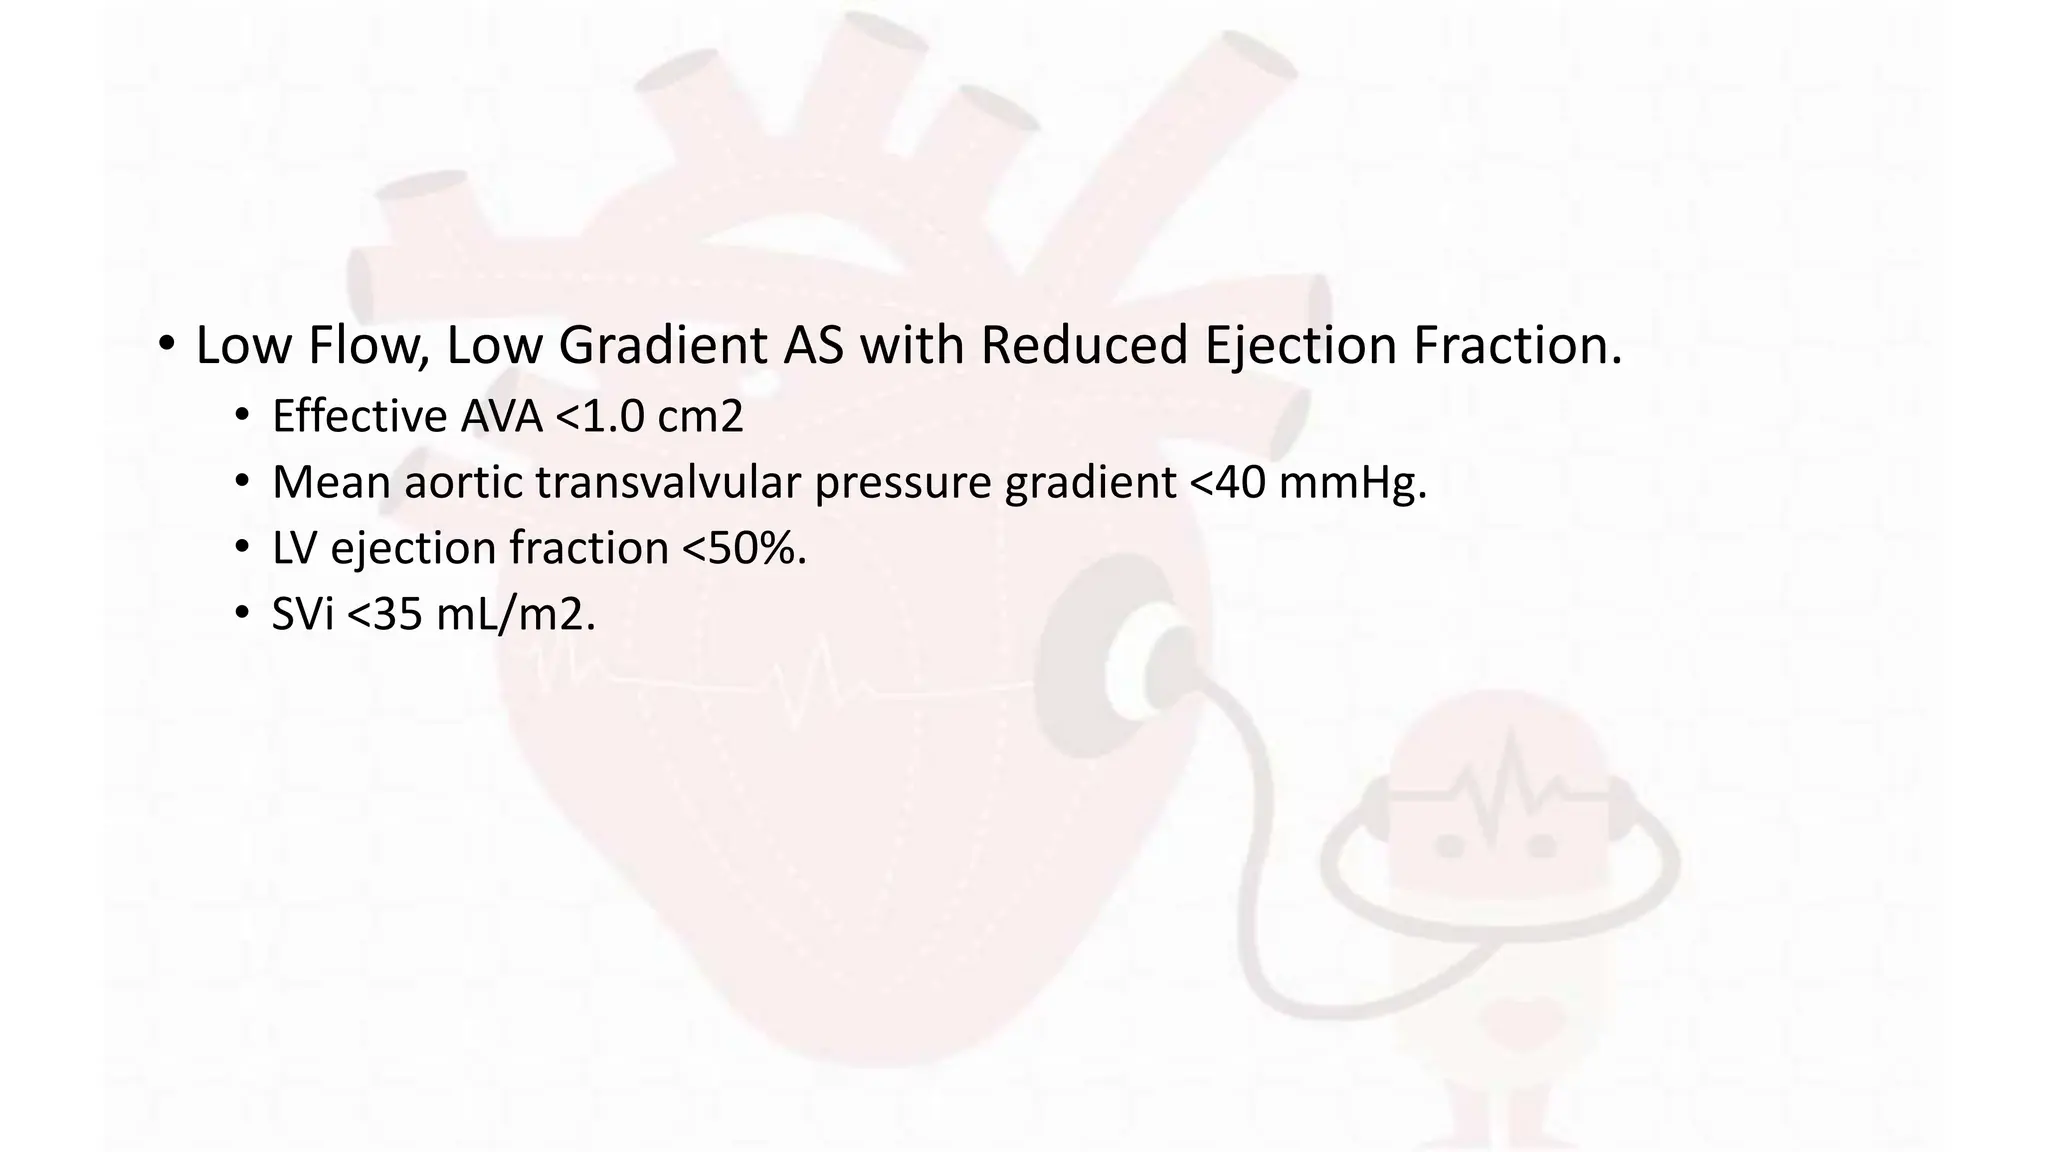
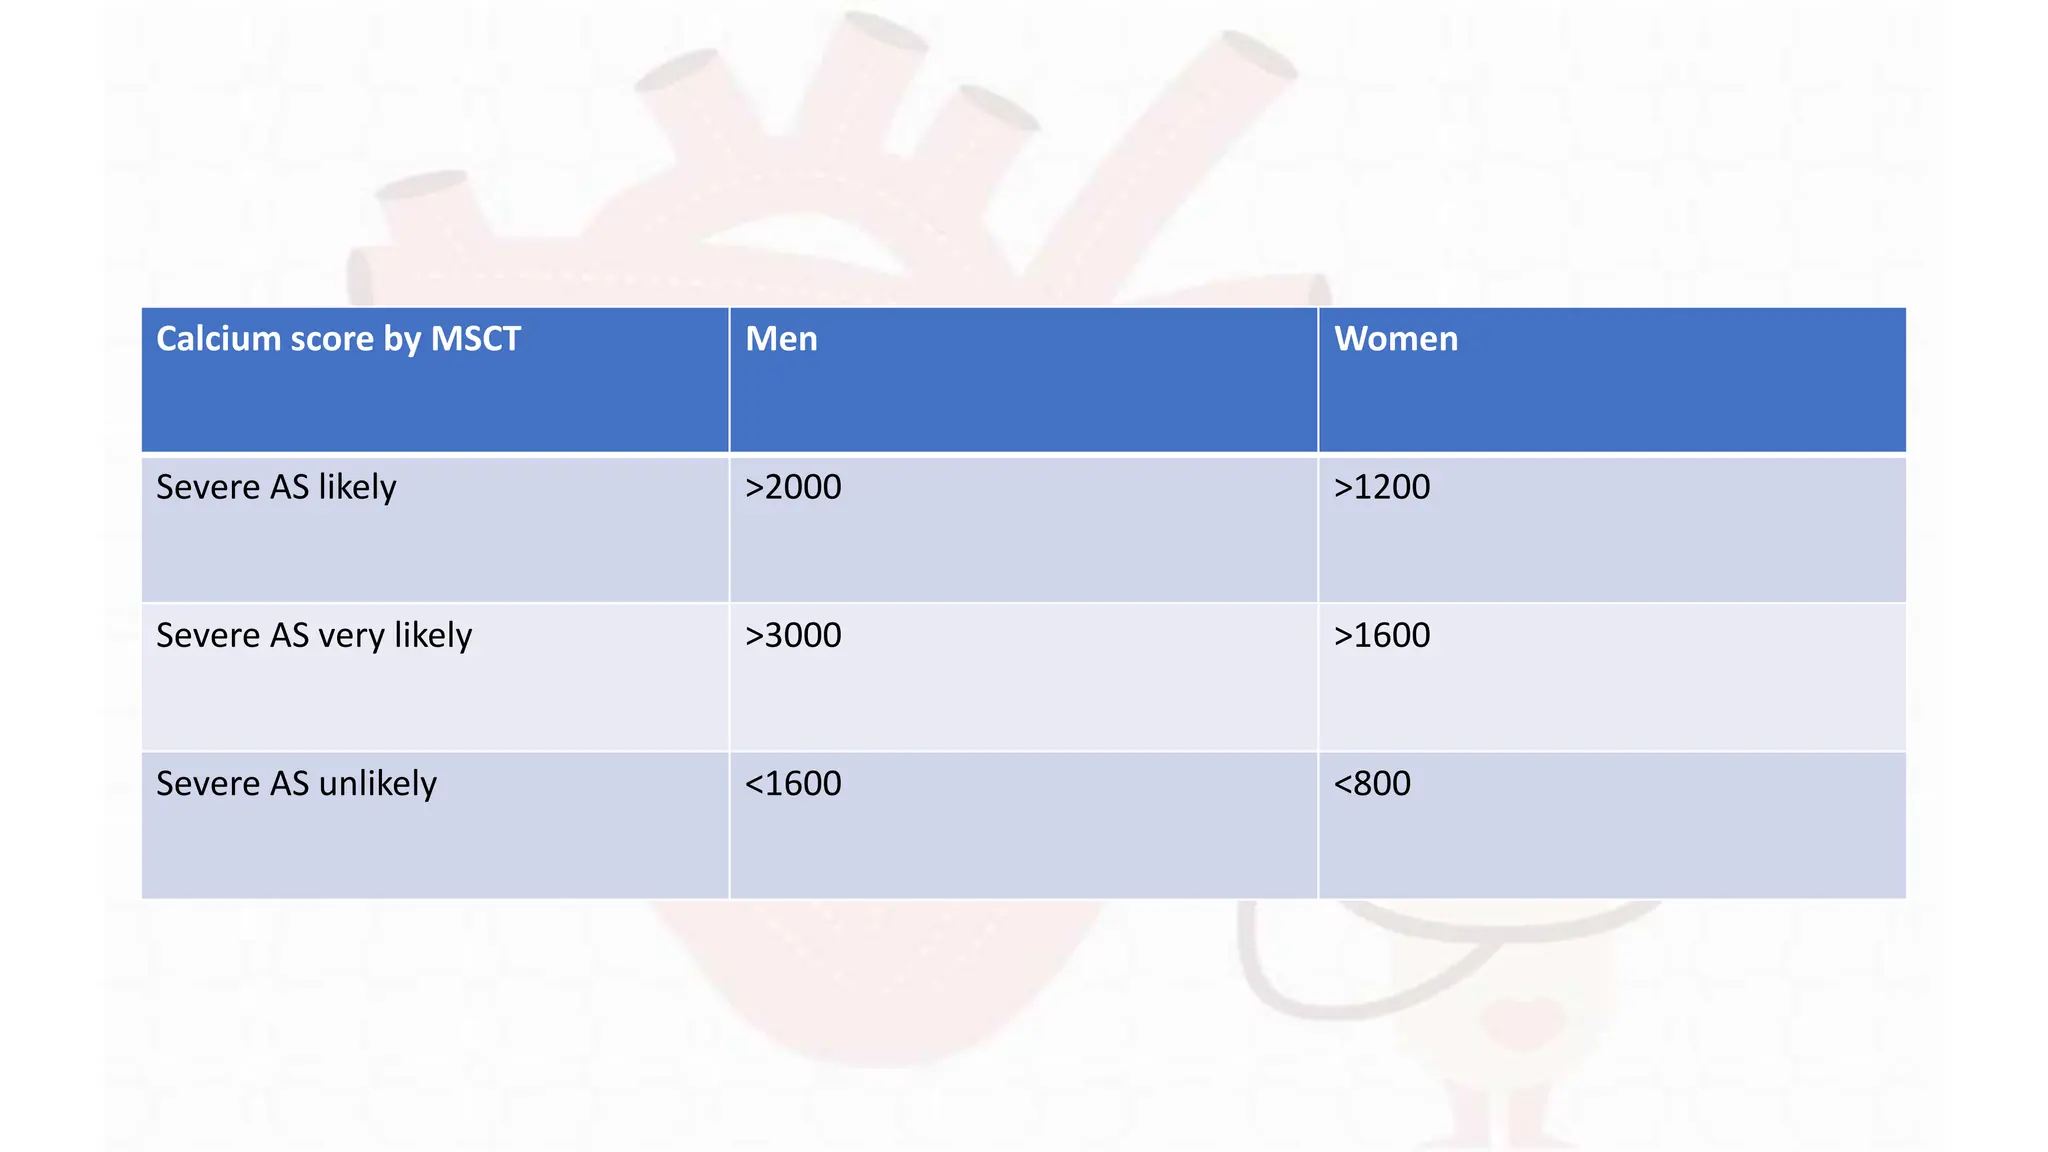
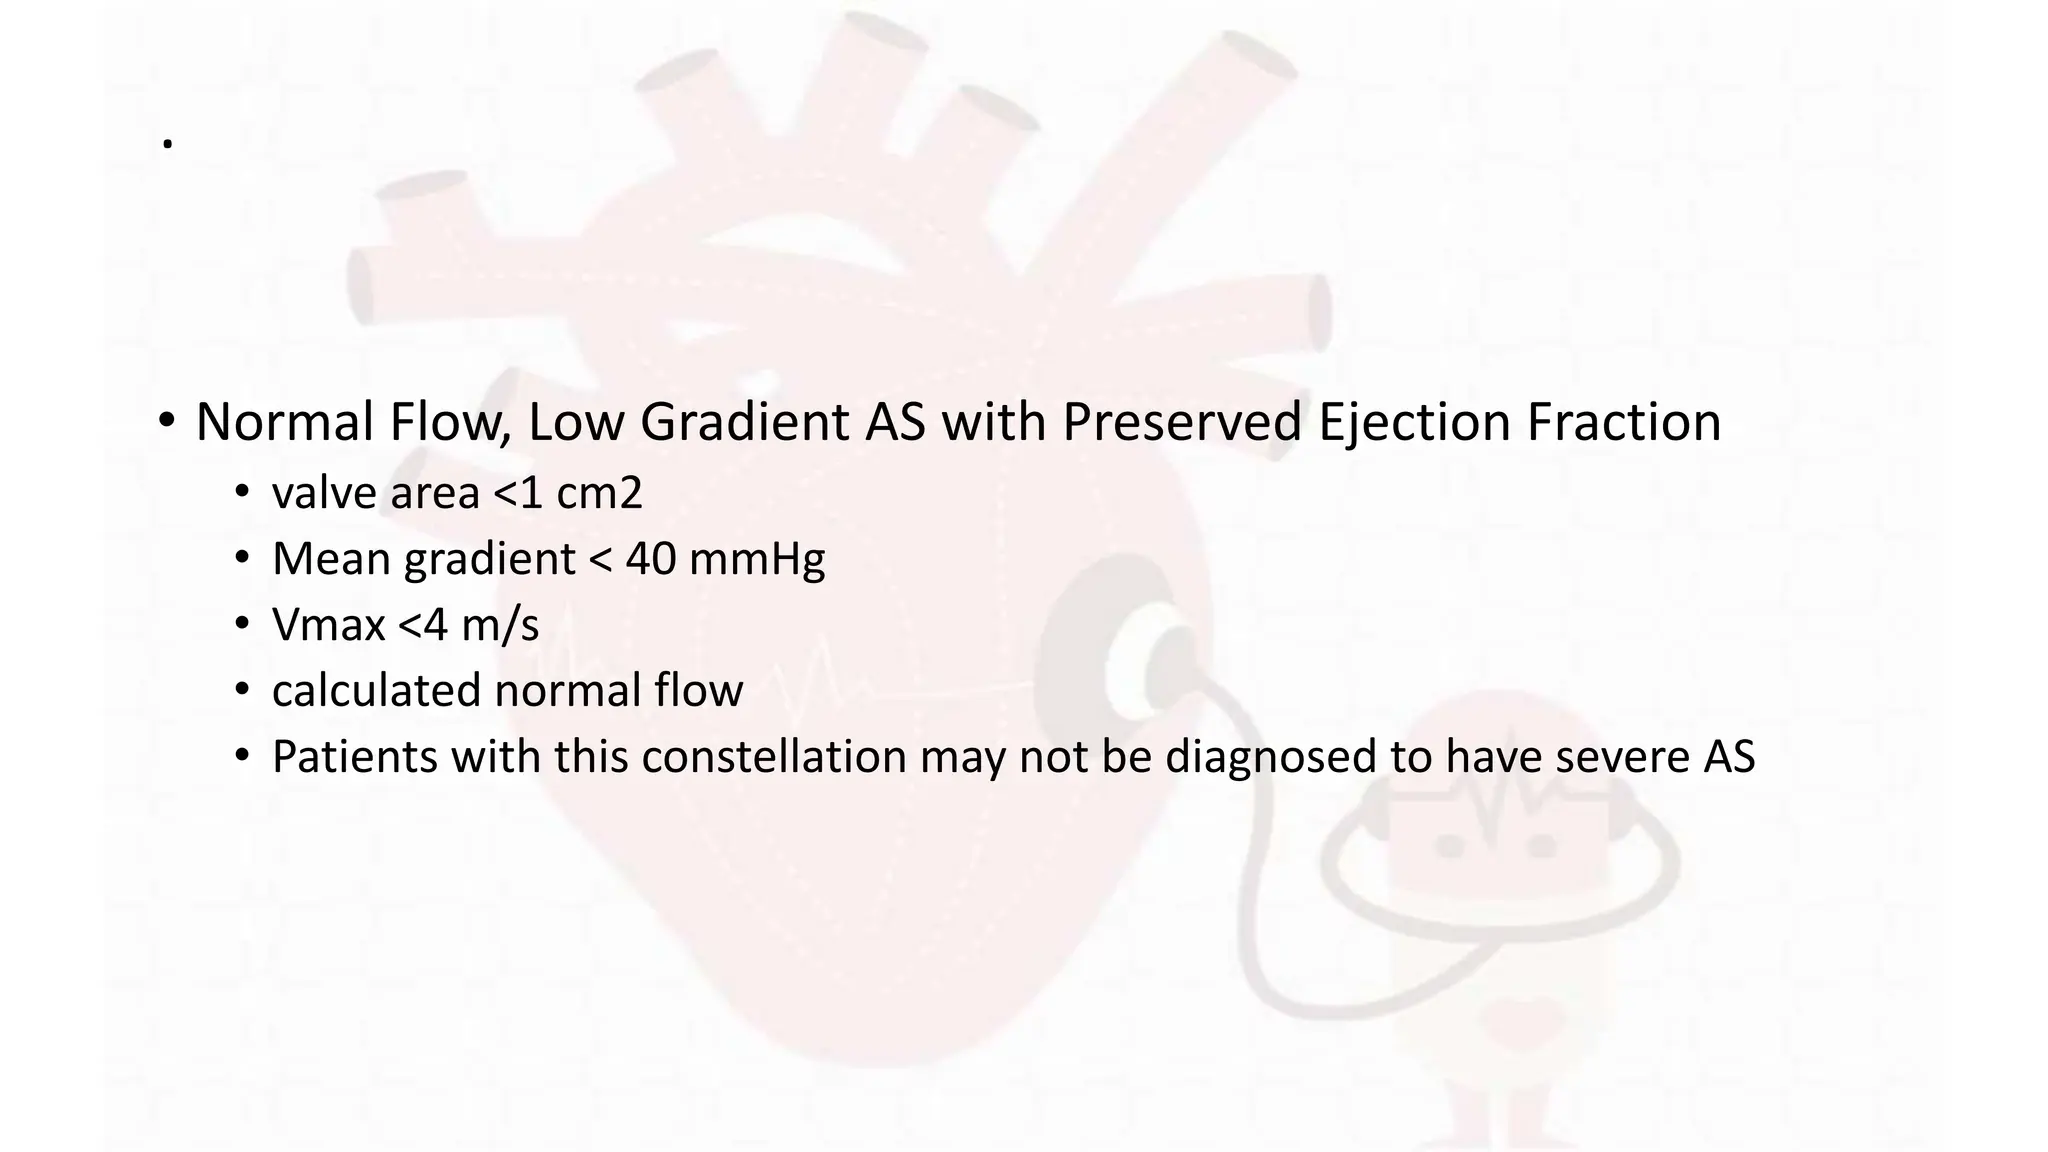
Aortic stenosis-
echocardiographic assessment
• Anatomic evaluation of the aortic valve:
• combination of short- and long-axis images to identify the number of cusps,
and to describe cusp mobility, thickness, and calcification.
• combination of imaging and Doppler allows the determination of the level of
obstruction: subvalvular, valvular, or supravalvular
Bicuspid aortic valve
• Diagnosis is most reliable when the two cusps are seen in systole with
only two commissures framing an elliptical systolic orifice.
• Diastolic images may mimic three cusps when a raphe is present.
• Long-axis views may show an asymmetric closure line, systolic
doming, or diastolic prolapse of one or both of the cusps, but these
findings are less specific than a short-axis systolic image.
Valvular aortic stenosis
• The primary hemodynamic parameters for clinical evaluation of AS
severity :
• AS peak jet velocity.
• Mean transvalvular pressure gradient.
• Aortic valve area by continuity equation.
AS peak jet velocity.
• highest velocity signal obtained from any window after a careful examination
• ‘Angle correction’ should not be used because it is likely to introduce more
error, given the unpredictable jet direction.
• A dedicated small dual-crystal CWD transducer (pencil or PEDOF- pulse echo
Doppler flow velocity meter probe) is strongly recommended both because of
its higher signal-to-noise ratio and because it allows optimal transducer
positioning and angulation
• Averaging of more beats is mandatory with irregular rhythms (at least 5
consecutive beats).
• The shape of the CWD velocity curve is helpful in distinguishing the
level and severity of obstruction.
• Peak gradient calculated from the maximum
Doppler velocity represents the maximum
instantaneous pressure difference across the
valve, not the difference between the peak left
ventricular (LV) and peak aortic pressure that is
commonly measured from the pressure
tracings.
• Phenomenon of pressure recovery (PR) can
result in echo doppler gradients higher and
valve area lower than those measured on
cardiac cath.
• Standard calculation of continuity-equation valve area requires three
measurements:
• AS jet velocity by CWD.
• LVOT diameter for calculation of the CSA.
• LVOT velocity recorded with pulsed Doppler.
LVOT diameter
LVOT velocity
Alternative Measures of Stenosis Severity
• Simplified Continuity Equation.
• Velocity Ratio and VTI Ratio (Dimensionless Index).
• AVA Planimetry.
Special Considerations of Difficult Subgroups
Valve area may be >1.0 cm2 despite a peak velocity >4 m/s and mean
gradient >40 mmHg in the presence of a high transvalvular flow.
• concomitant AR or shunt lesions.
• Reversible causes of increased flow in case of high cardiac output (fever,
anemia, hyperthyroidism, atrioventricular shunts for dialysis, etc.) must be
excluded.
Valve area <1.0 cm2 in the presence of a peak velocity <4 m/s and
mean gradient <40 mmHg.
• current cut-offs for valve area and velocity/gradient are not
consistent.
• To generate a mean gradient of 40 mmHg at a normal flow rate, the
valve area must be closer to 0.8 than to 1.0 cm
• Small stature of the patient may be another reason for the finding of
a small valve area and low gradient.
• Low Flow, Low Gradient AS with Reduced Ejection Fraction.
• Effective AVA <1.0 cm2
• Mean aortic transvalvular pressure gradient <40 mmHg.
• LV ejection fraction <50%.
• SVi <35 mL/m2.
• Low Flow, Low Gradient AS with Preserved Ejection Fraction.
• valve area <1 cm2
• peak velocity <4 m/s
• mean pressure gradient <40 mmHg
• normal LVEF.
• ‘paradoxical’ low flow, low gradient AS with preserved EF
• refers to patients with hypertrophied, small ventricles resulting in
reduced transvalvular flow
• The degree of valve calcification assessed by non-contrast CT may
help identify true severe AS
Calcium score by MSCT Men Women
Severe AS likely >2000 >1200
Severe AS very likely >3000 >1600
Severe AS unlikely <1600 <800
.
• Normal Flow, Low Gradient AS with Preserved Ejection Fraction
• valve area <1 cm2
• Mean gradient < 40 mmHg
• Vmax <4 m/s
• calculated normal flow
• Patients with this constellation may not be diagnosed to have severe AS
Thank you

Aortic stenosis Diagnosis and grading .pptx

  • 1.
  • 3.
    • Anatomic evaluationof the aortic valve: • combination of short- and long-axis images to identify the number of cusps, and to describe cusp mobility, thickness, and calcification. • combination of imaging and Doppler allows the determination of the level of obstruction: subvalvular, valvular, or supravalvular
  • 4.
    Bicuspid aortic valve •Diagnosis is most reliable when the two cusps are seen in systole with only two commissures framing an elliptical systolic orifice. • Diastolic images may mimic three cusps when a raphe is present. • Long-axis views may show an asymmetric closure line, systolic doming, or diastolic prolapse of one or both of the cusps, but these findings are less specific than a short-axis systolic image.
  • 5.
    Valvular aortic stenosis •The primary hemodynamic parameters for clinical evaluation of AS severity : • AS peak jet velocity. • Mean transvalvular pressure gradient. • Aortic valve area by continuity equation.
  • 6.
    AS peak jetvelocity. • highest velocity signal obtained from any window after a careful examination • ‘Angle correction’ should not be used because it is likely to introduce more error, given the unpredictable jet direction. • A dedicated small dual-crystal CWD transducer (pencil or PEDOF- pulse echo Doppler flow velocity meter probe) is strongly recommended both because of its higher signal-to-noise ratio and because it allows optimal transducer positioning and angulation • Averaging of more beats is mandatory with irregular rhythms (at least 5 consecutive beats).
  • 8.
    • The shapeof the CWD velocity curve is helpful in distinguishing the level and severity of obstruction.
  • 12.
    • Peak gradientcalculated from the maximum Doppler velocity represents the maximum instantaneous pressure difference across the valve, not the difference between the peak left ventricular (LV) and peak aortic pressure that is commonly measured from the pressure tracings. • Phenomenon of pressure recovery (PR) can result in echo doppler gradients higher and valve area lower than those measured on cardiac cath.
  • 14.
    • Standard calculationof continuity-equation valve area requires three measurements: • AS jet velocity by CWD. • LVOT diameter for calculation of the CSA. • LVOT velocity recorded with pulsed Doppler.
  • 15.
  • 16.
  • 18.
    Alternative Measures ofStenosis Severity • Simplified Continuity Equation. • Velocity Ratio and VTI Ratio (Dimensionless Index). • AVA Planimetry.
  • 19.
    Special Considerations ofDifficult Subgroups Valve area may be >1.0 cm2 despite a peak velocity >4 m/s and mean gradient >40 mmHg in the presence of a high transvalvular flow. • concomitant AR or shunt lesions. • Reversible causes of increased flow in case of high cardiac output (fever, anemia, hyperthyroidism, atrioventricular shunts for dialysis, etc.) must be excluded.
  • 20.
    Valve area <1.0cm2 in the presence of a peak velocity <4 m/s and mean gradient <40 mmHg. • current cut-offs for valve area and velocity/gradient are not consistent. • To generate a mean gradient of 40 mmHg at a normal flow rate, the valve area must be closer to 0.8 than to 1.0 cm • Small stature of the patient may be another reason for the finding of a small valve area and low gradient.
  • 22.
    • Low Flow,Low Gradient AS with Reduced Ejection Fraction. • Effective AVA <1.0 cm2 • Mean aortic transvalvular pressure gradient <40 mmHg. • LV ejection fraction <50%. • SVi <35 mL/m2.
  • 24.
    • Low Flow,Low Gradient AS with Preserved Ejection Fraction. • valve area <1 cm2 • peak velocity <4 m/s • mean pressure gradient <40 mmHg • normal LVEF. • ‘paradoxical’ low flow, low gradient AS with preserved EF • refers to patients with hypertrophied, small ventricles resulting in reduced transvalvular flow • The degree of valve calcification assessed by non-contrast CT may help identify true severe AS
  • 25.
    Calcium score byMSCT Men Women Severe AS likely >2000 >1200 Severe AS very likely >3000 >1600 Severe AS unlikely <1600 <800
  • 26.
    . • Normal Flow,Low Gradient AS with Preserved Ejection Fraction • valve area <1 cm2 • Mean gradient < 40 mmHg • Vmax <4 m/s • calculated normal flow • Patients with this constellation may not be diagnosed to have severe AS
  • 27.