Downloaded 216 times
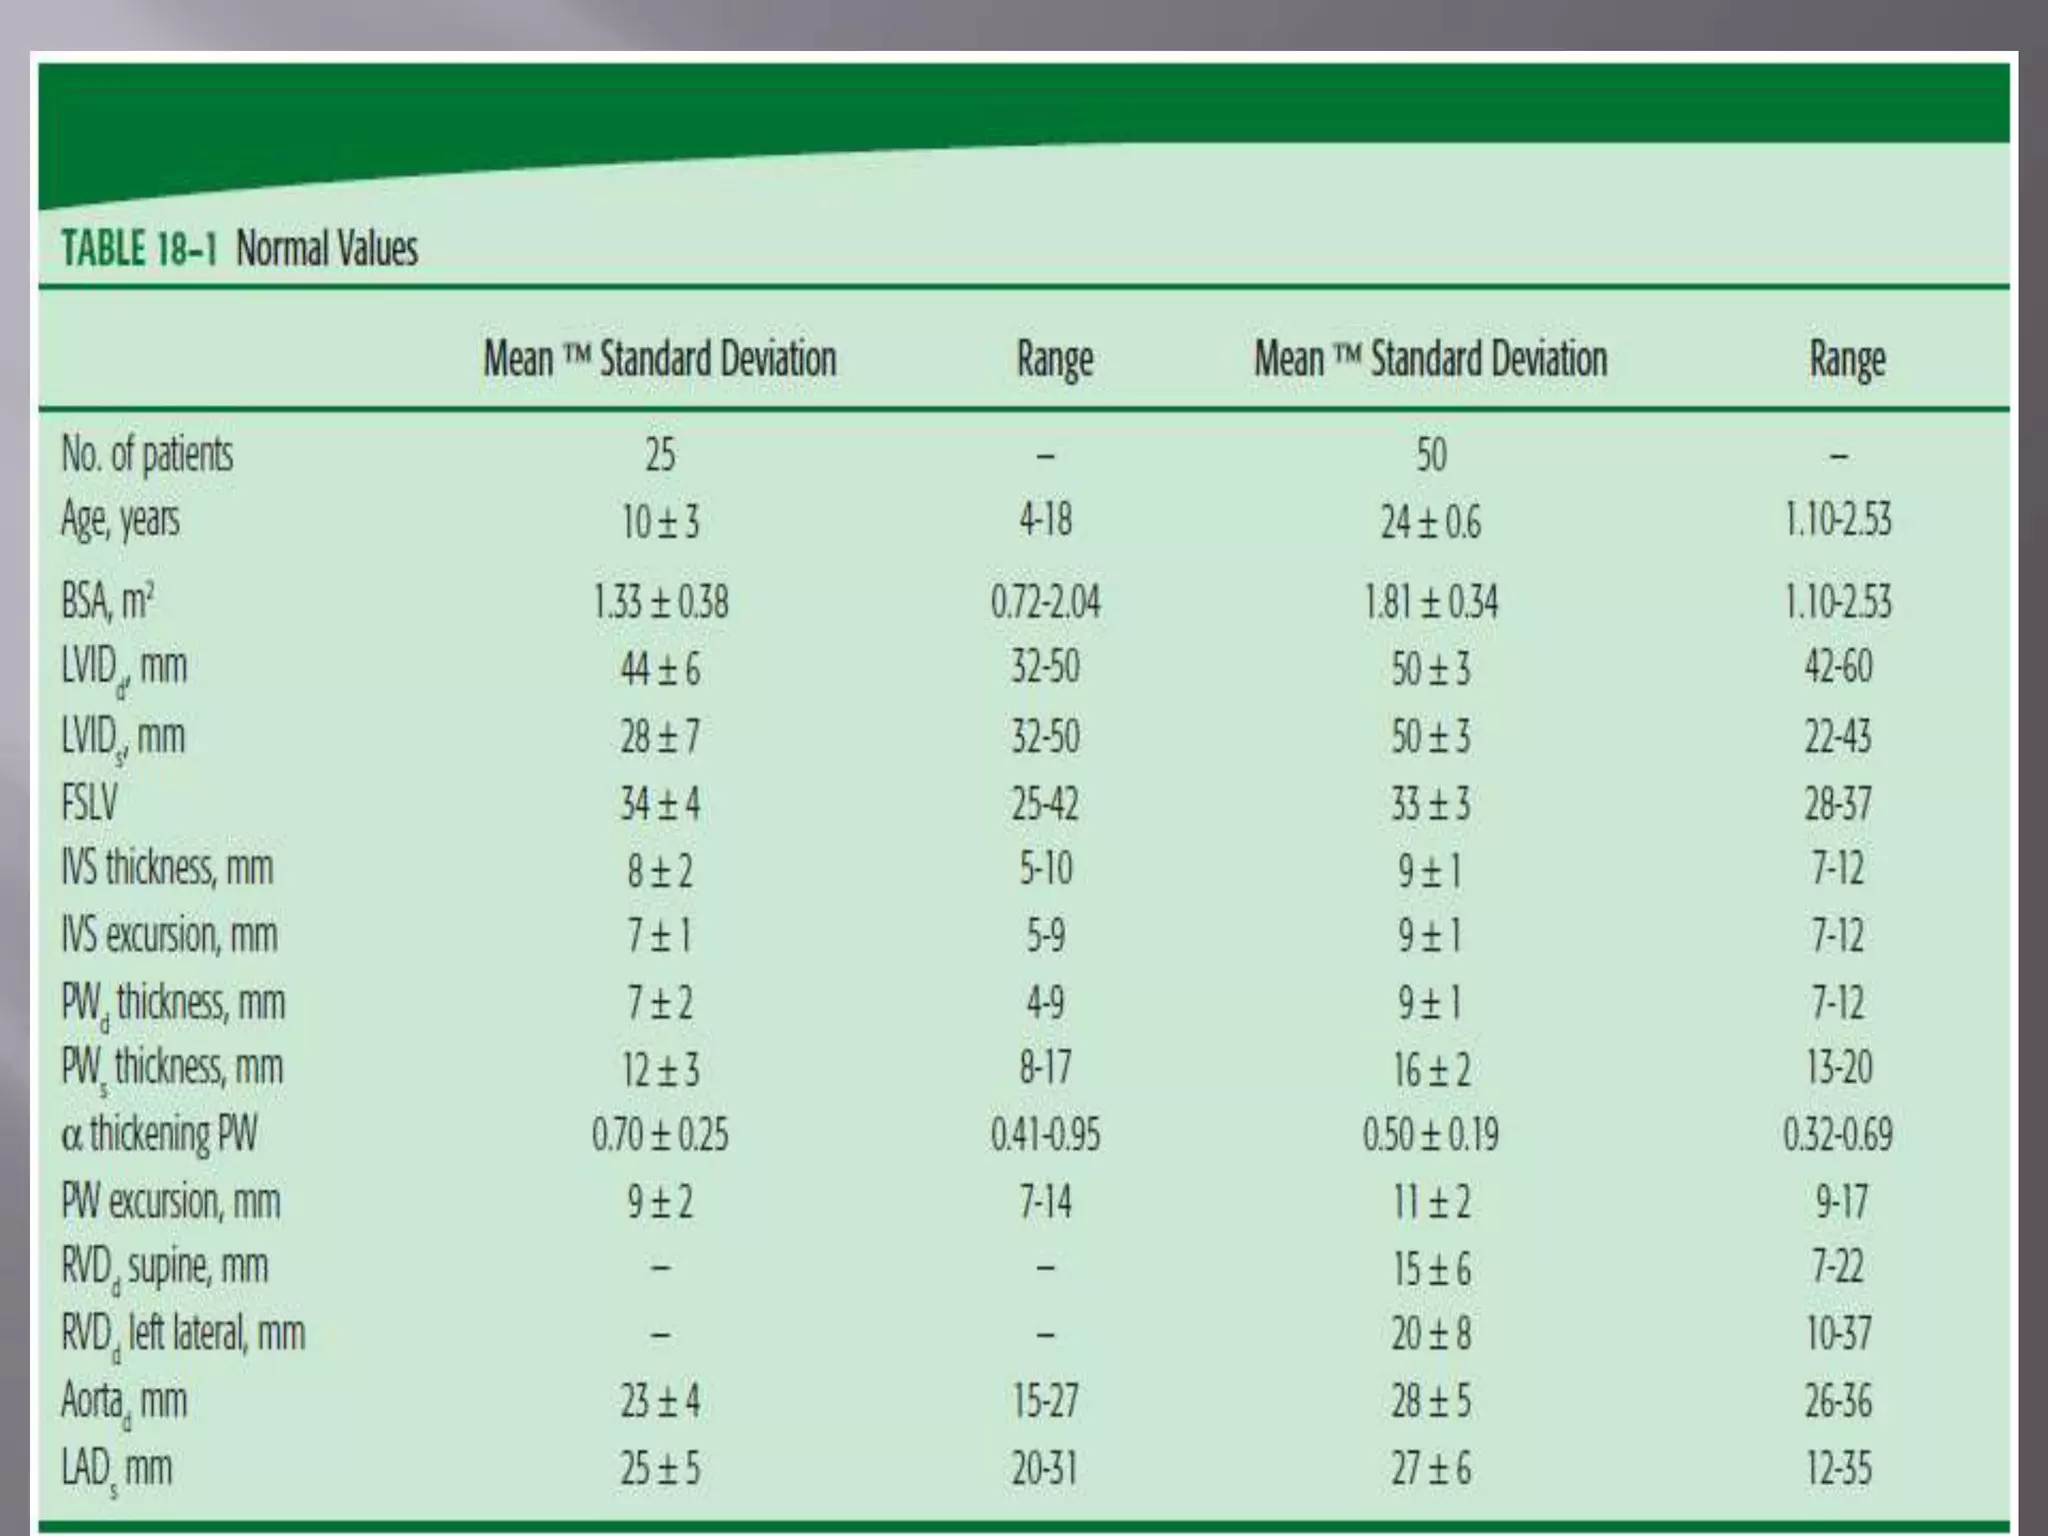
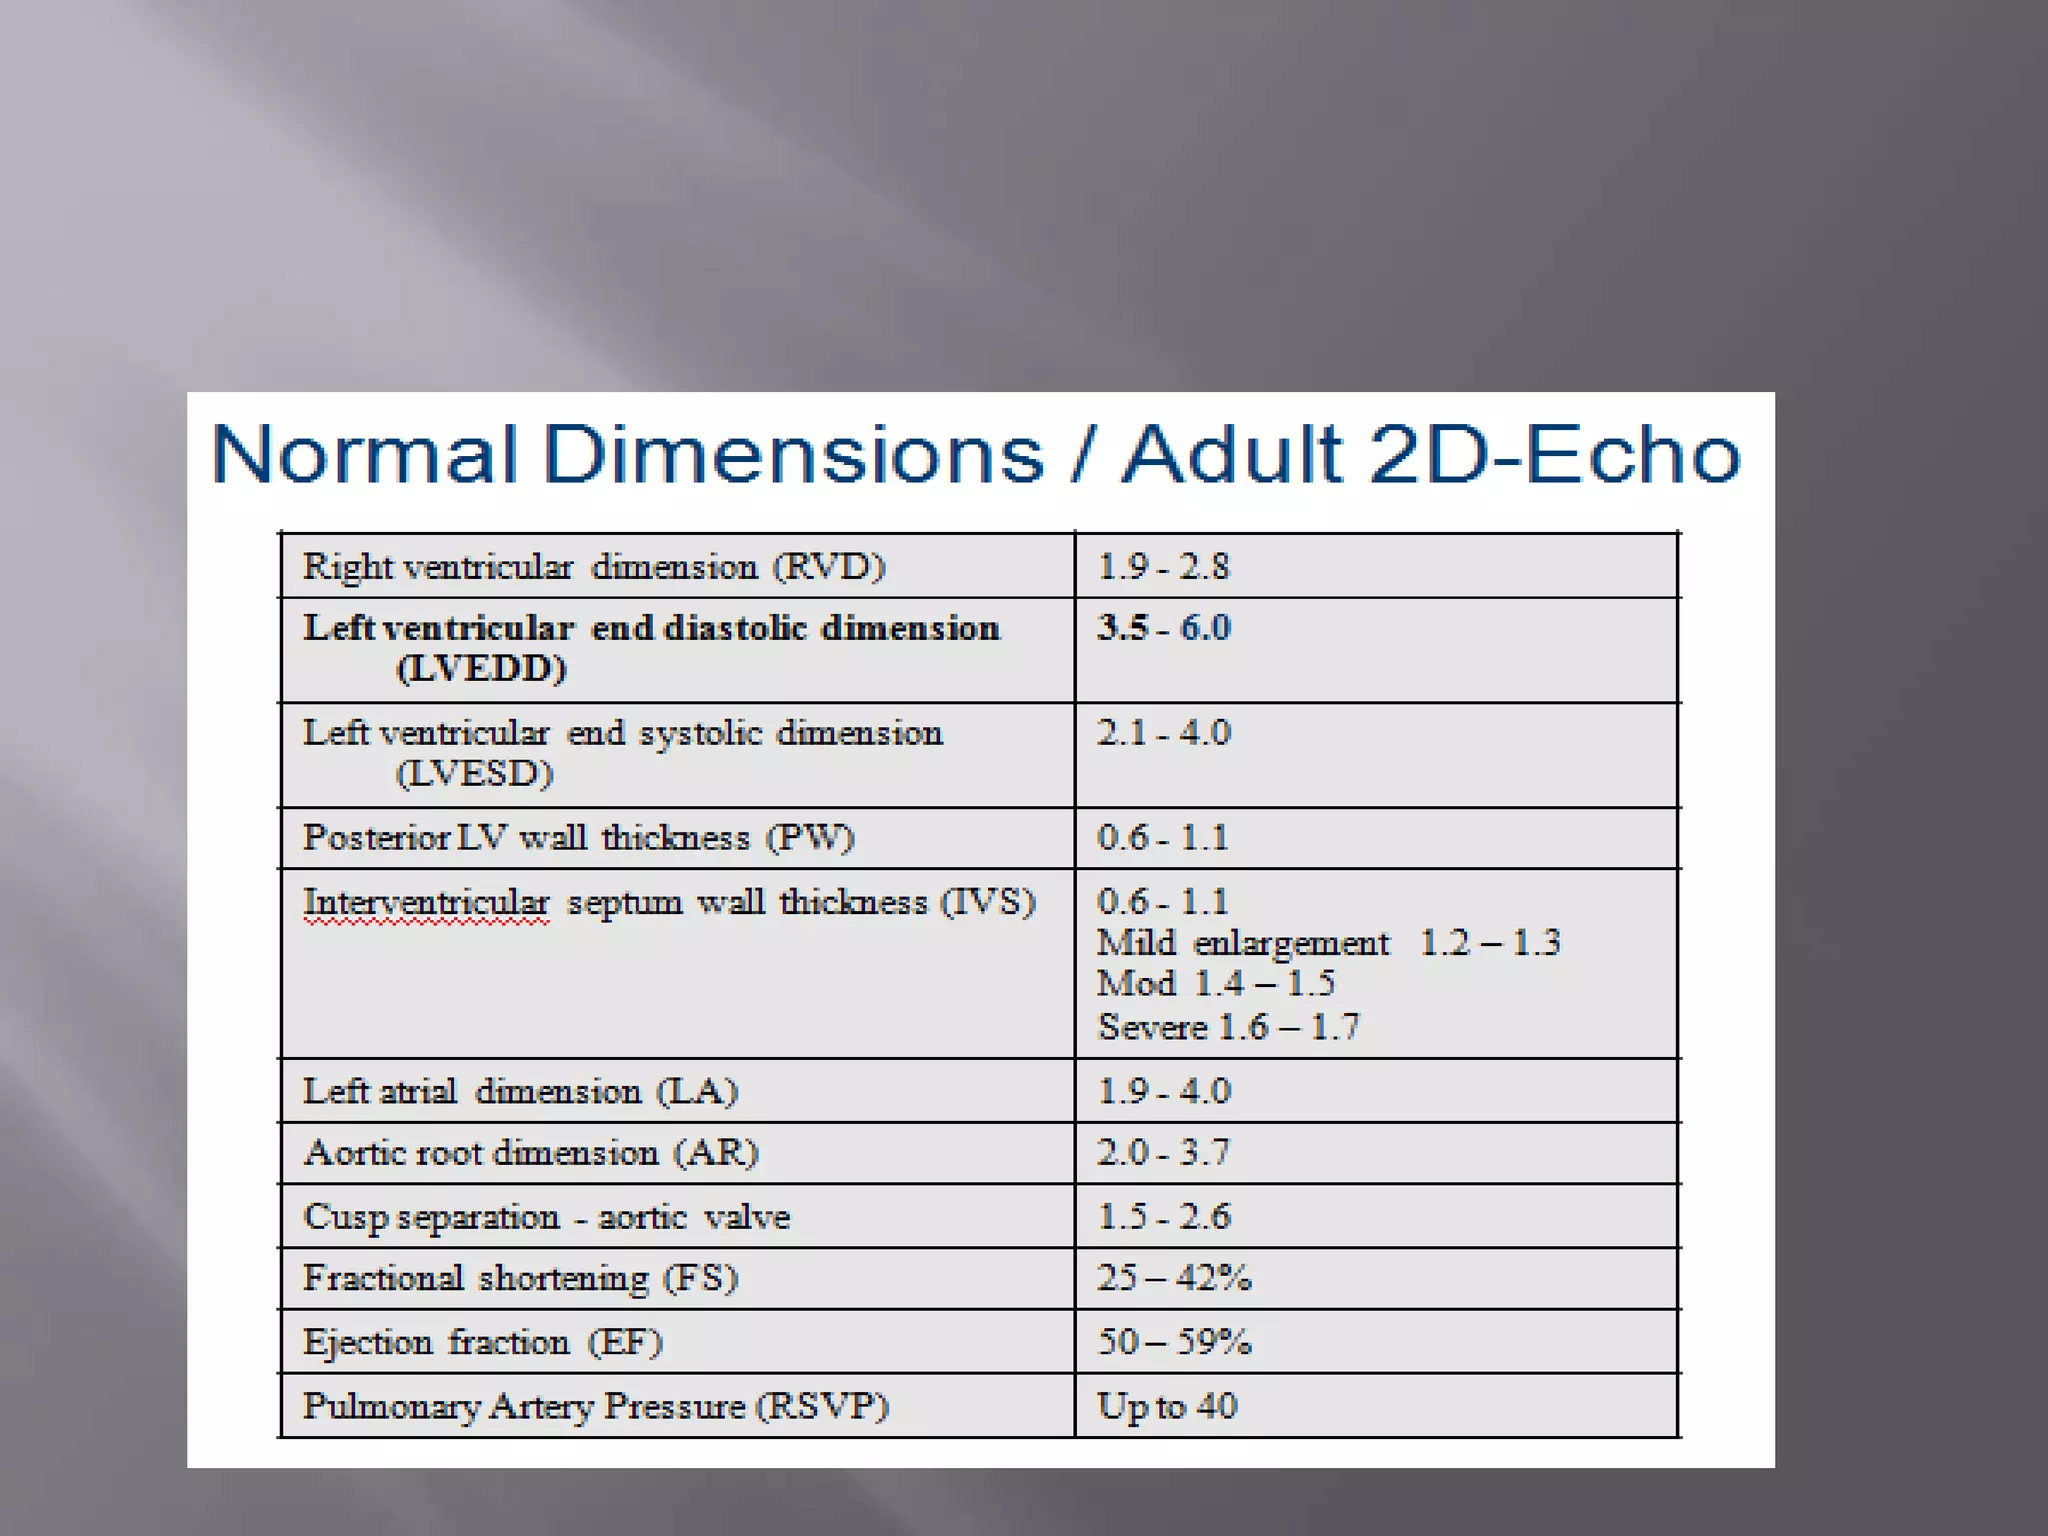
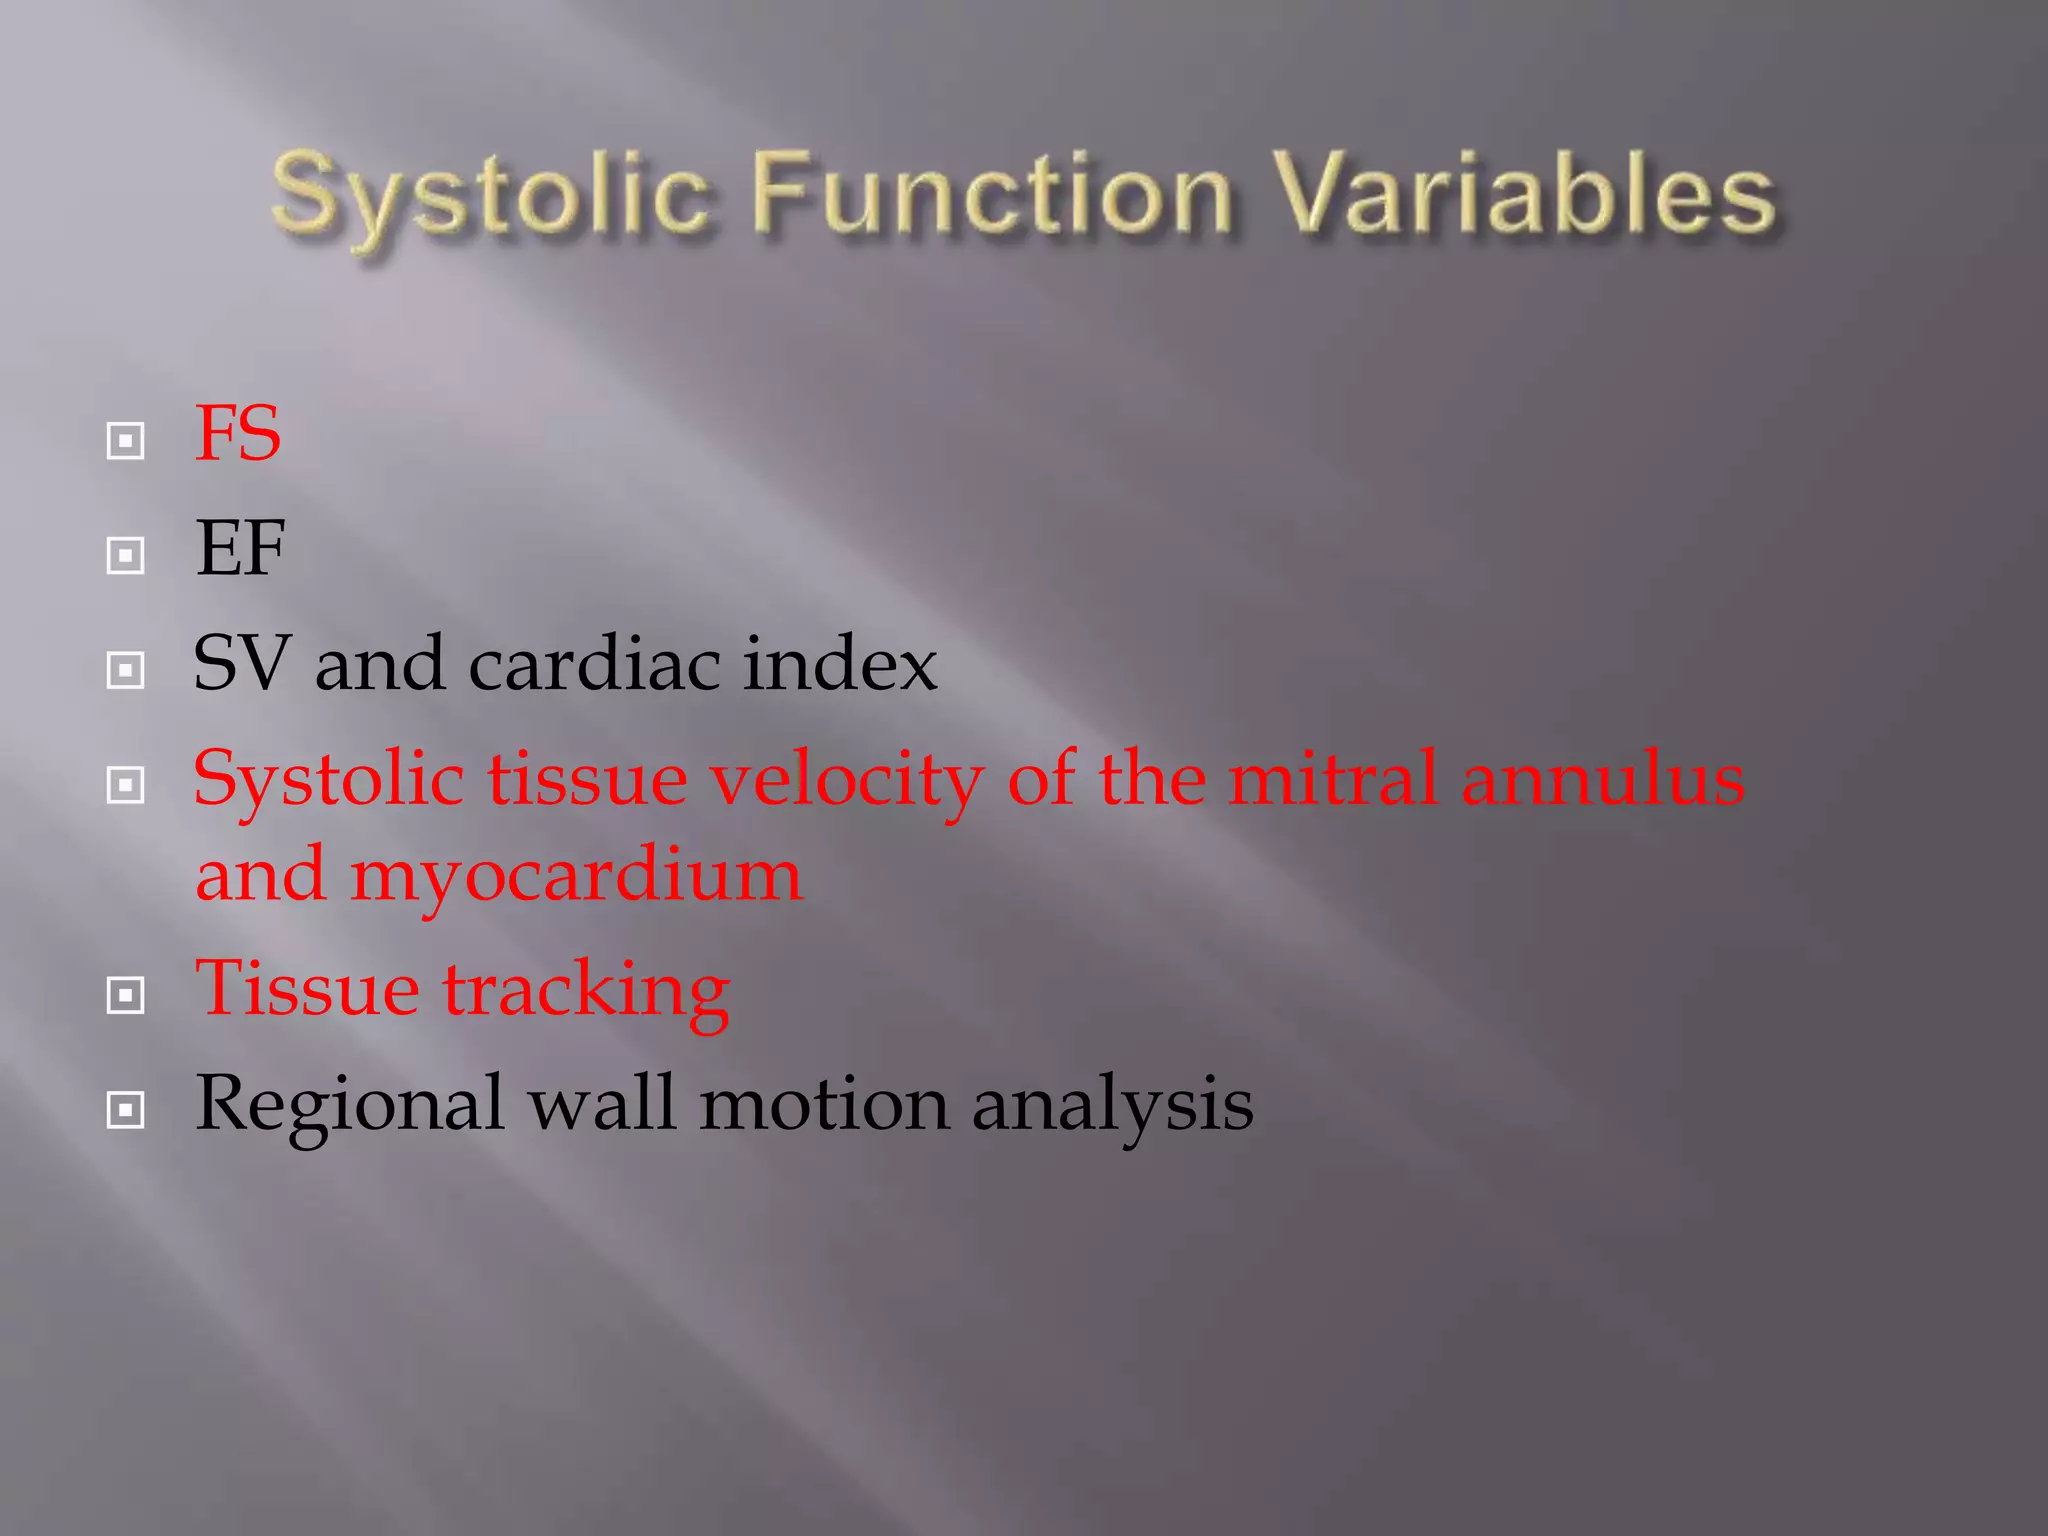
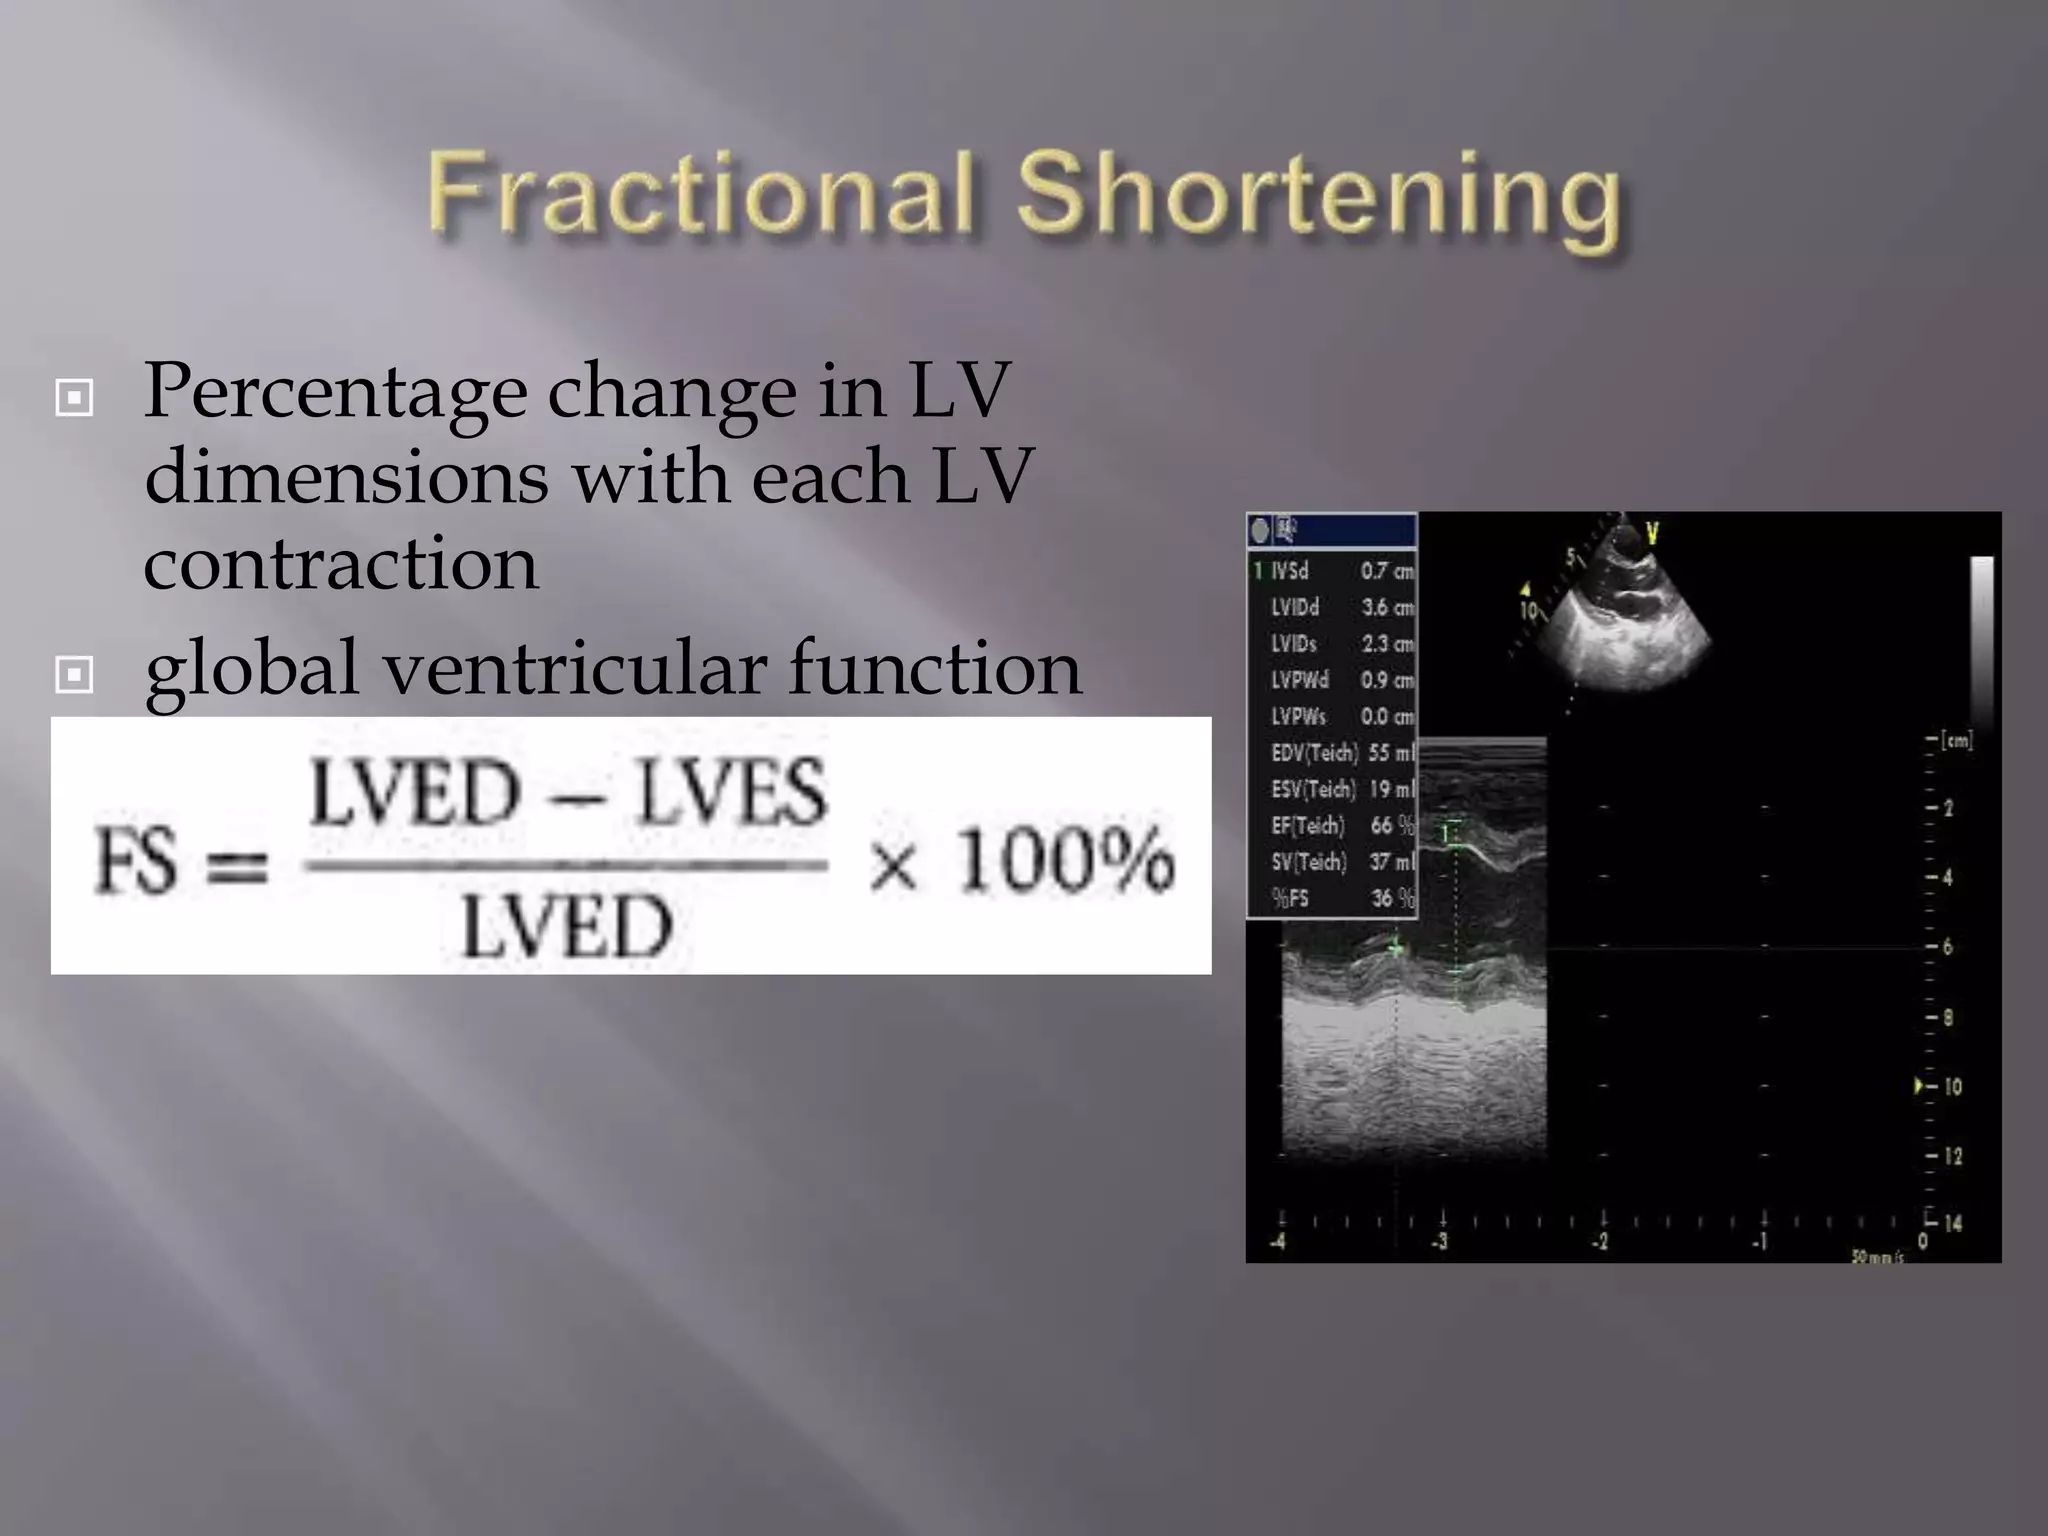

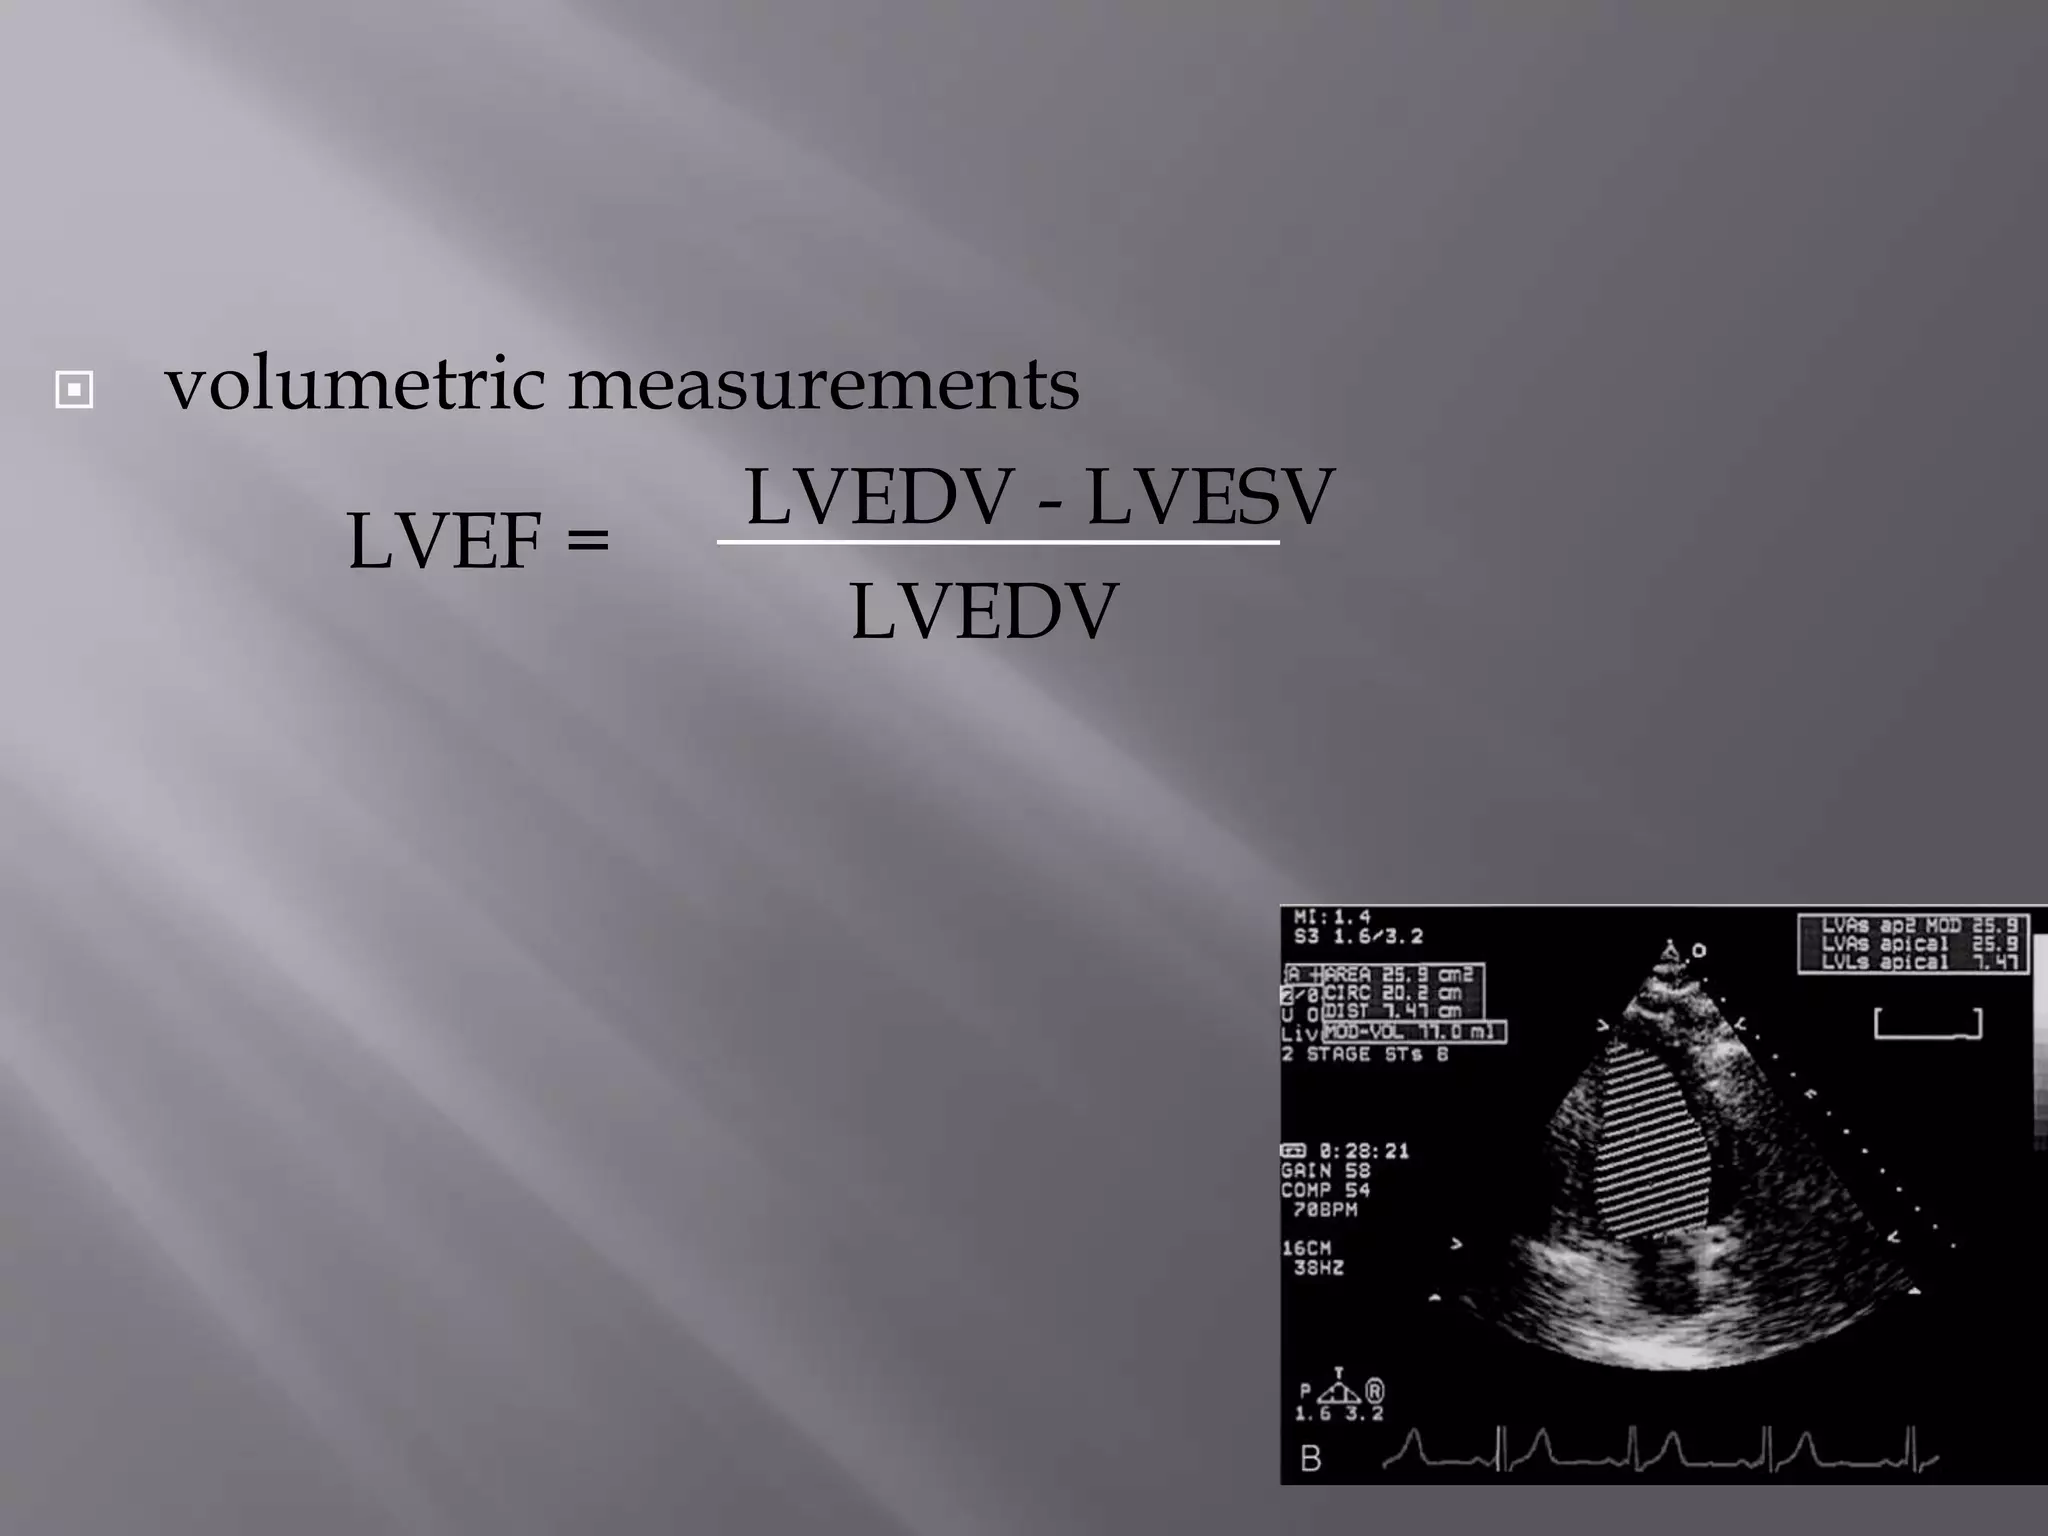
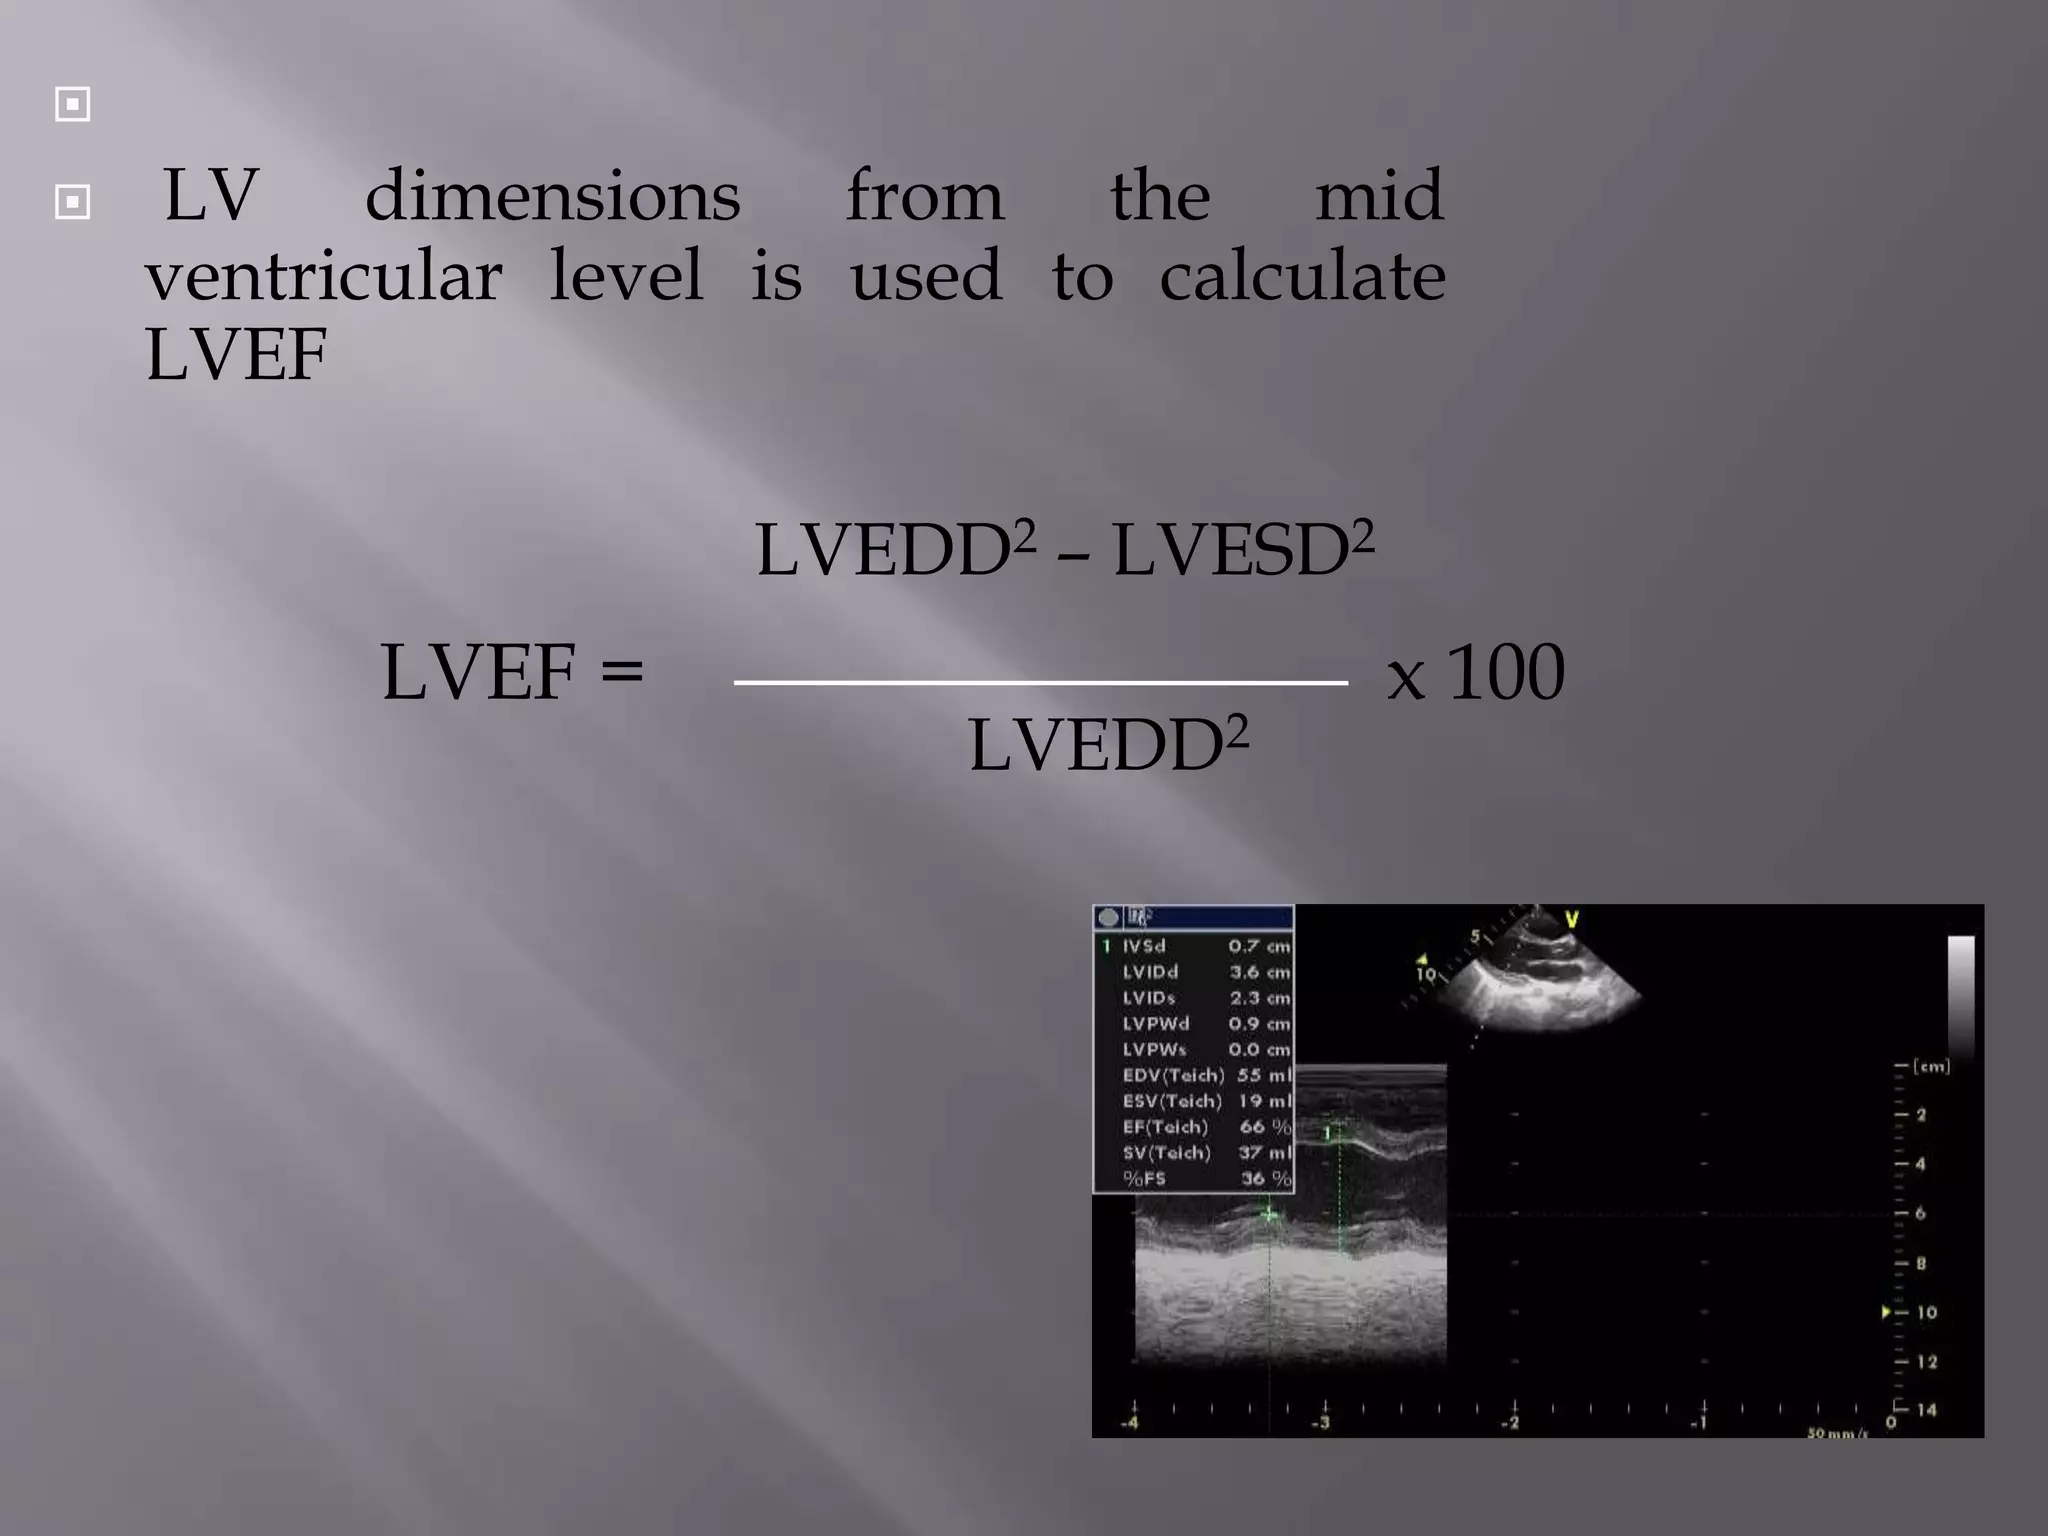
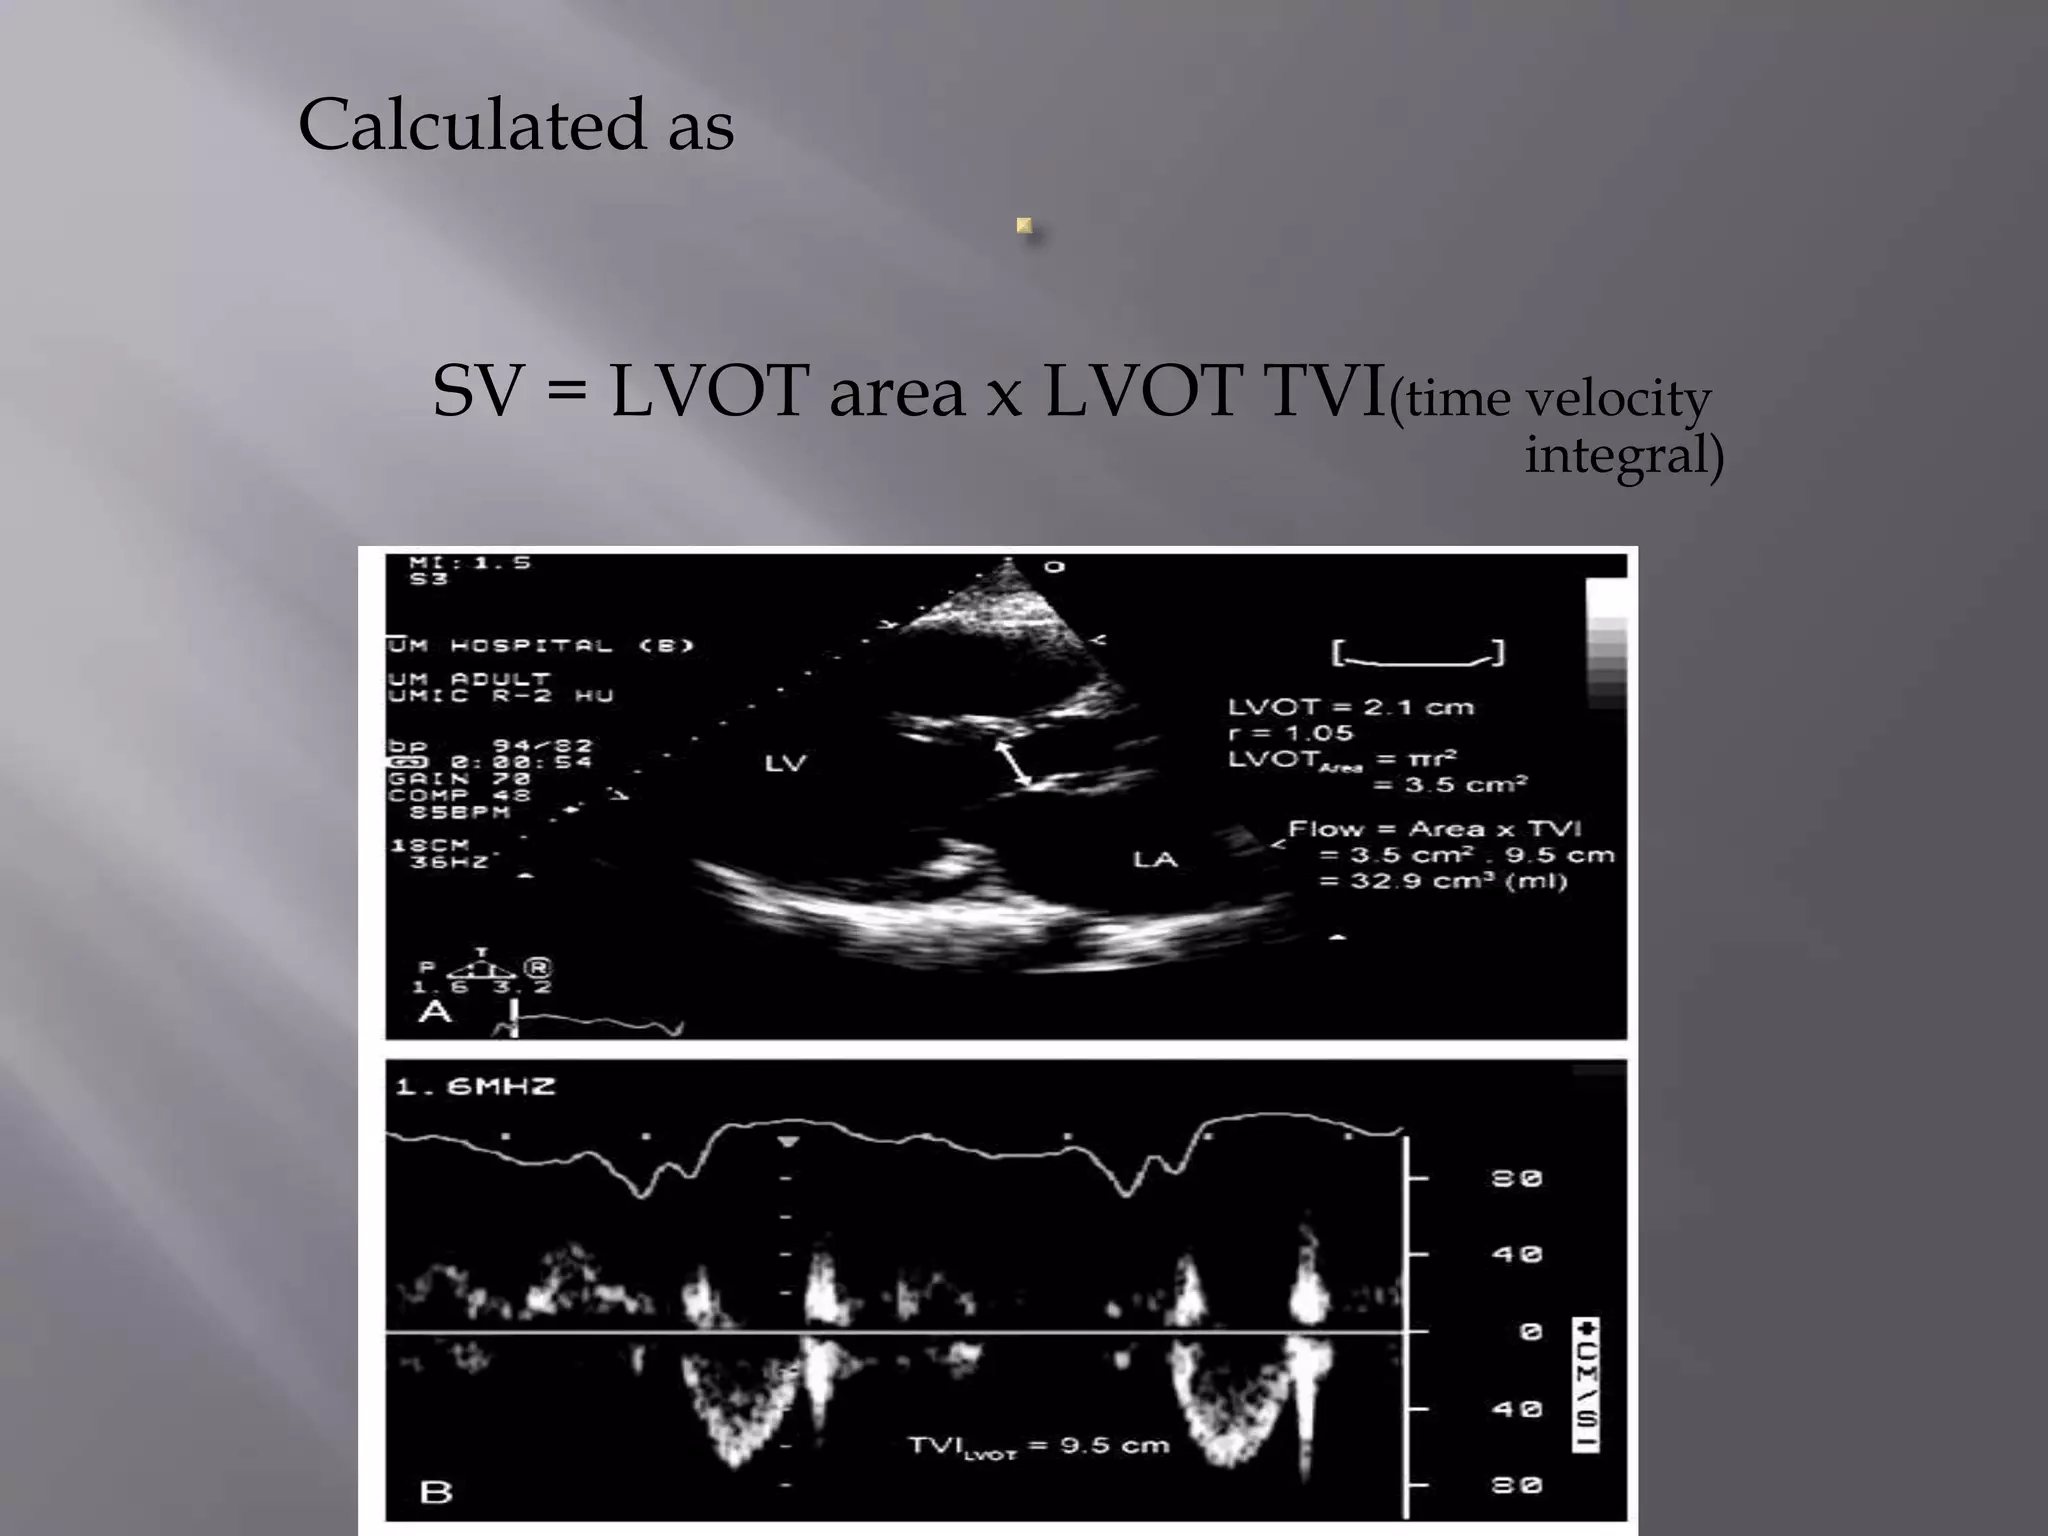
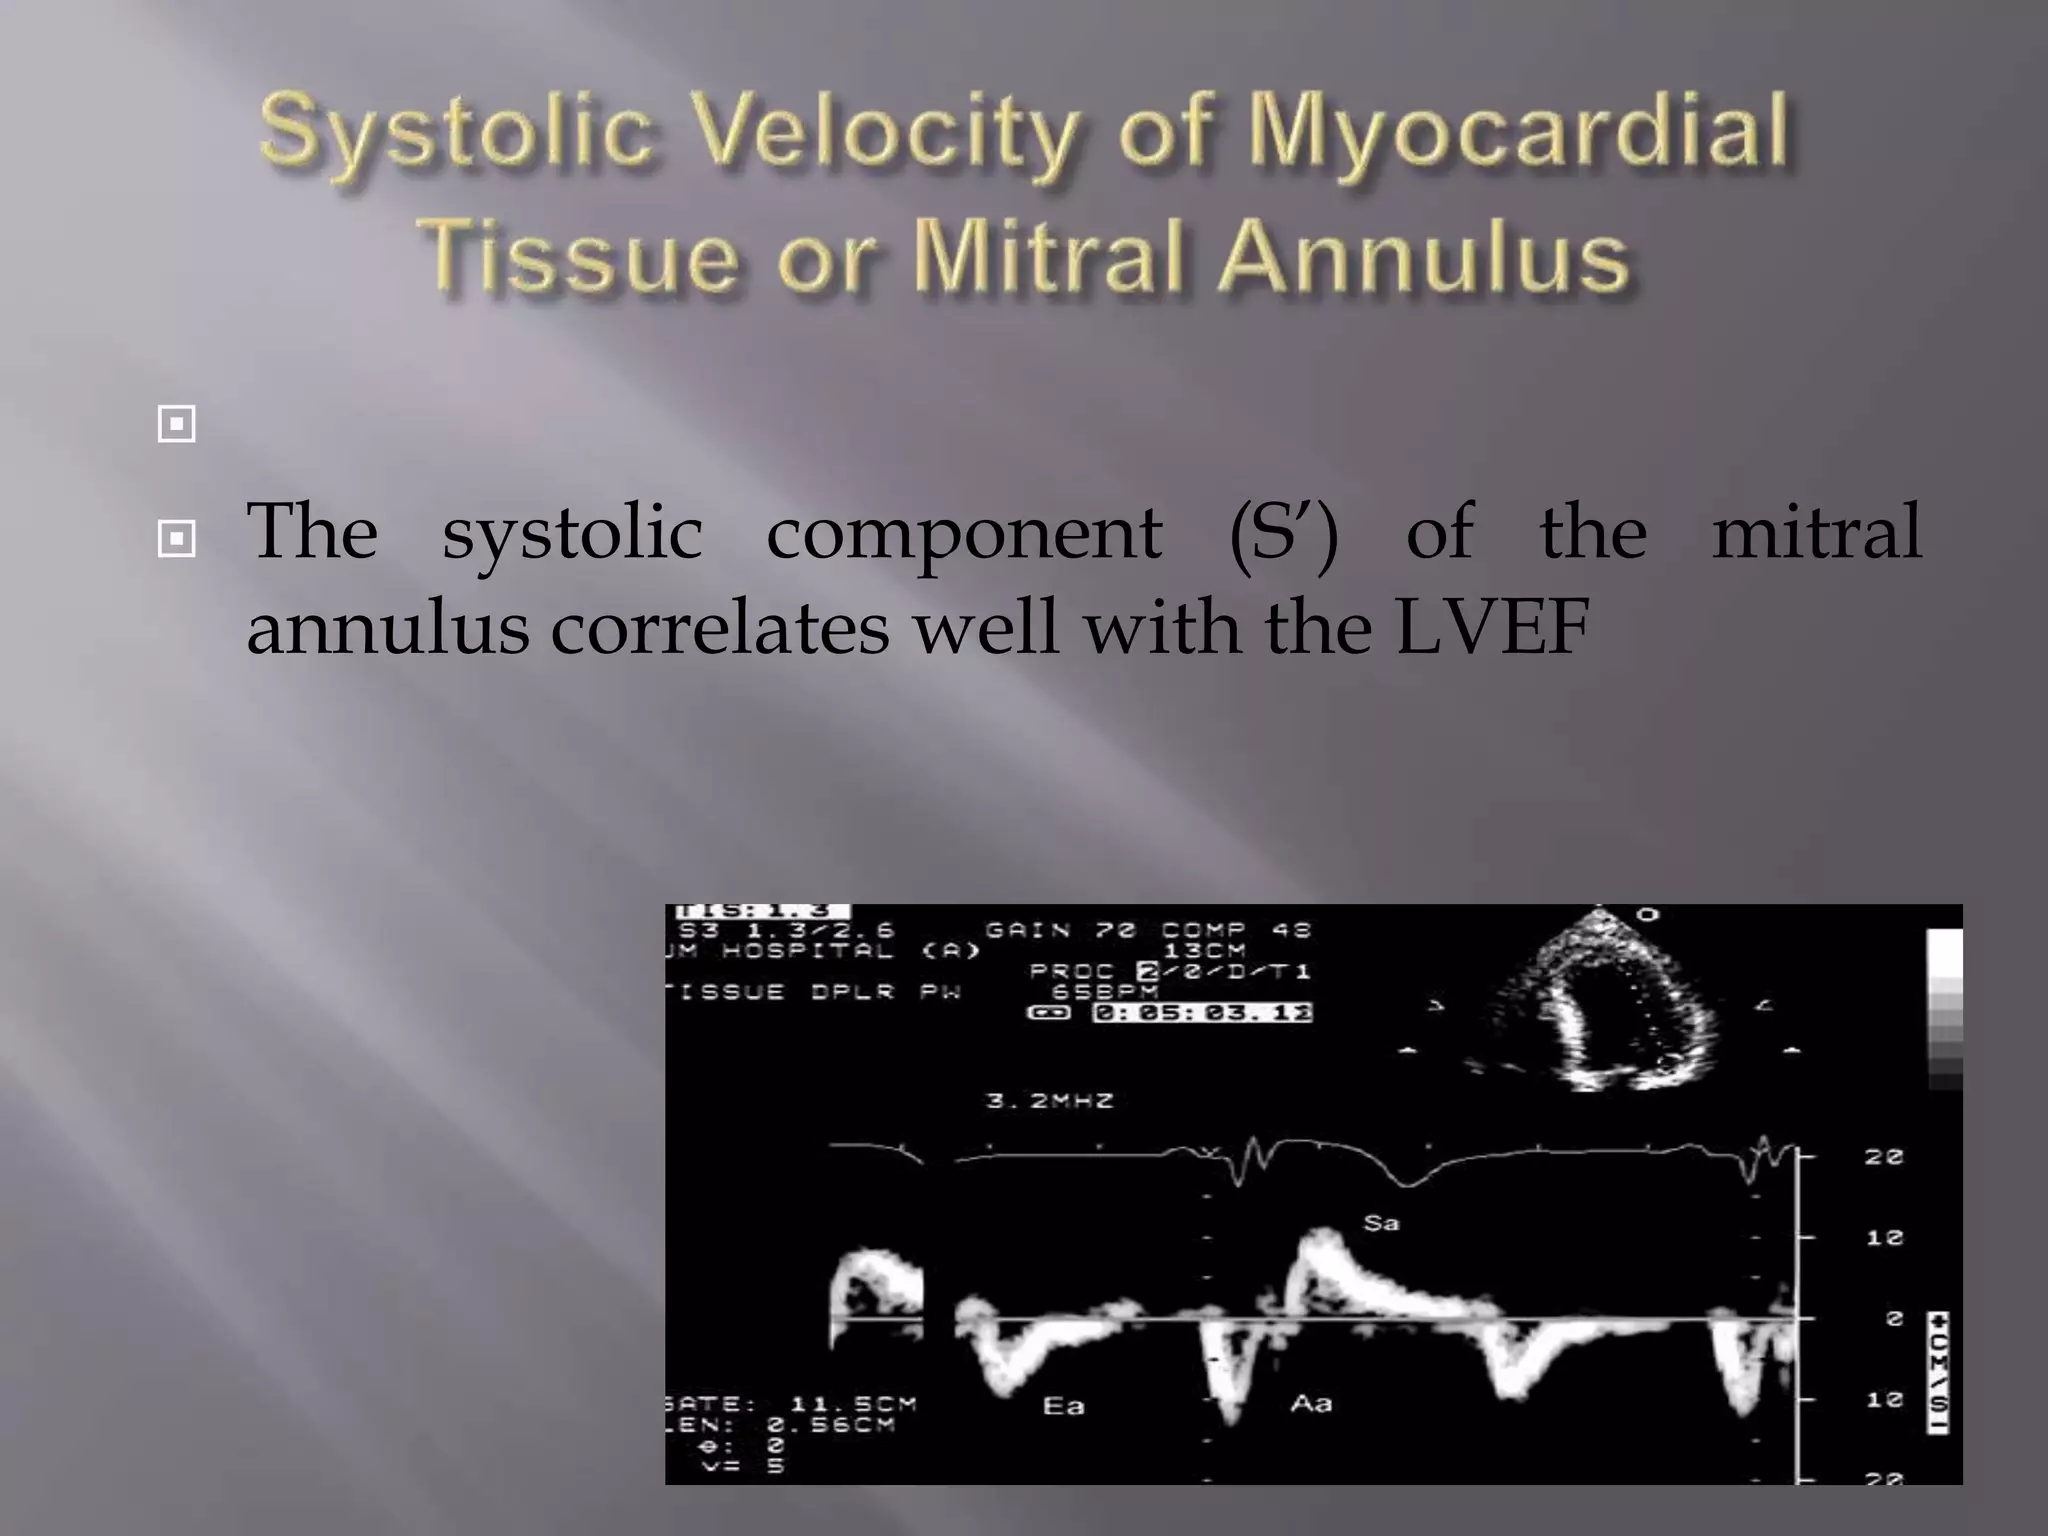

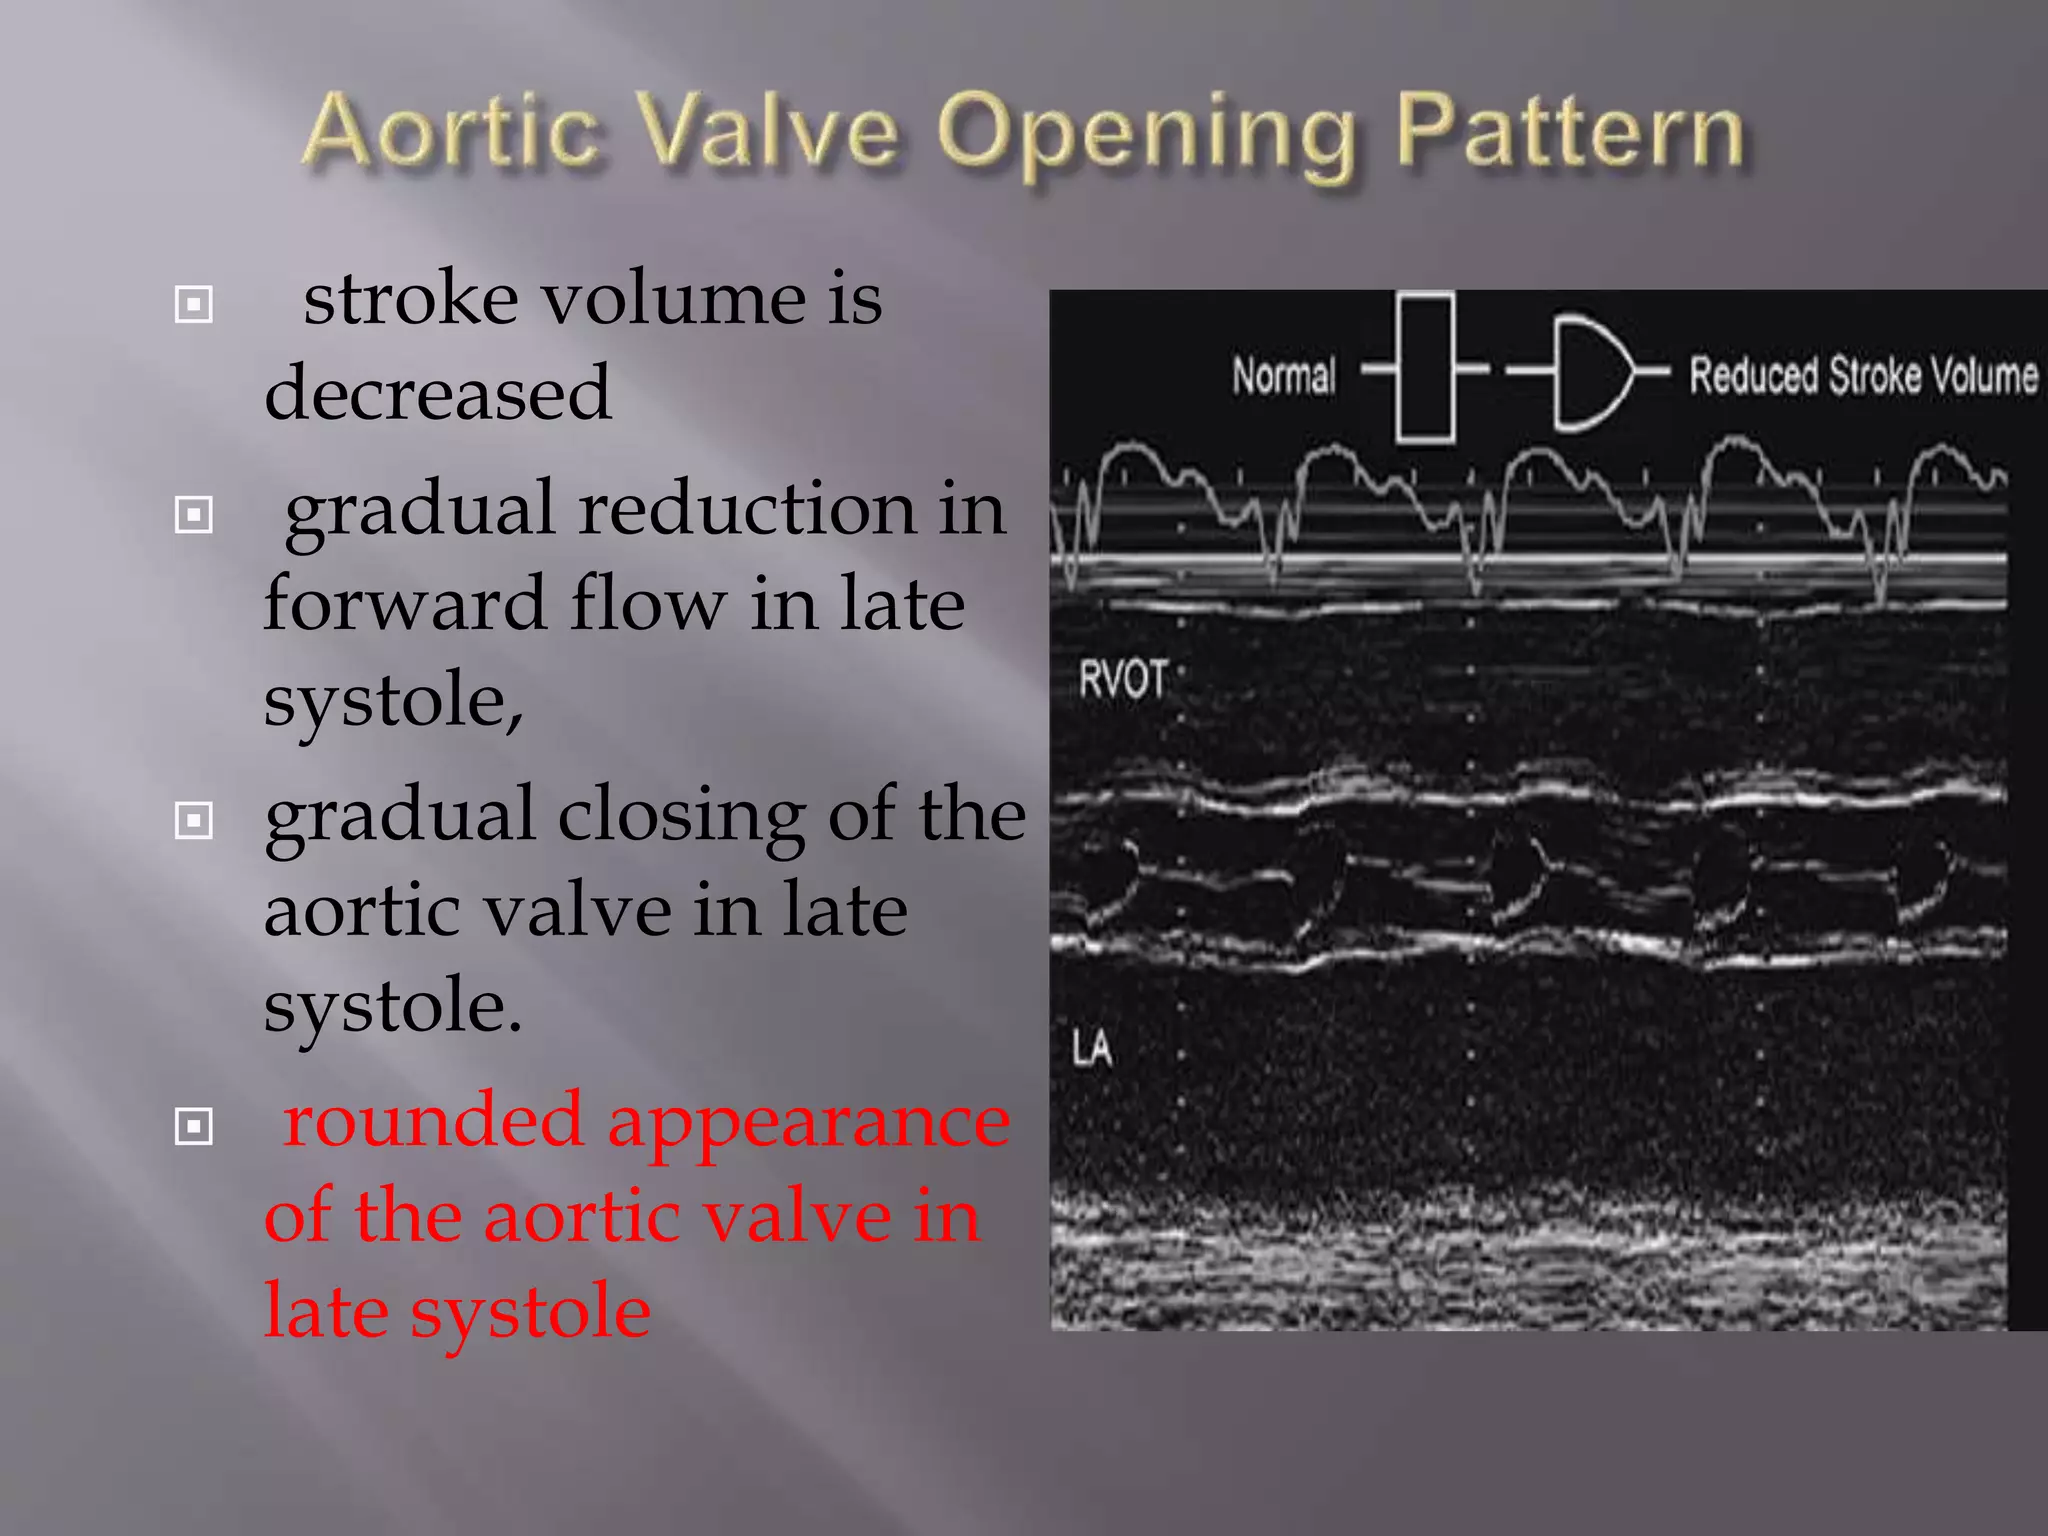
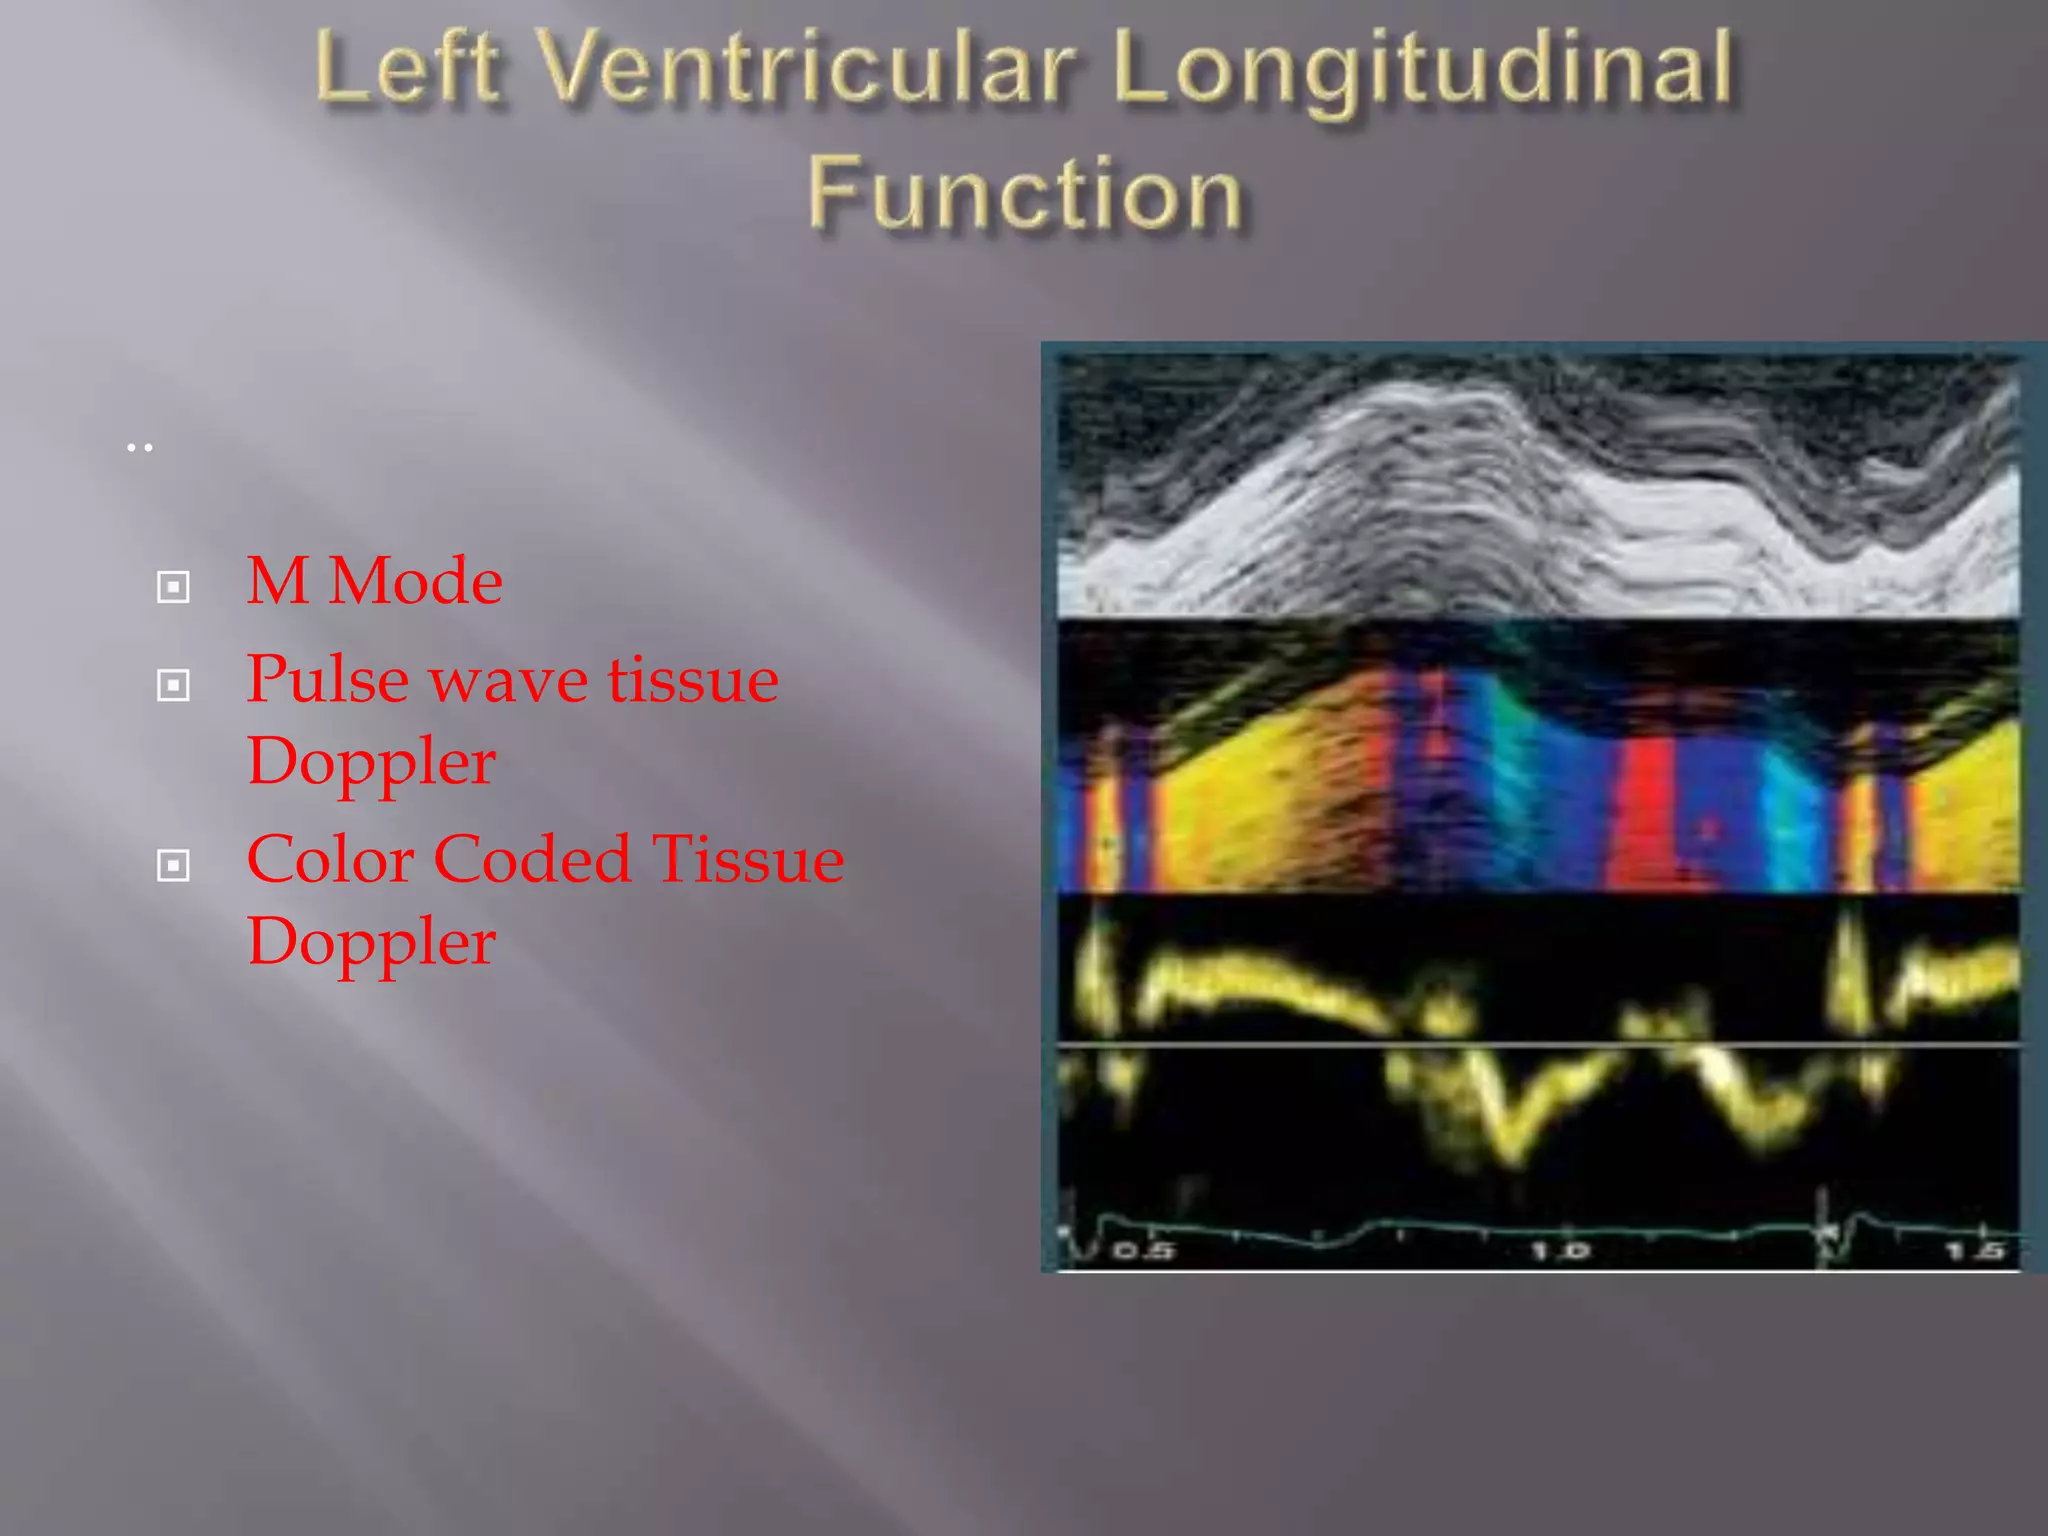
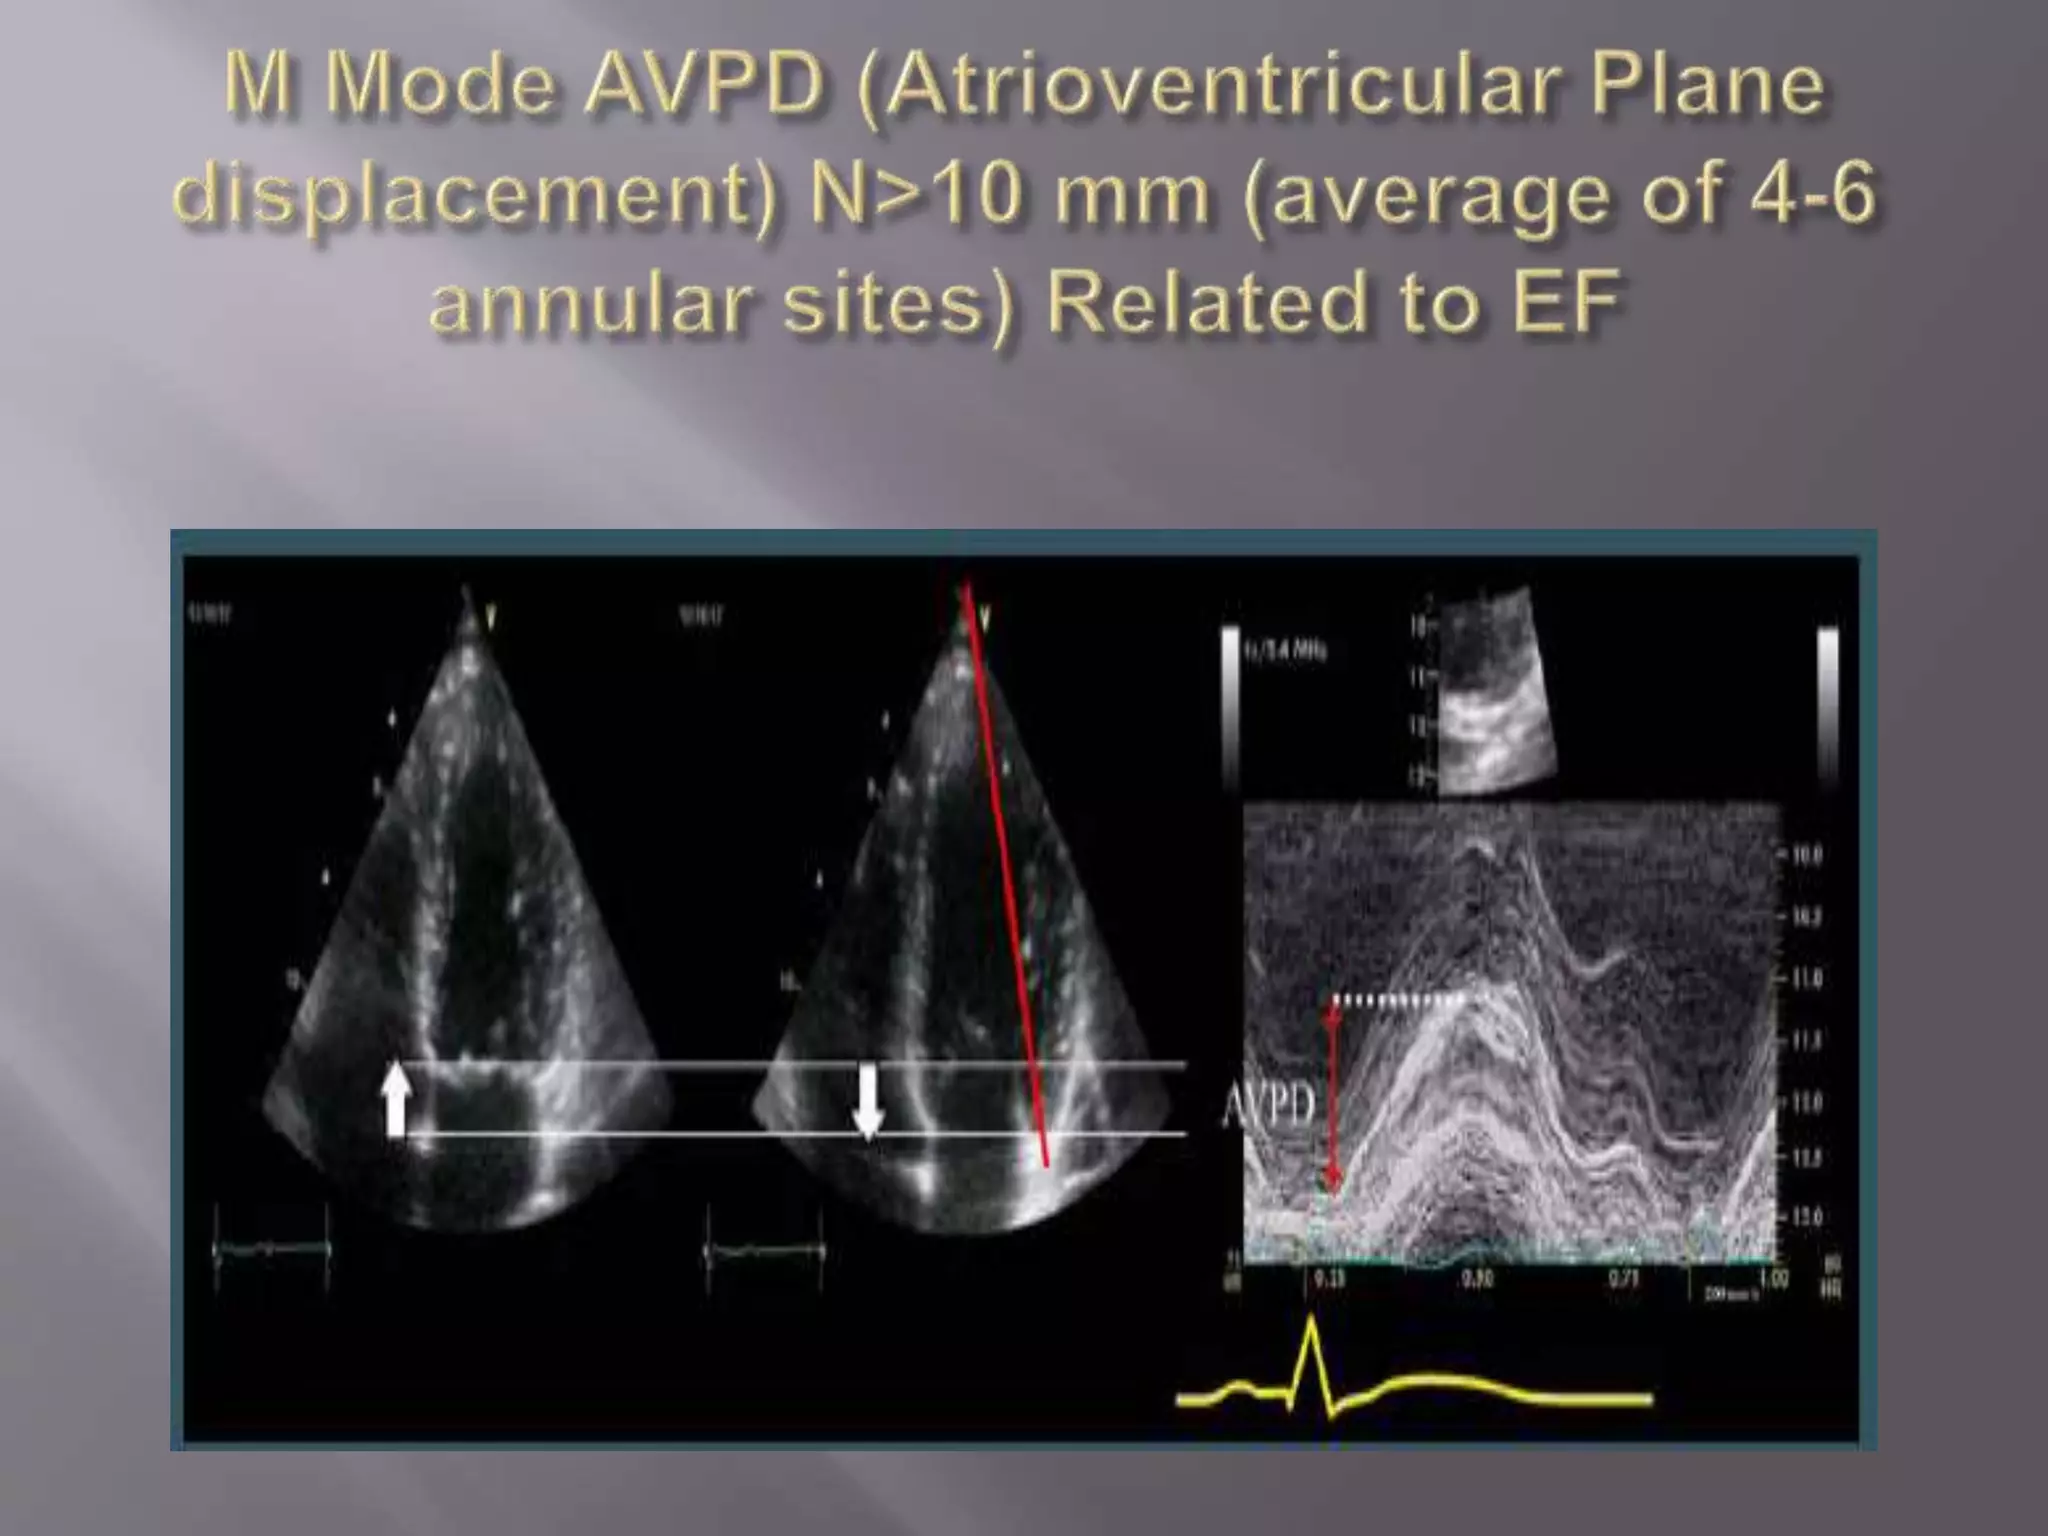
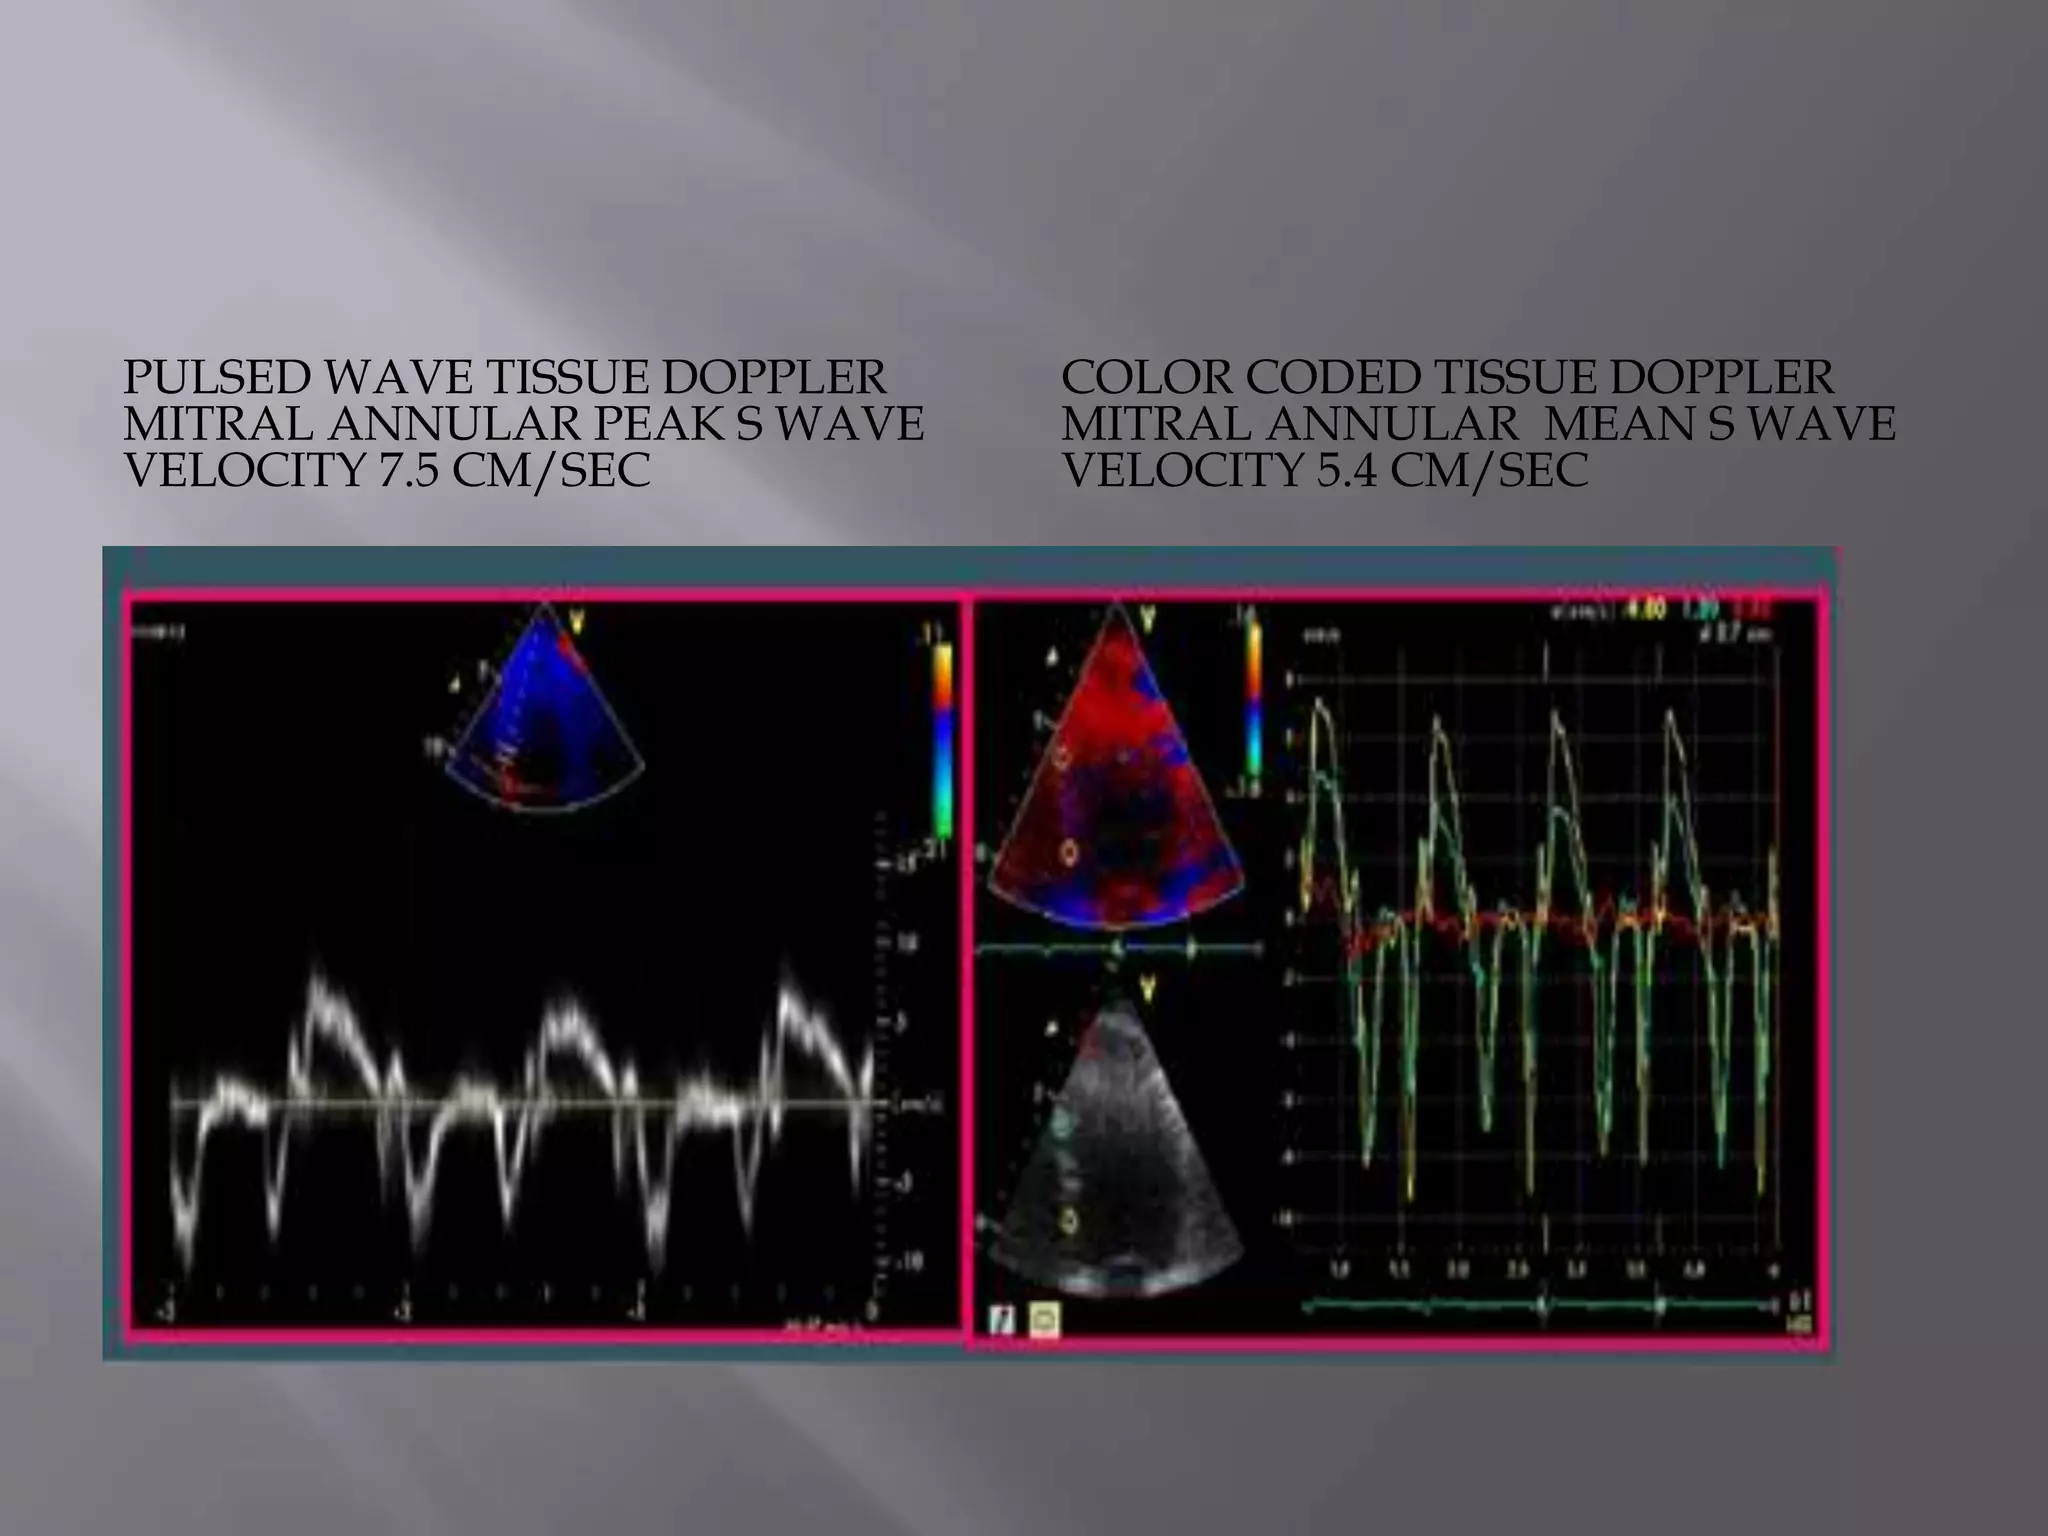


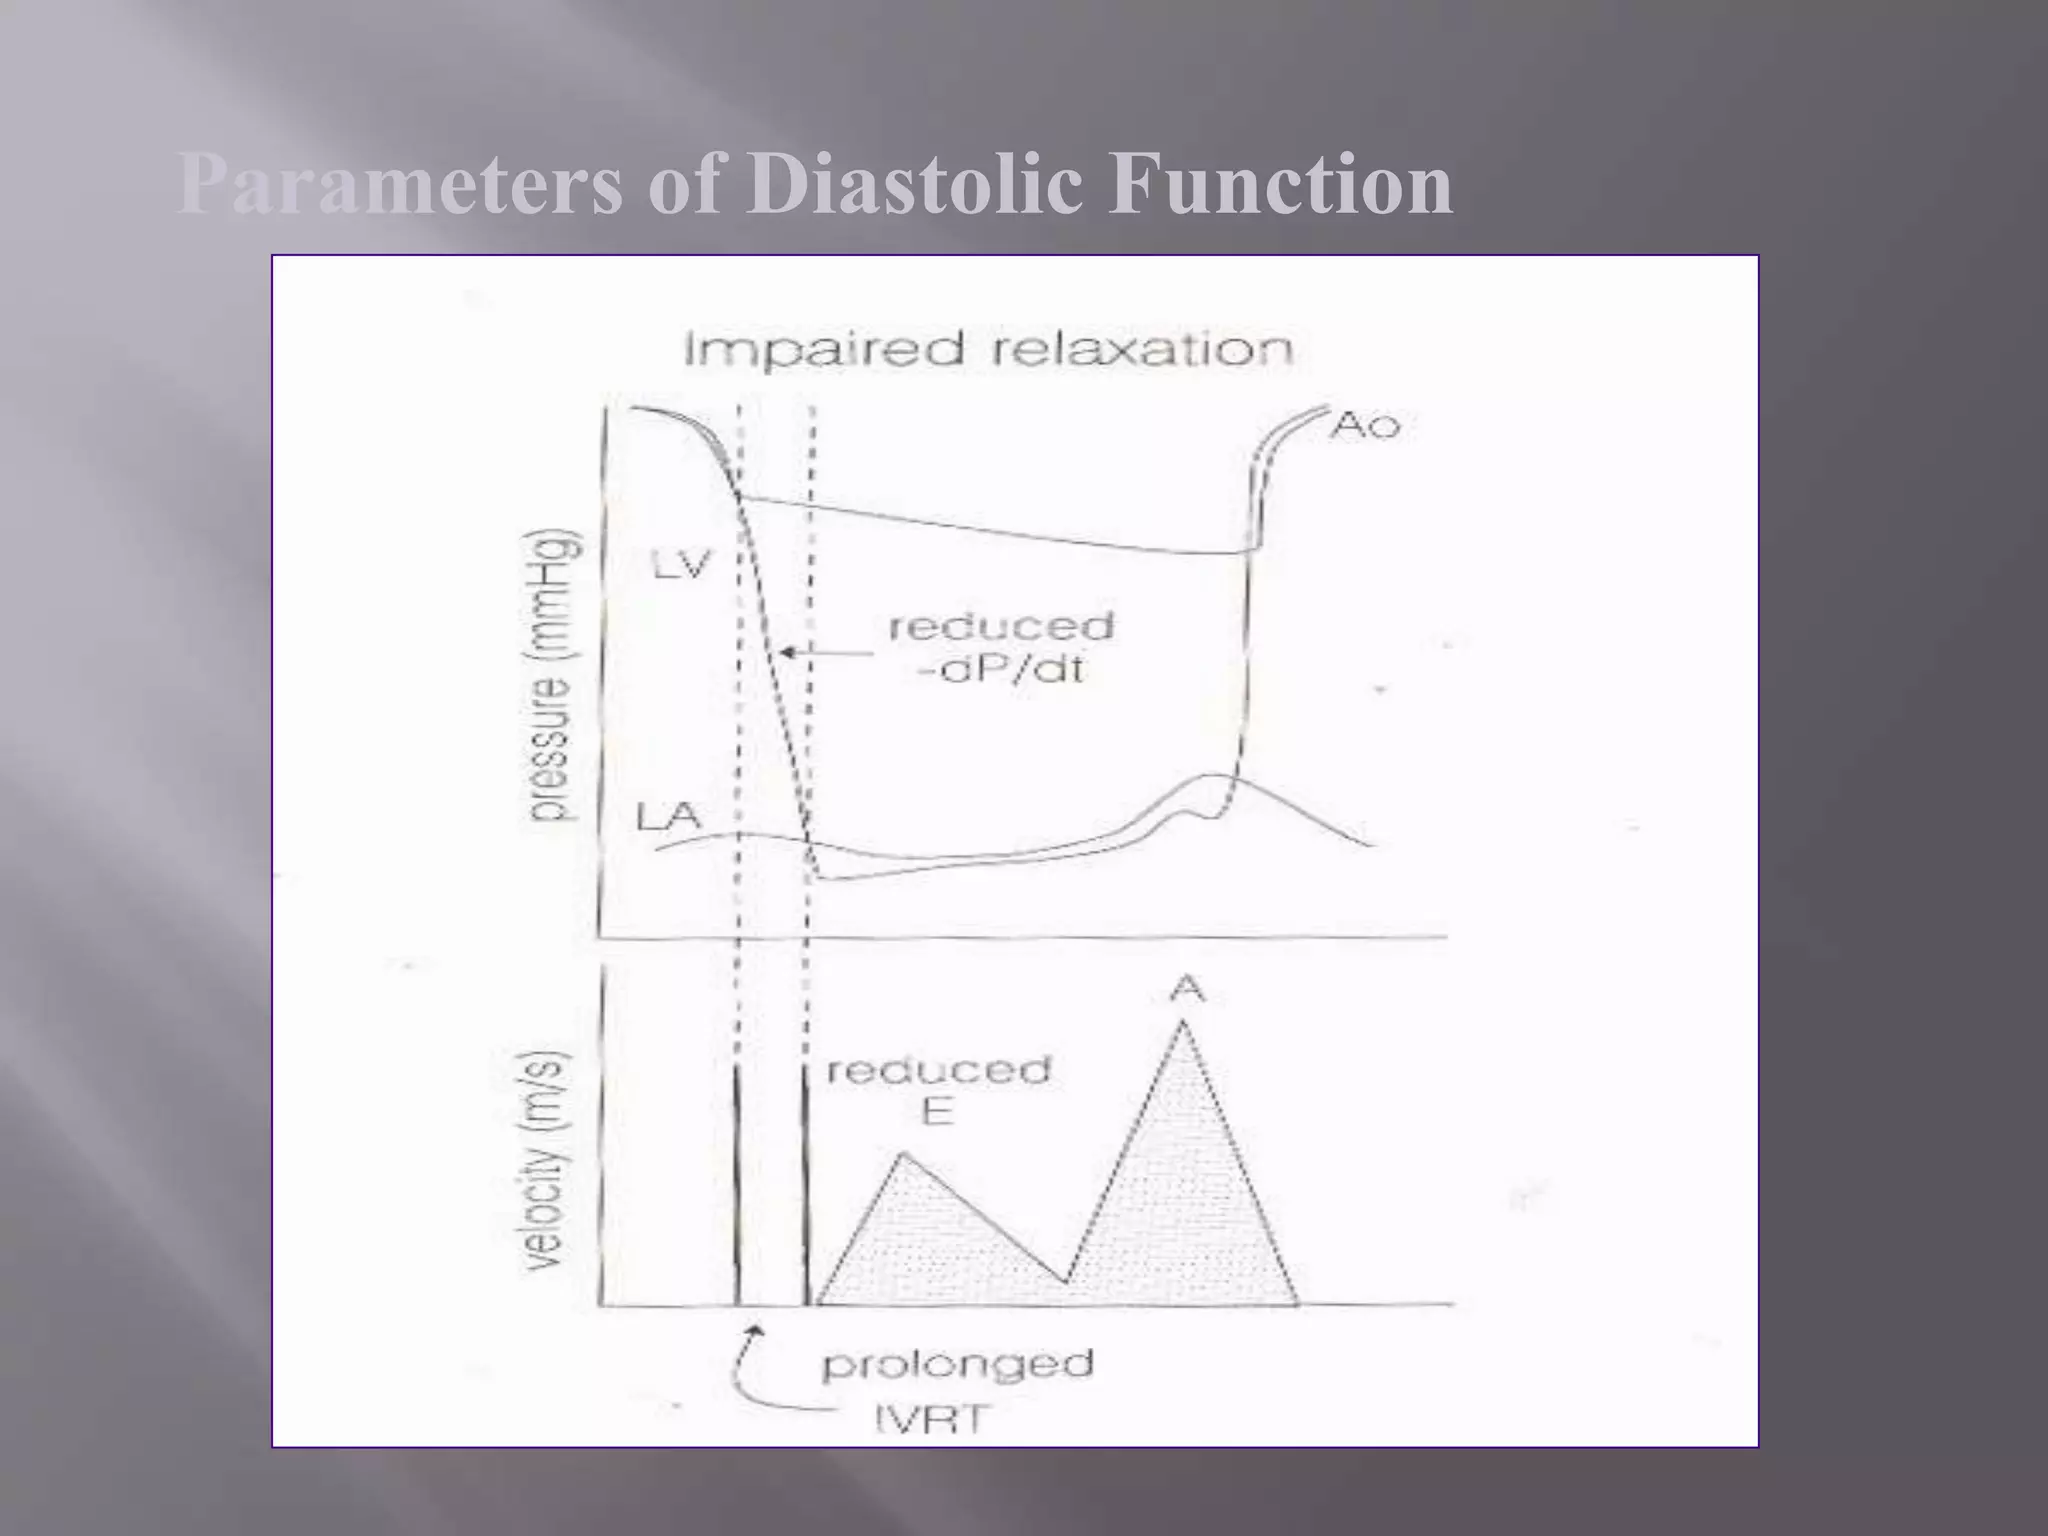
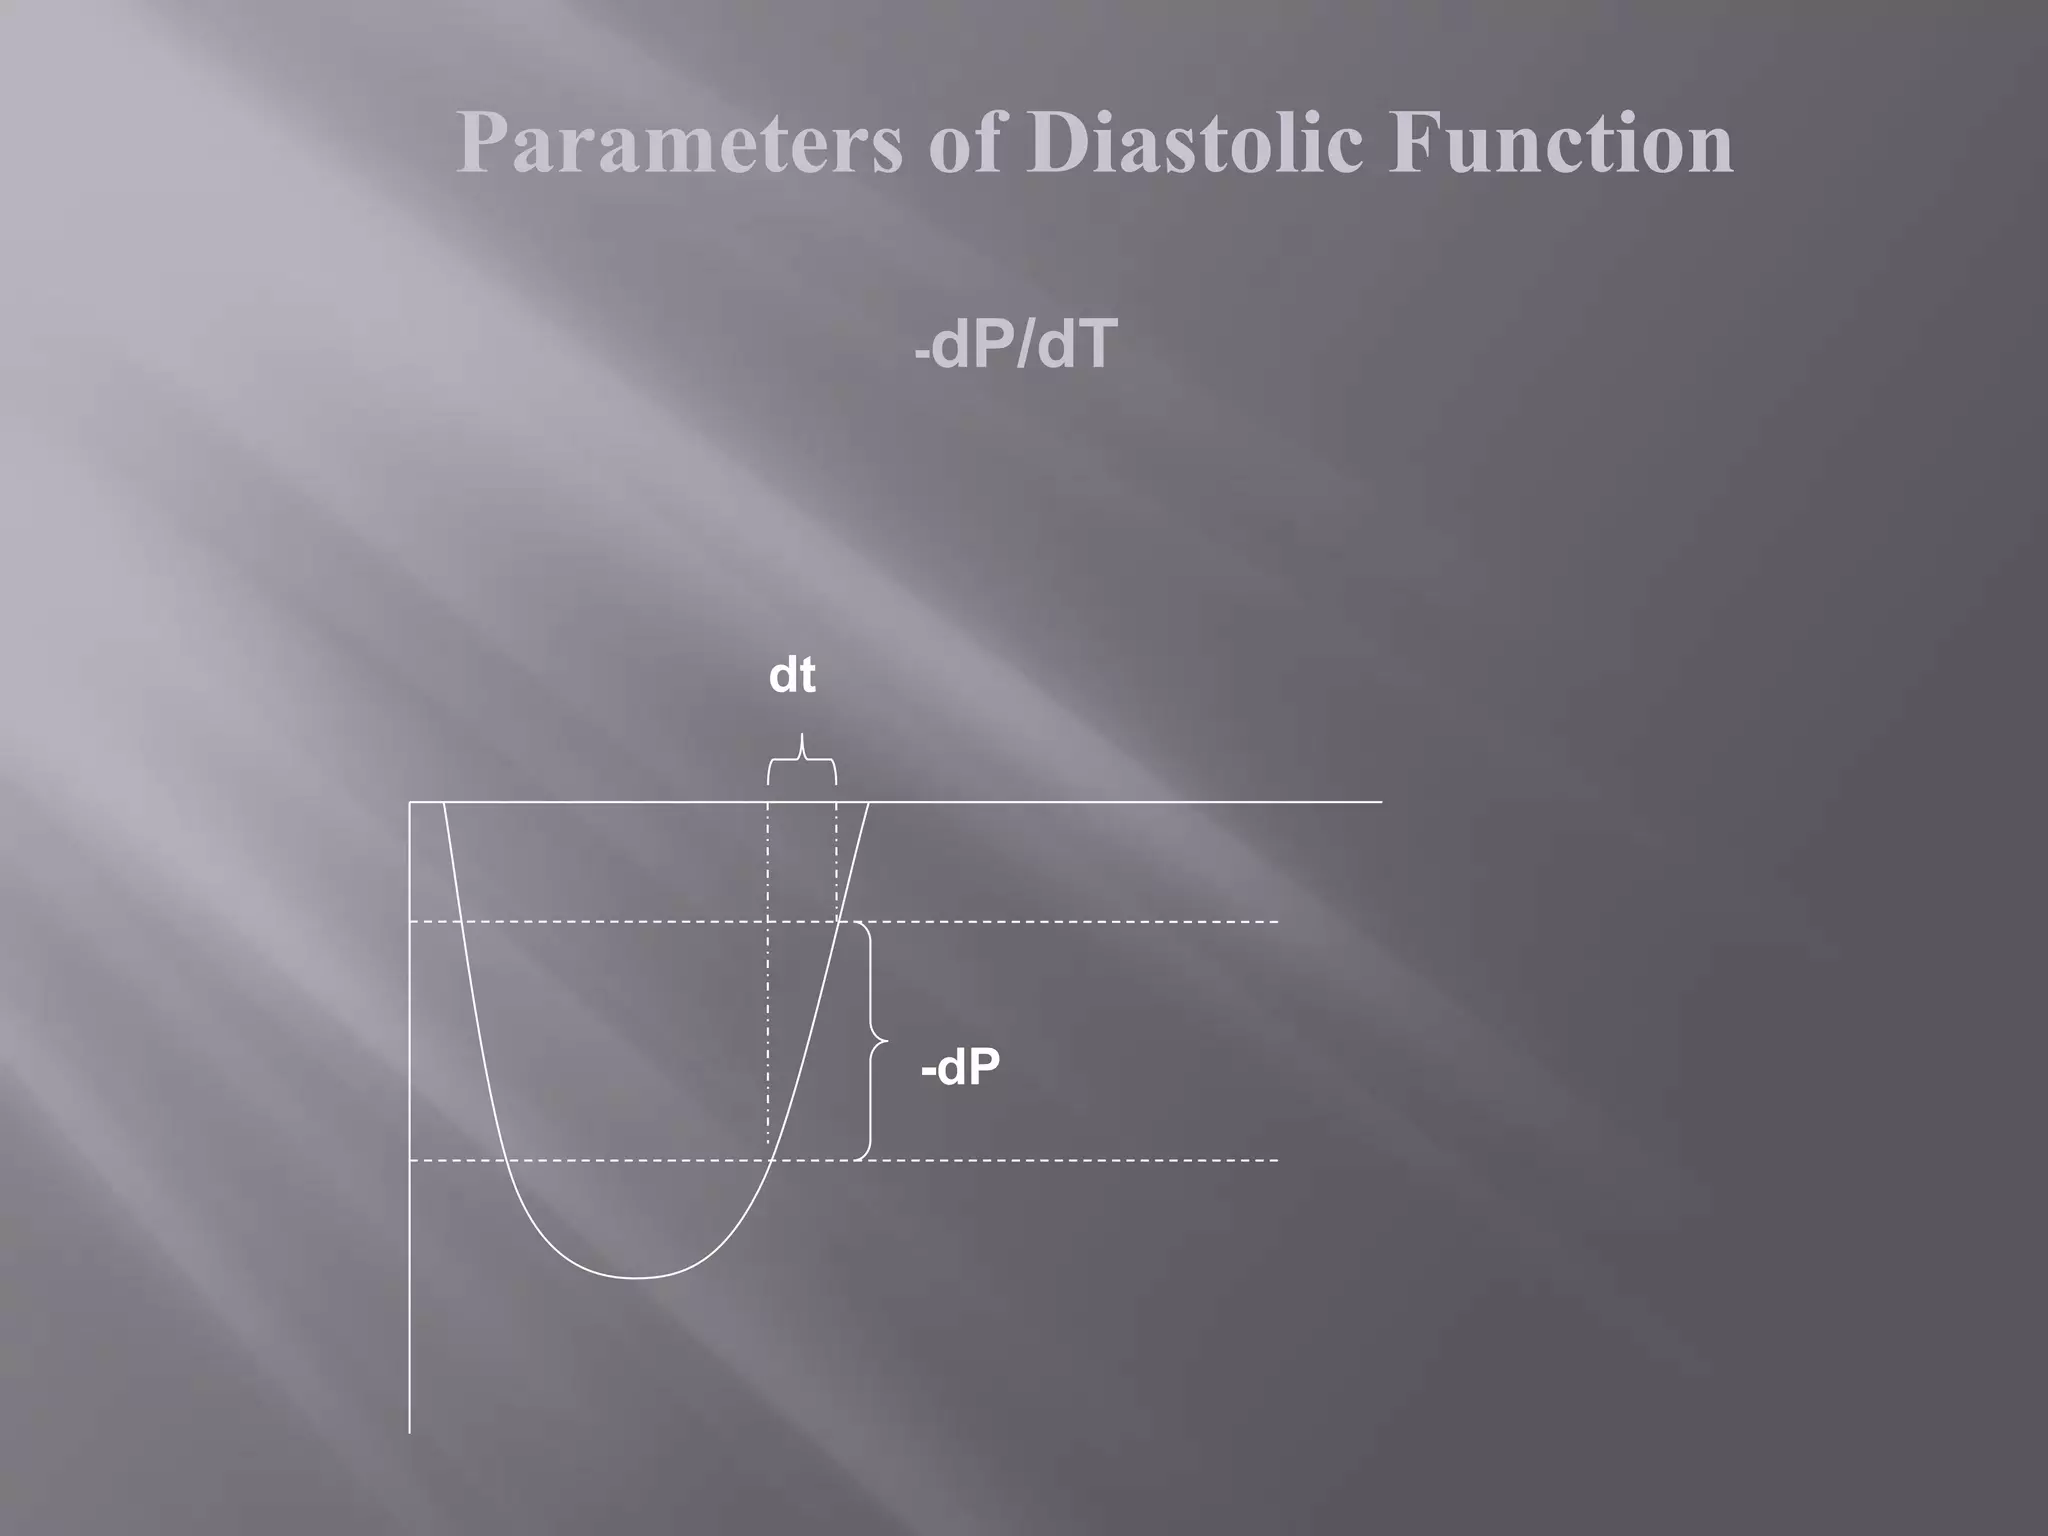
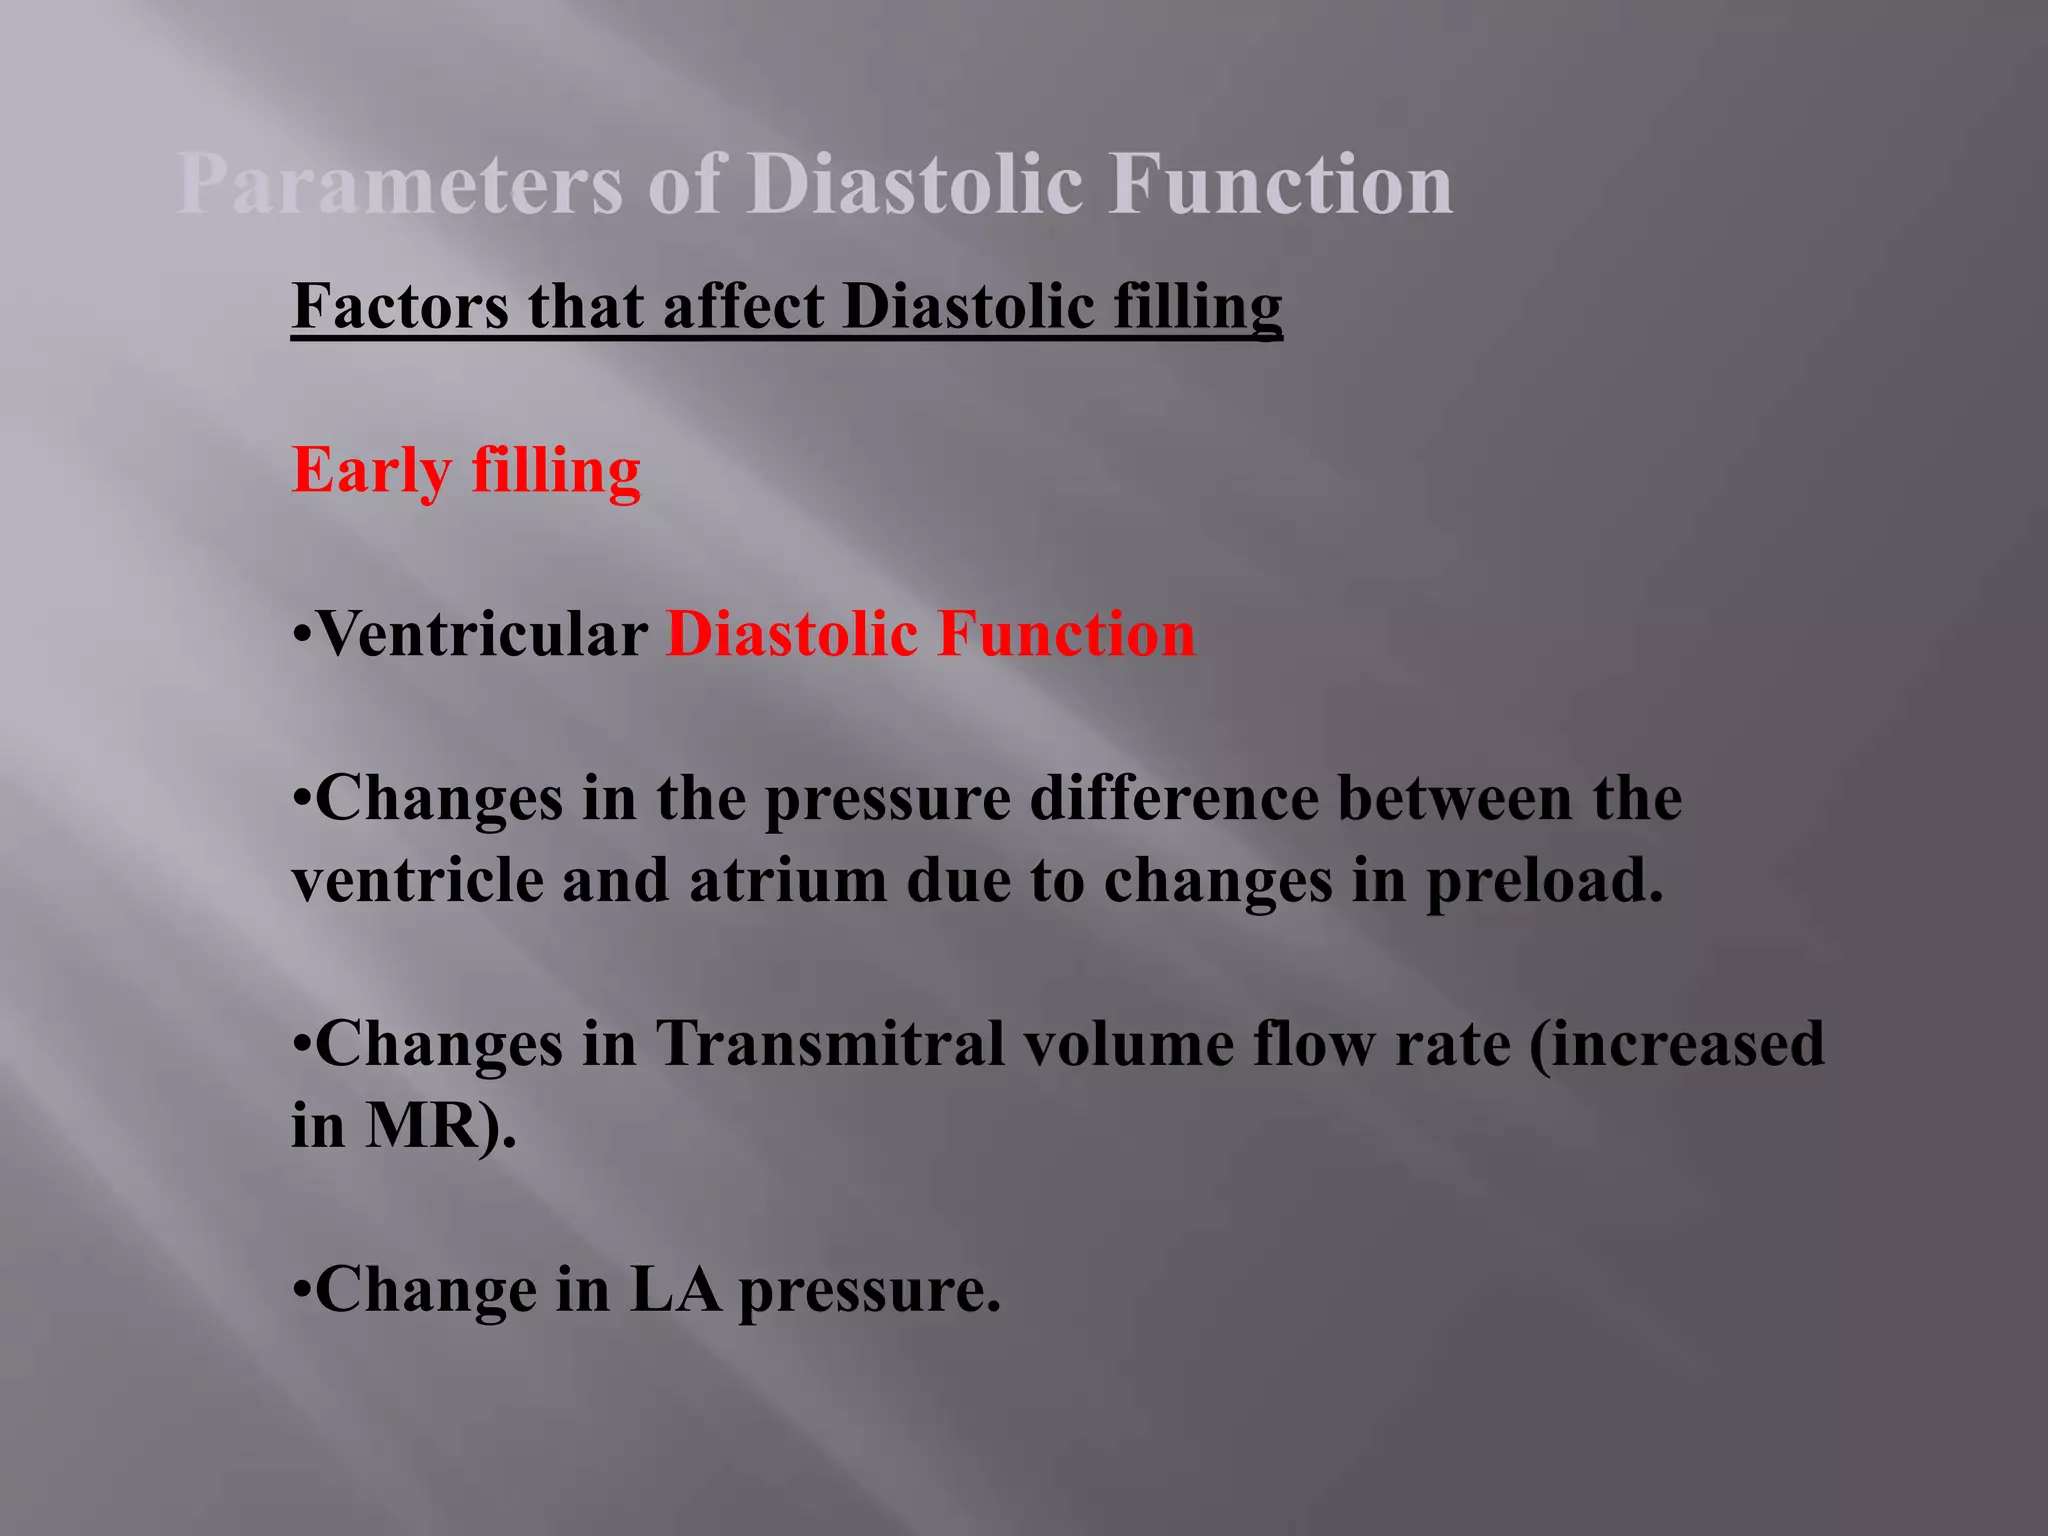
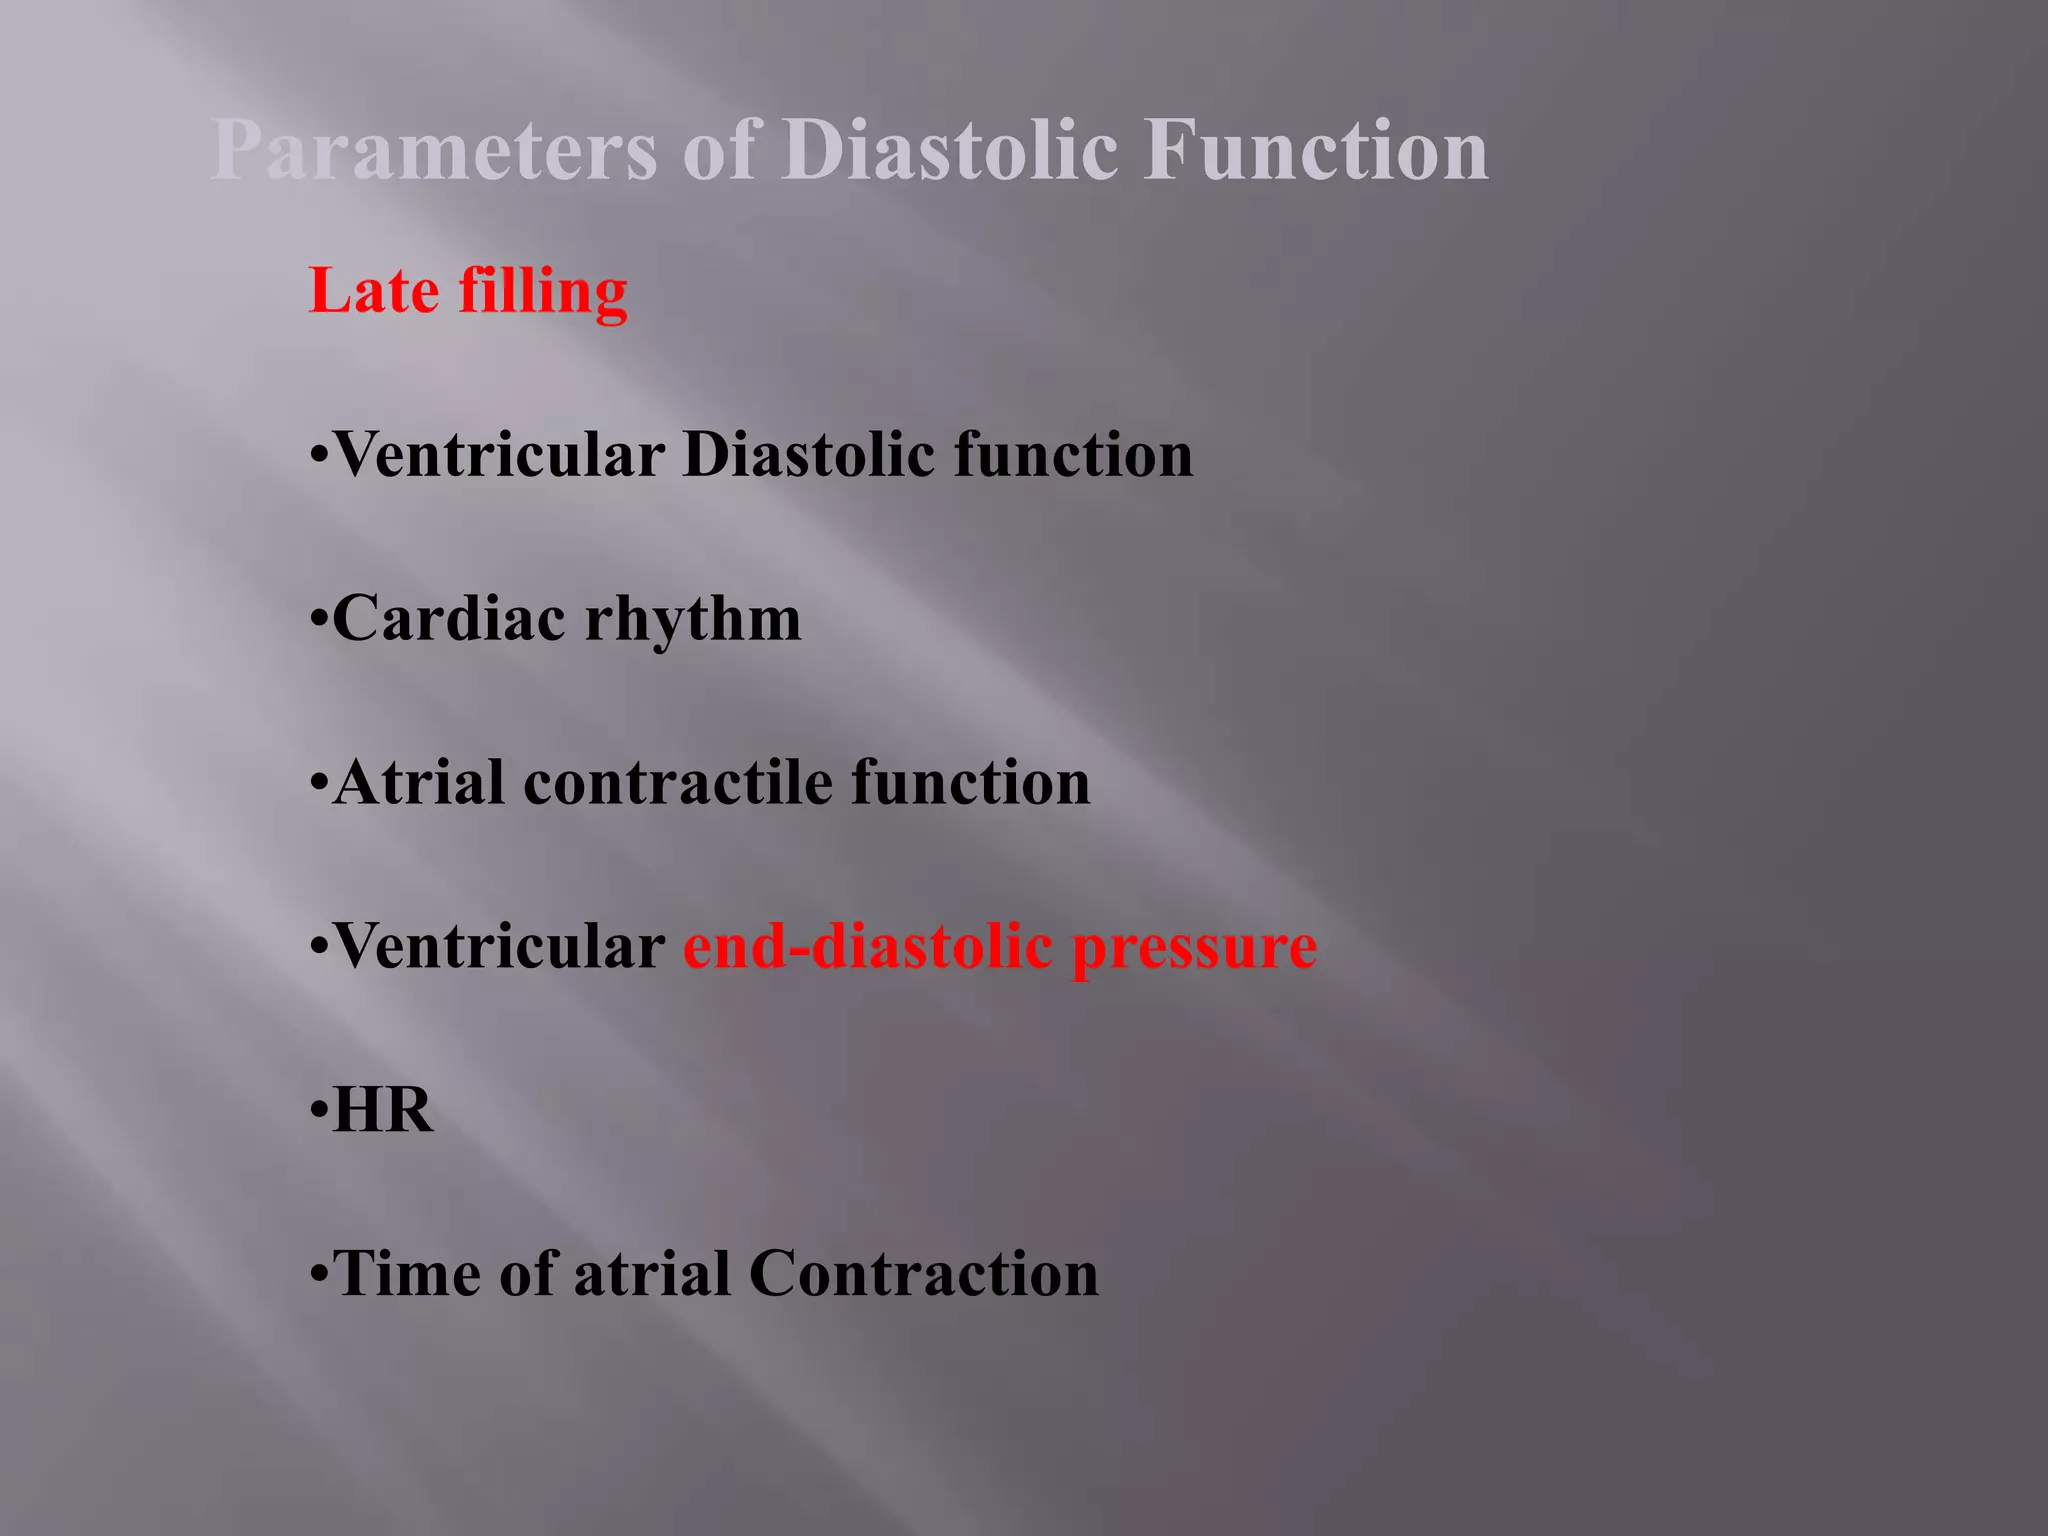
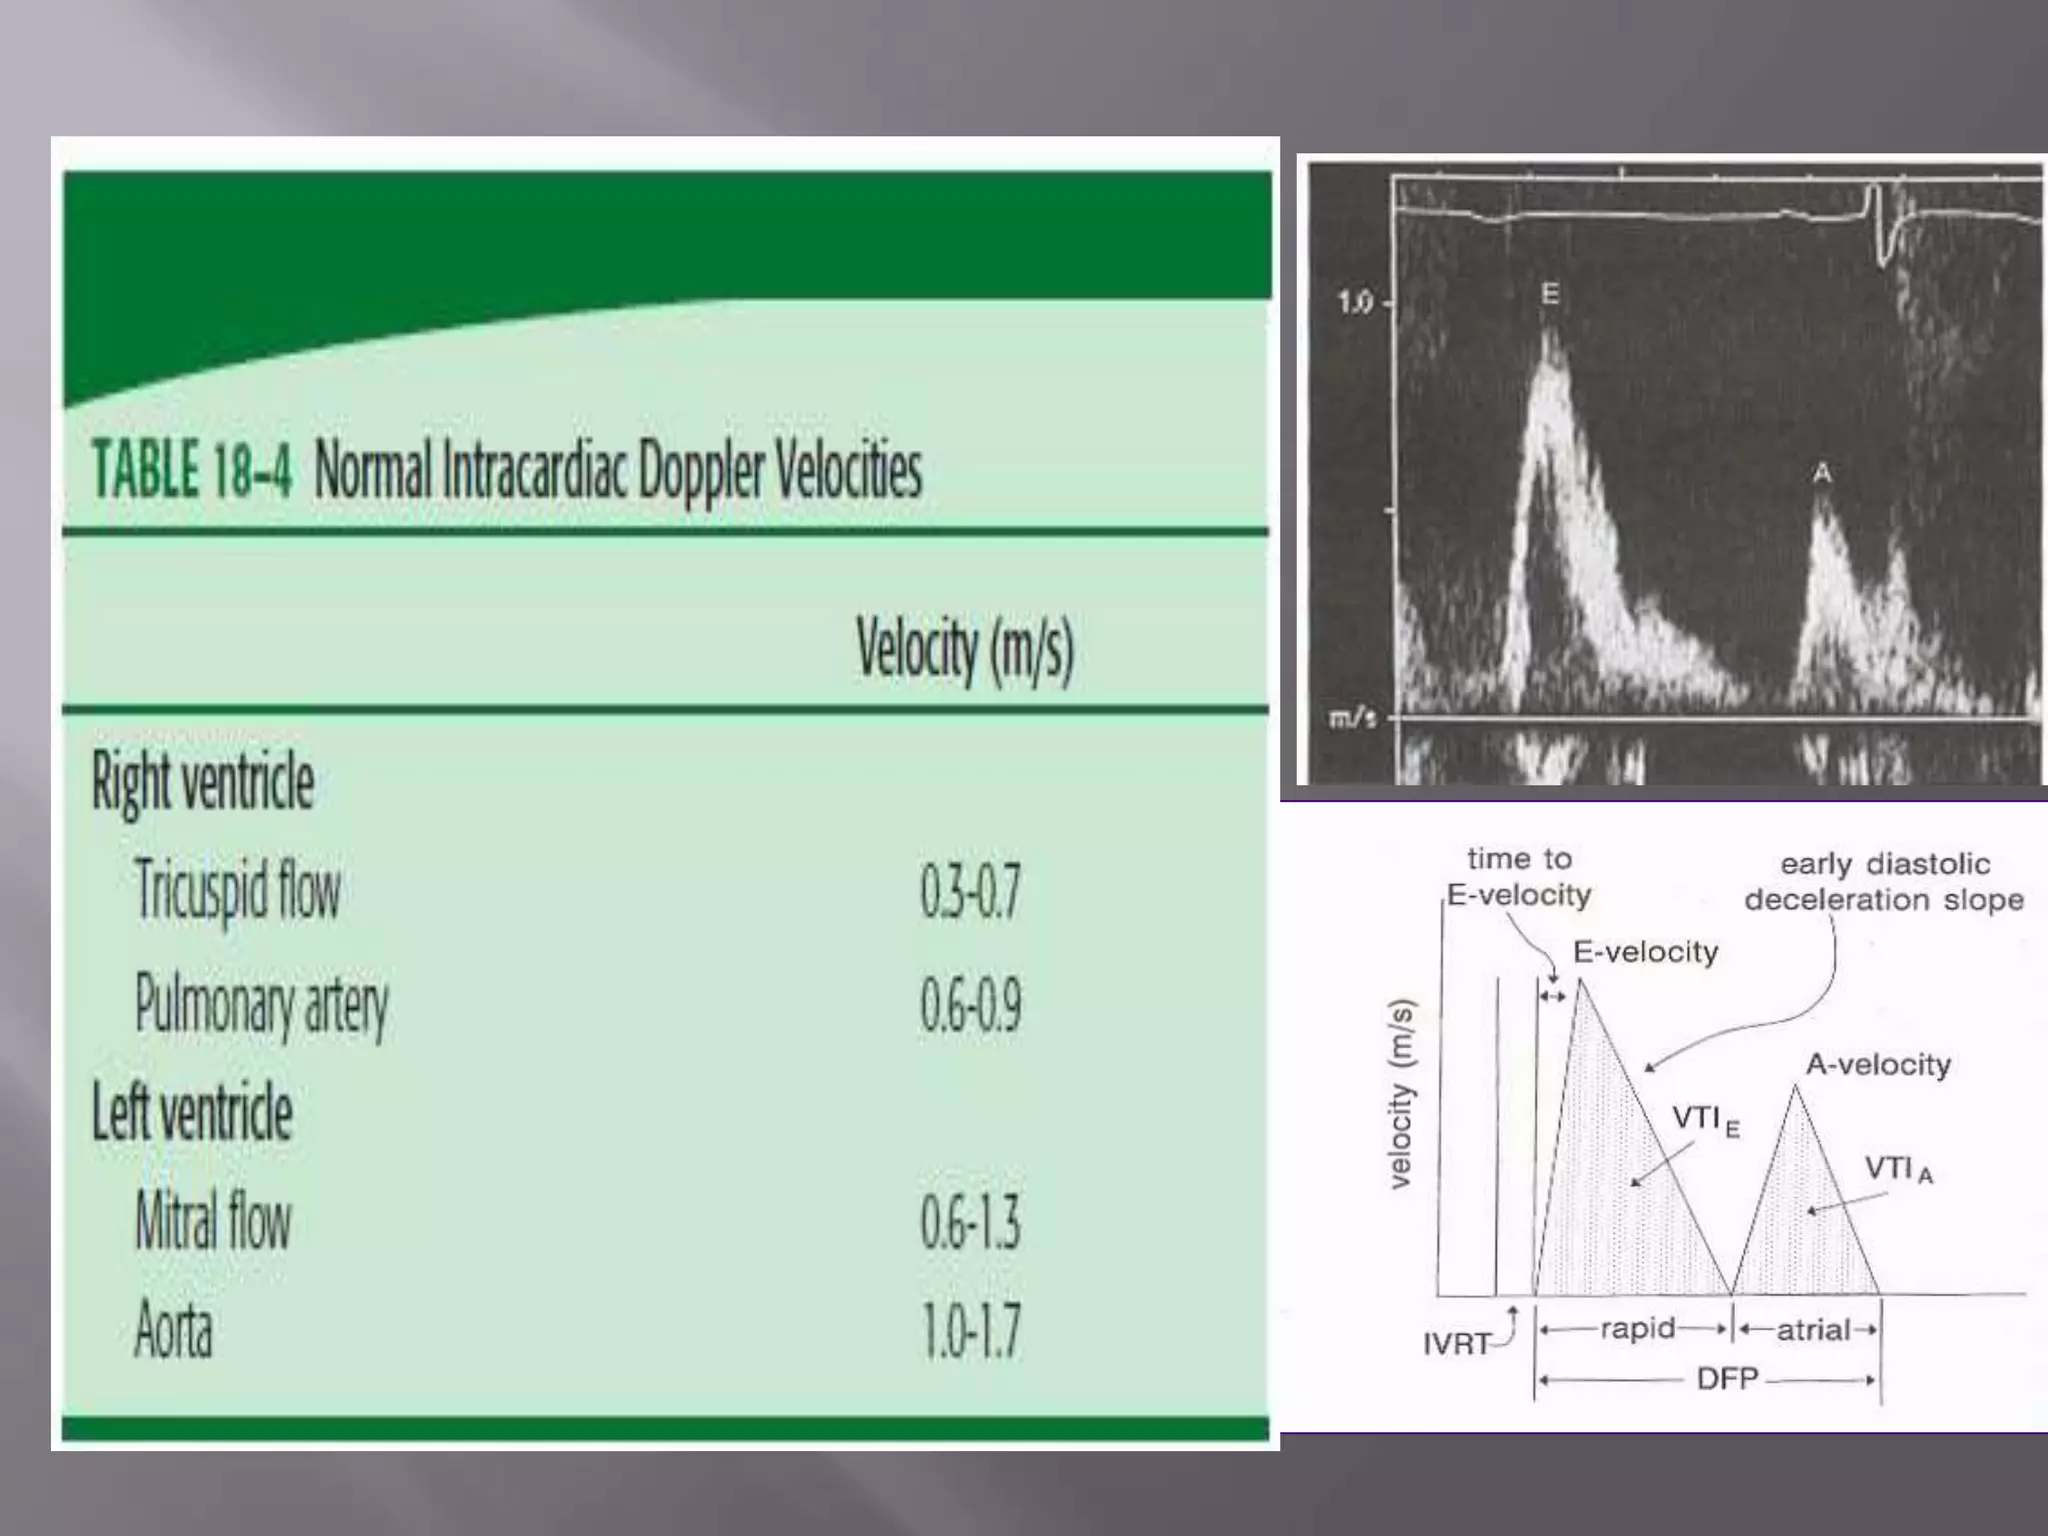
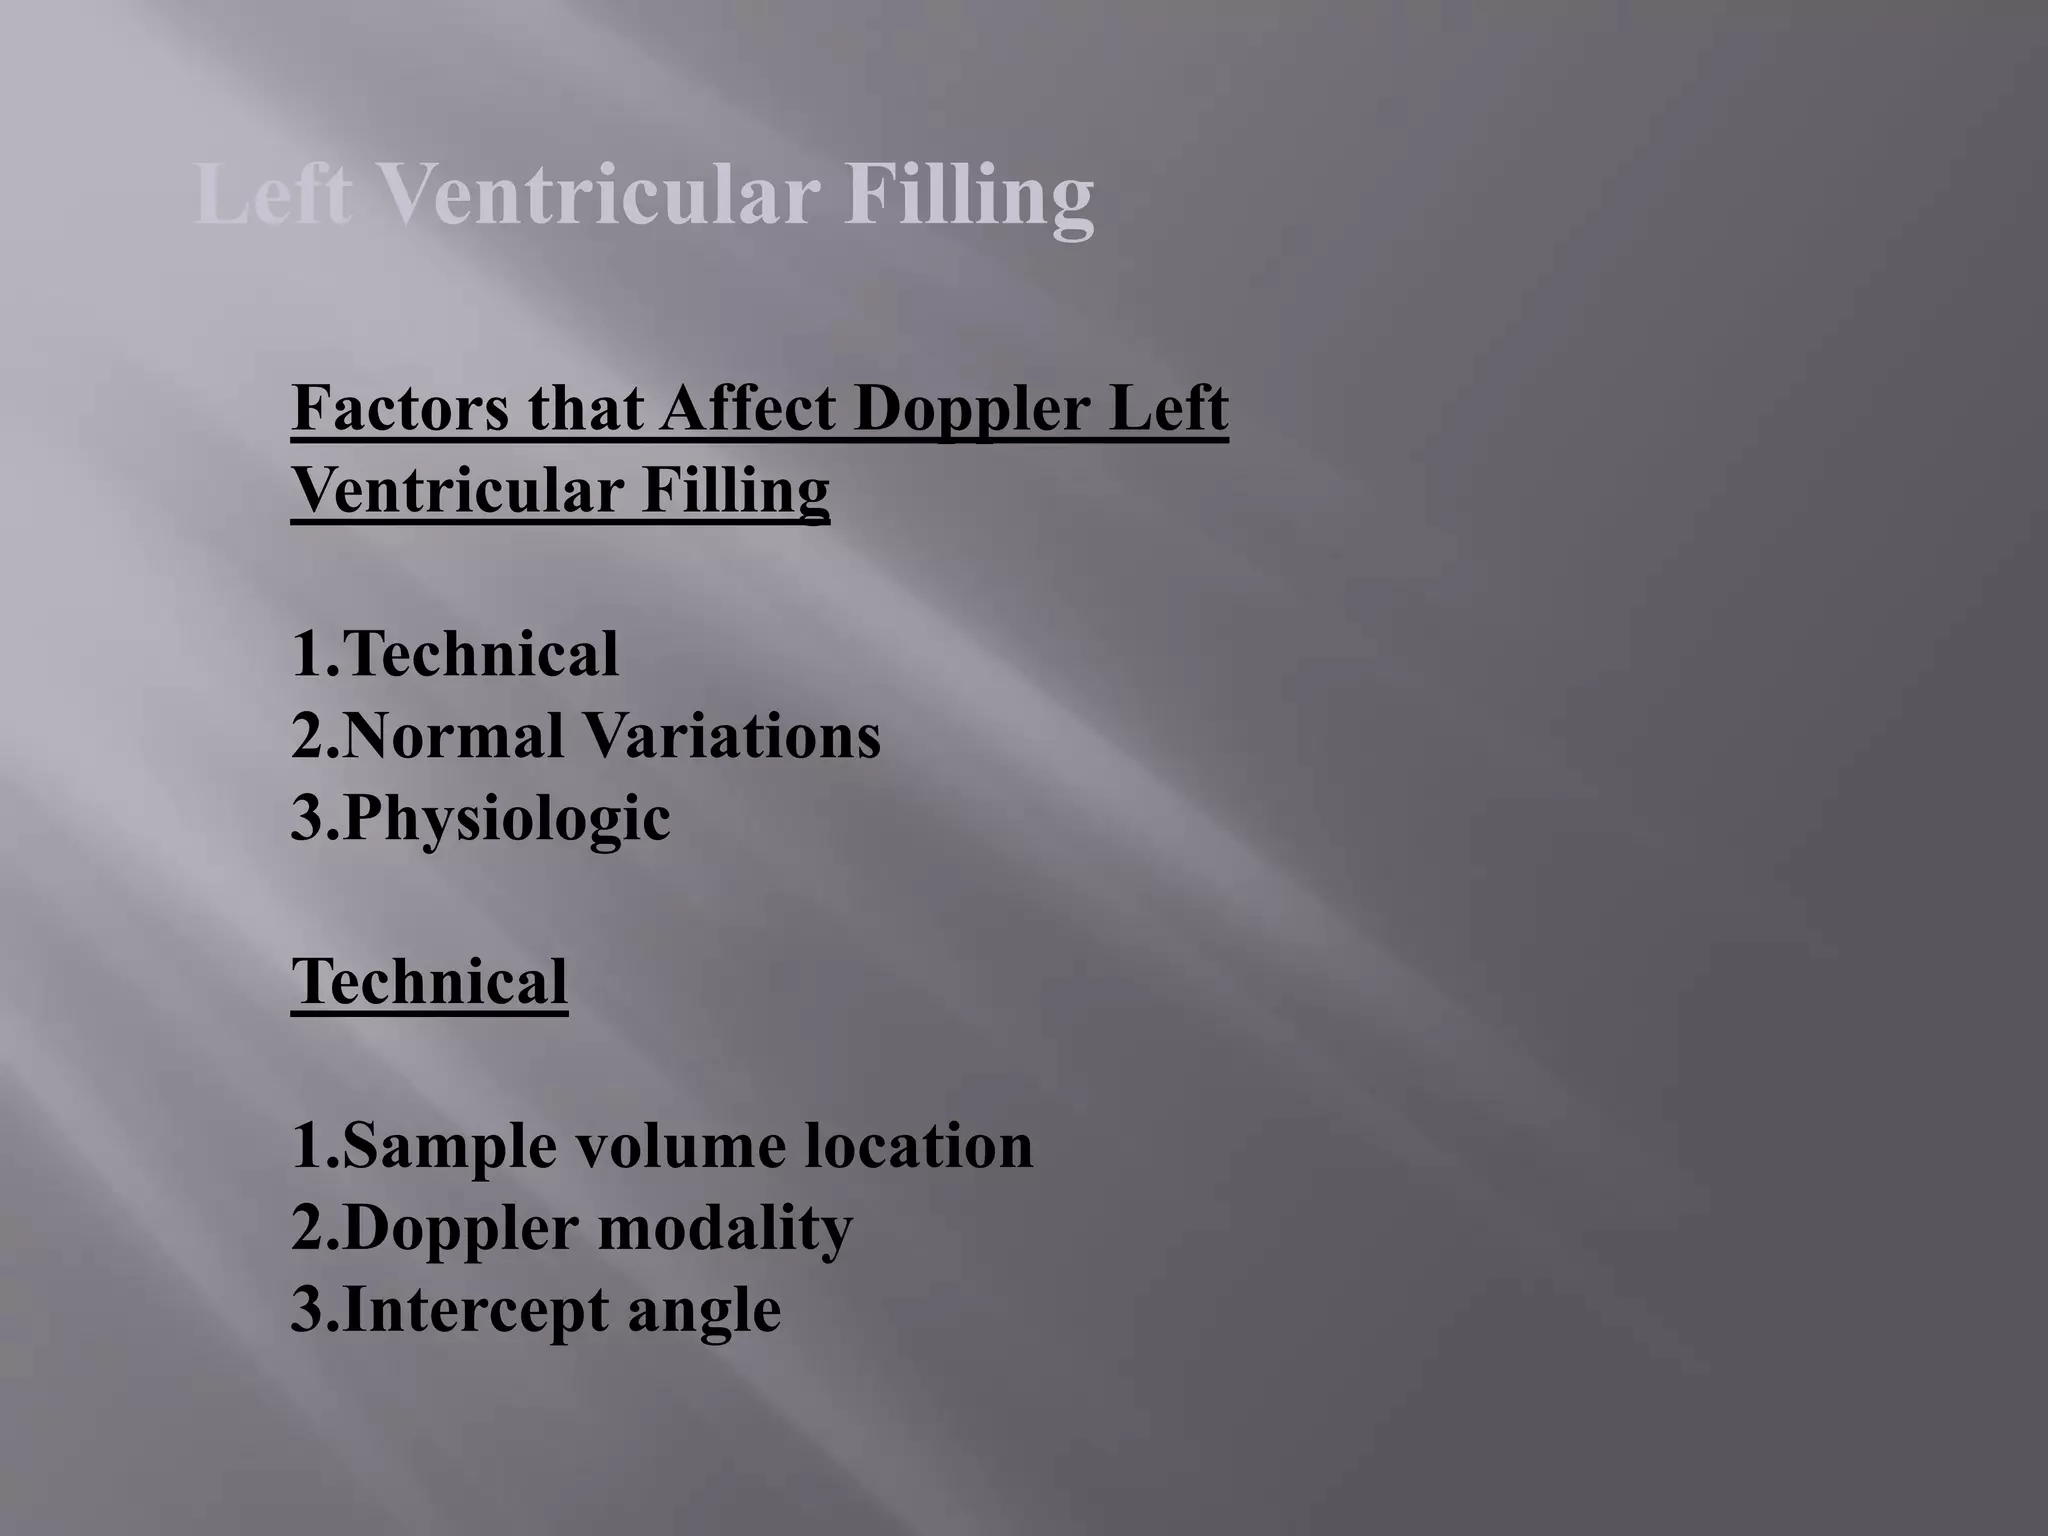

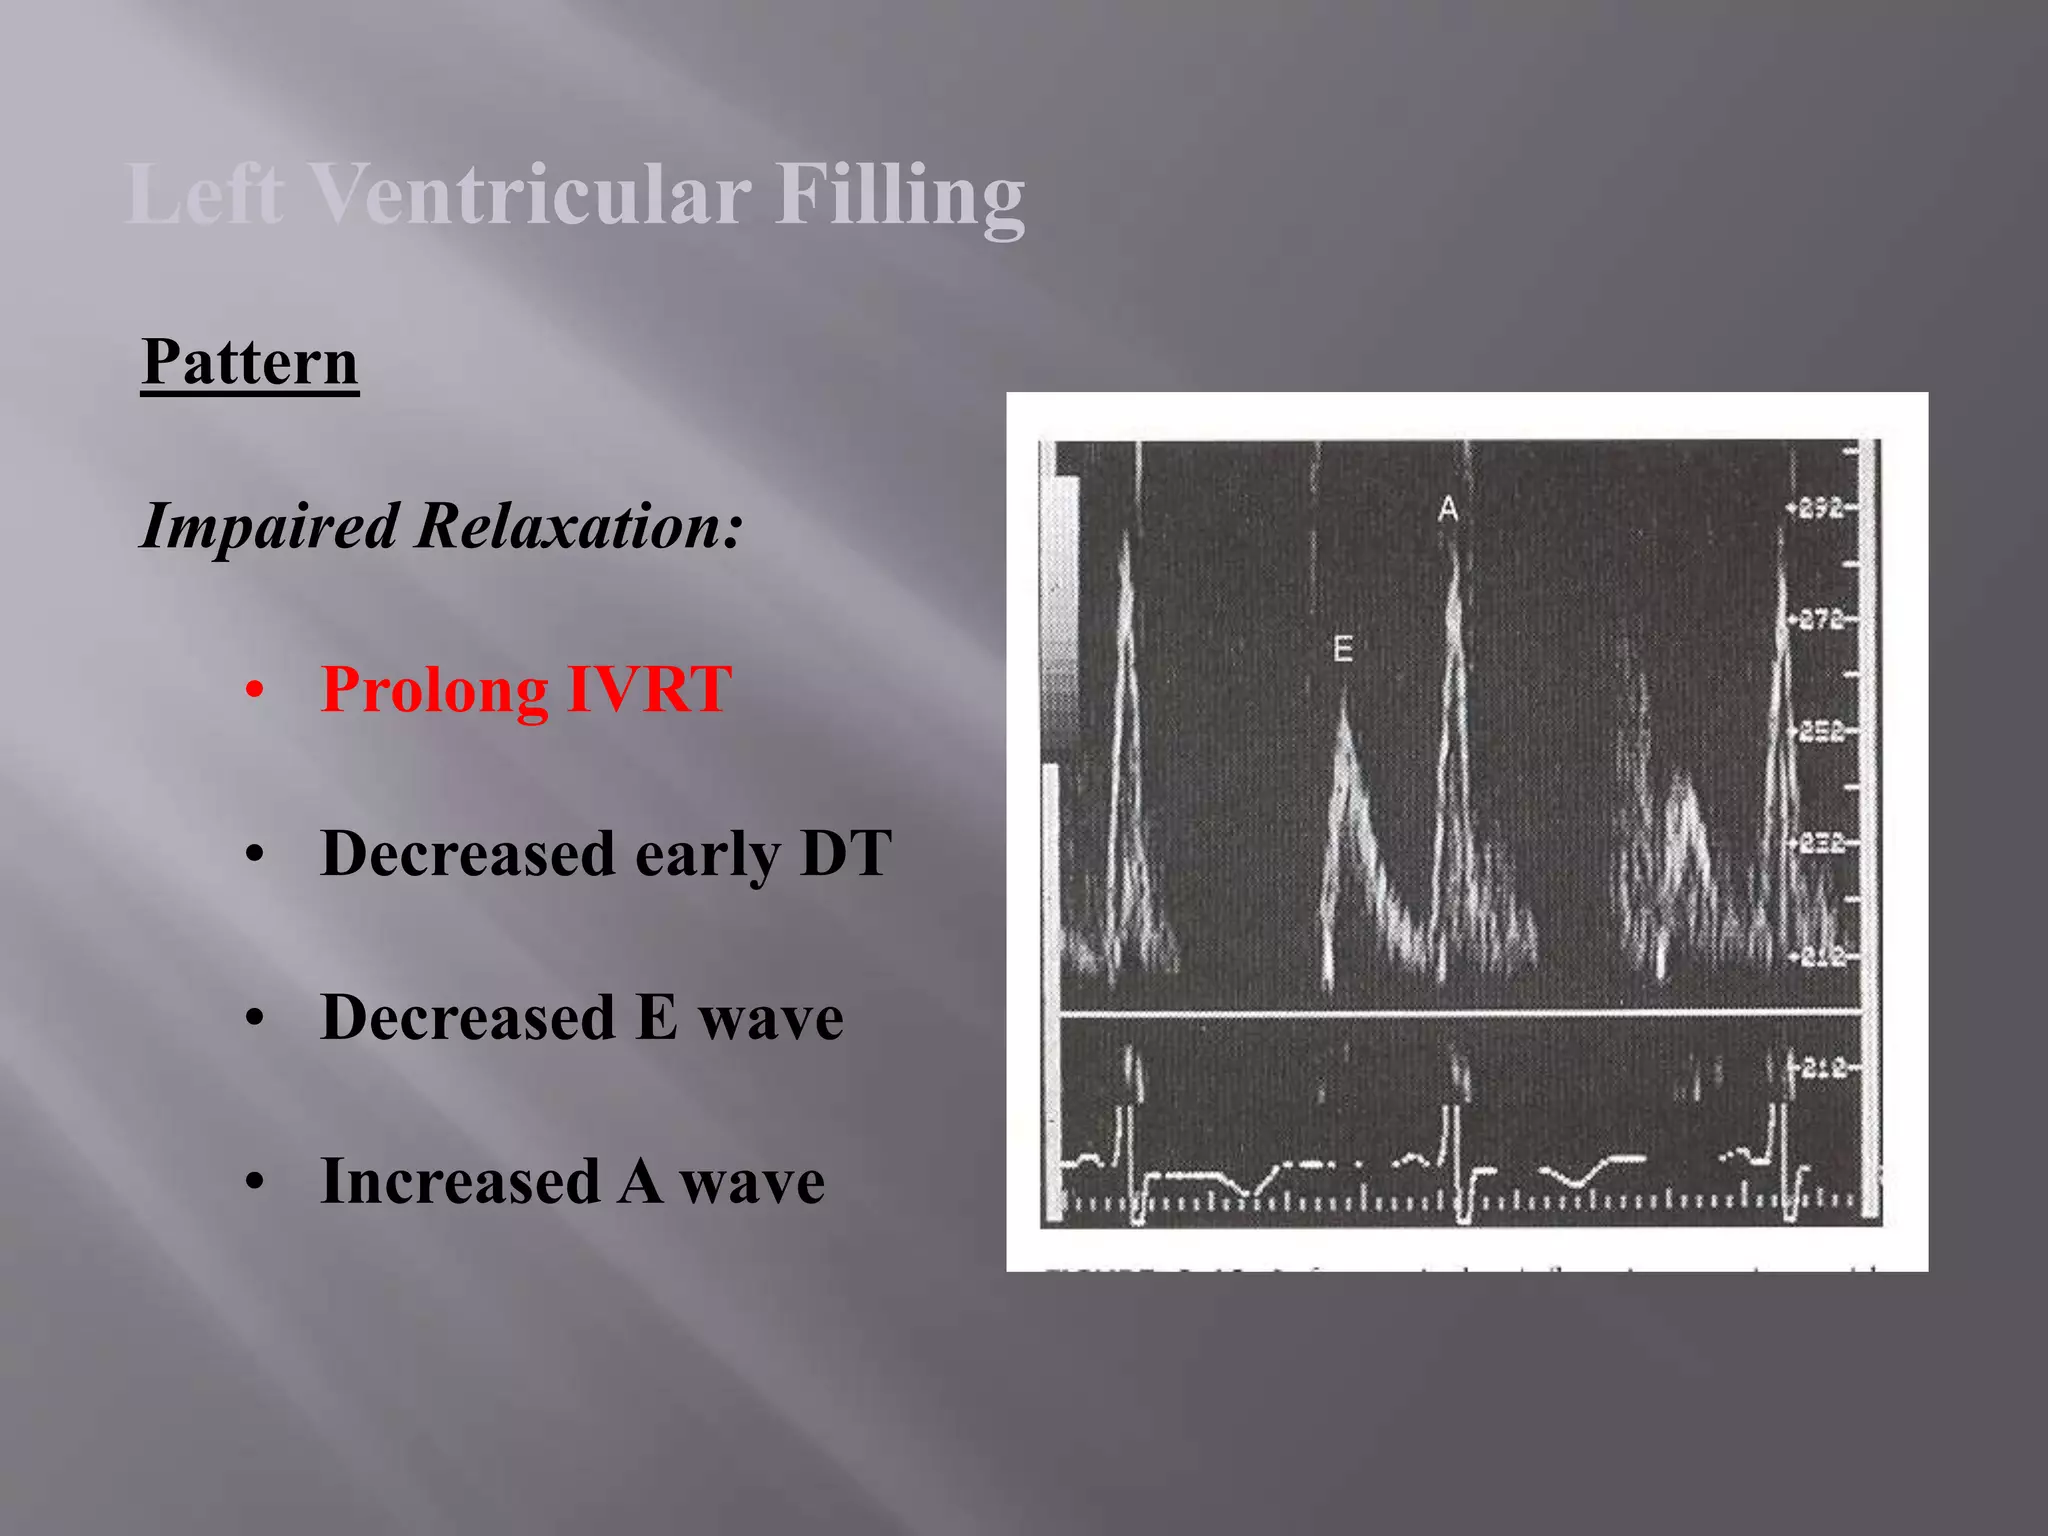
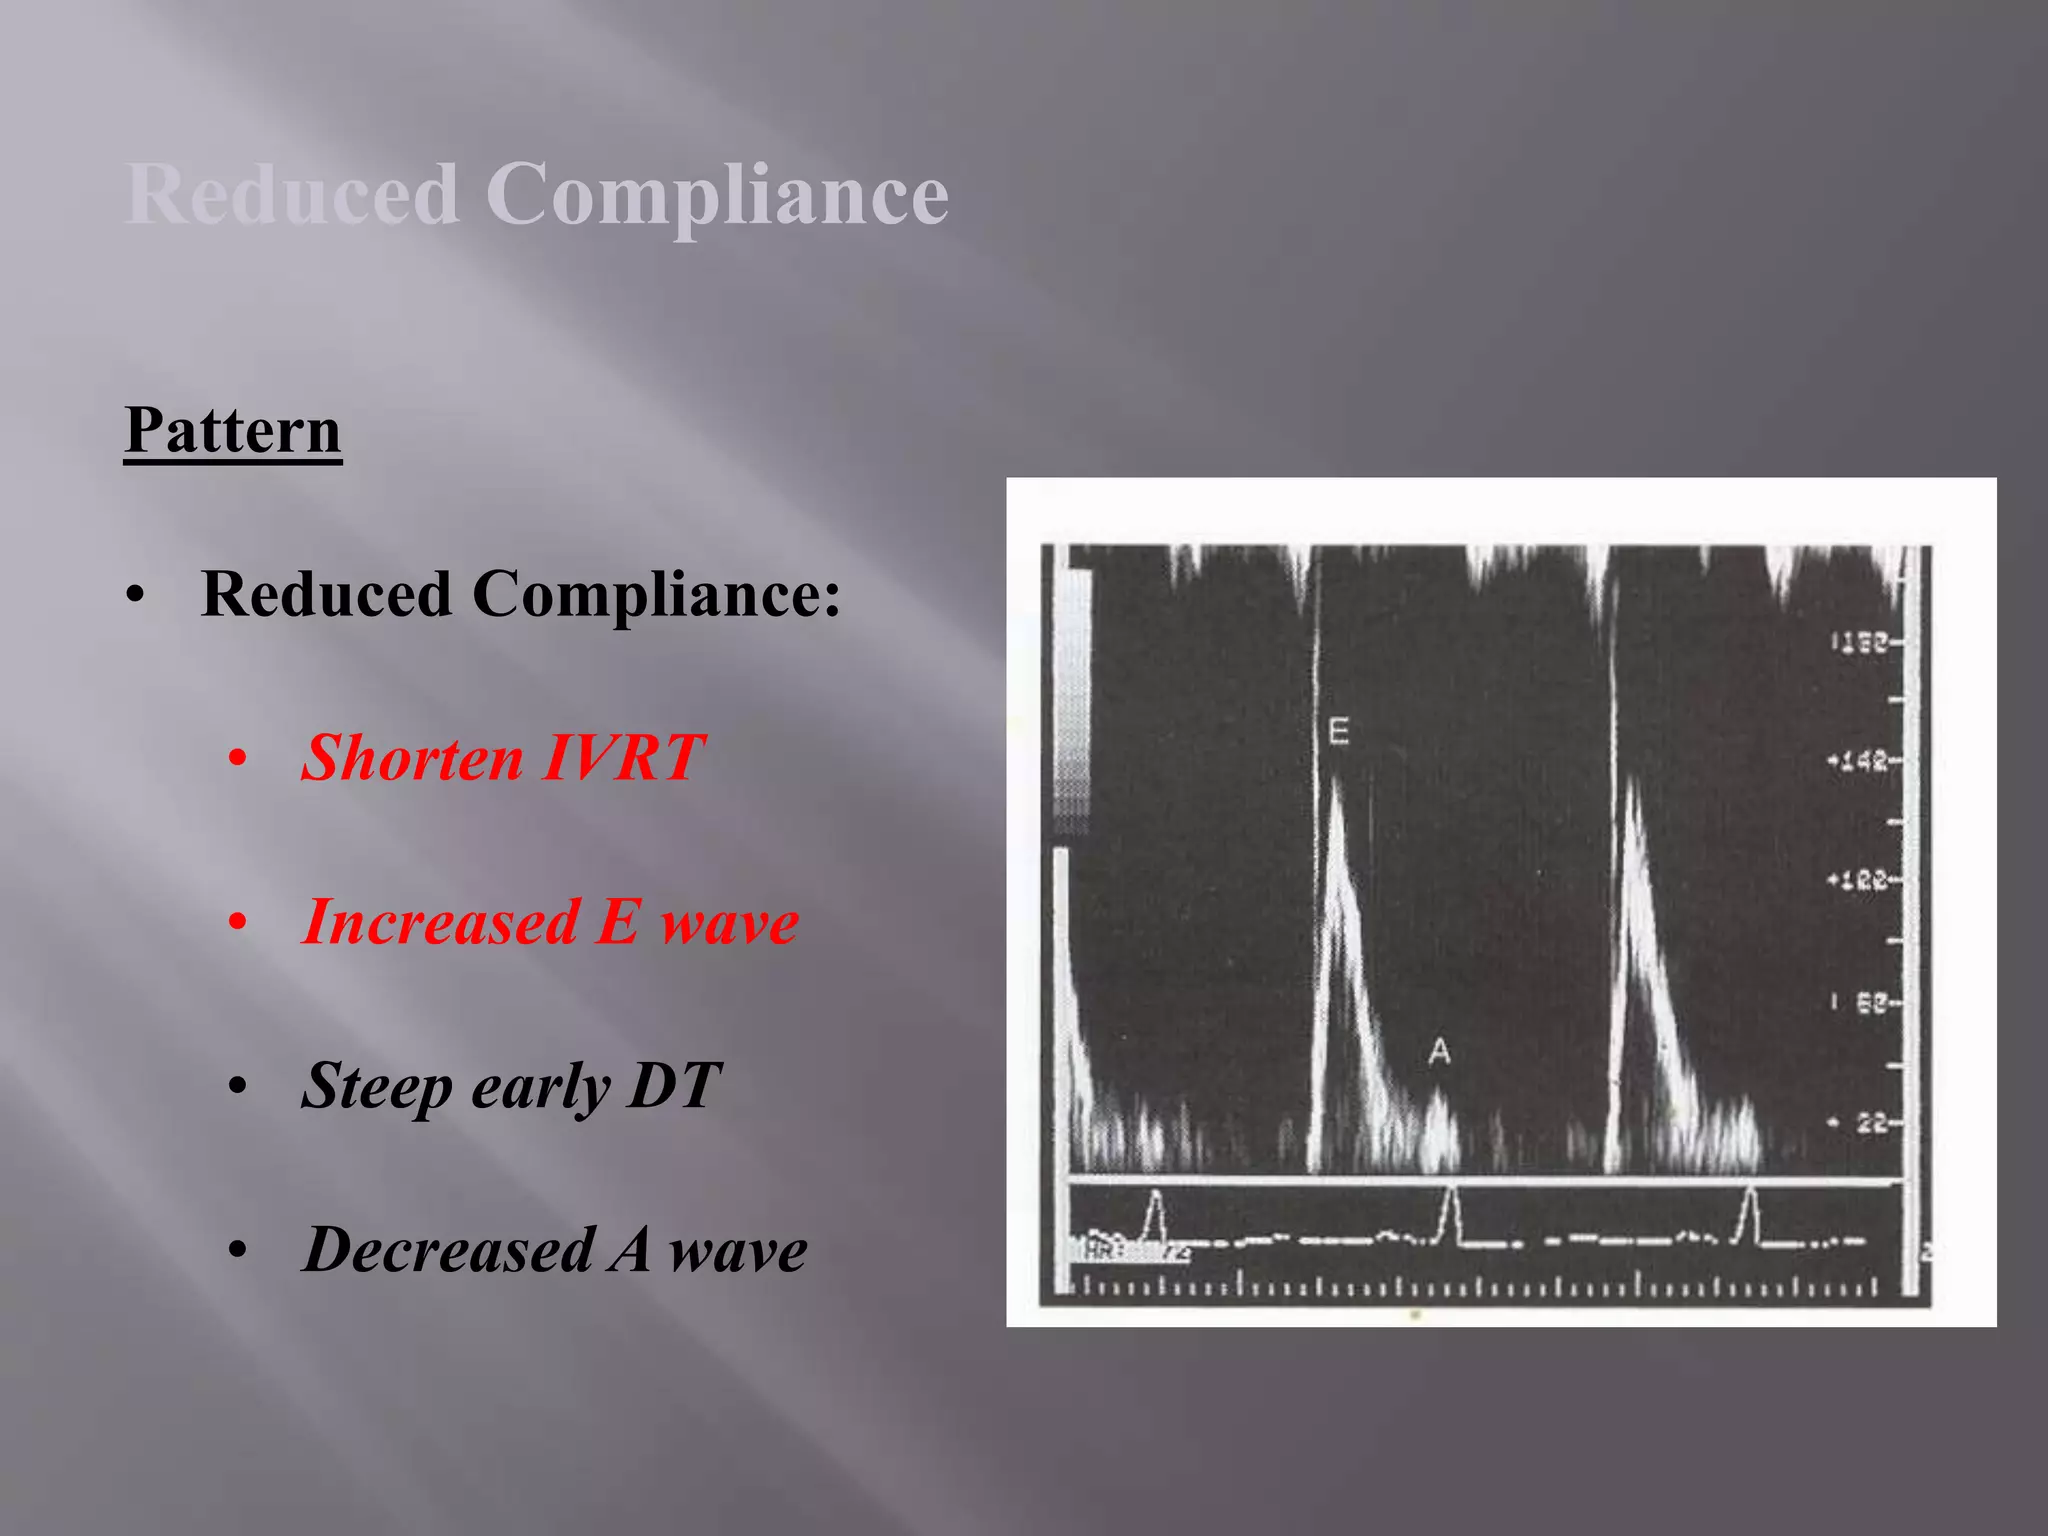
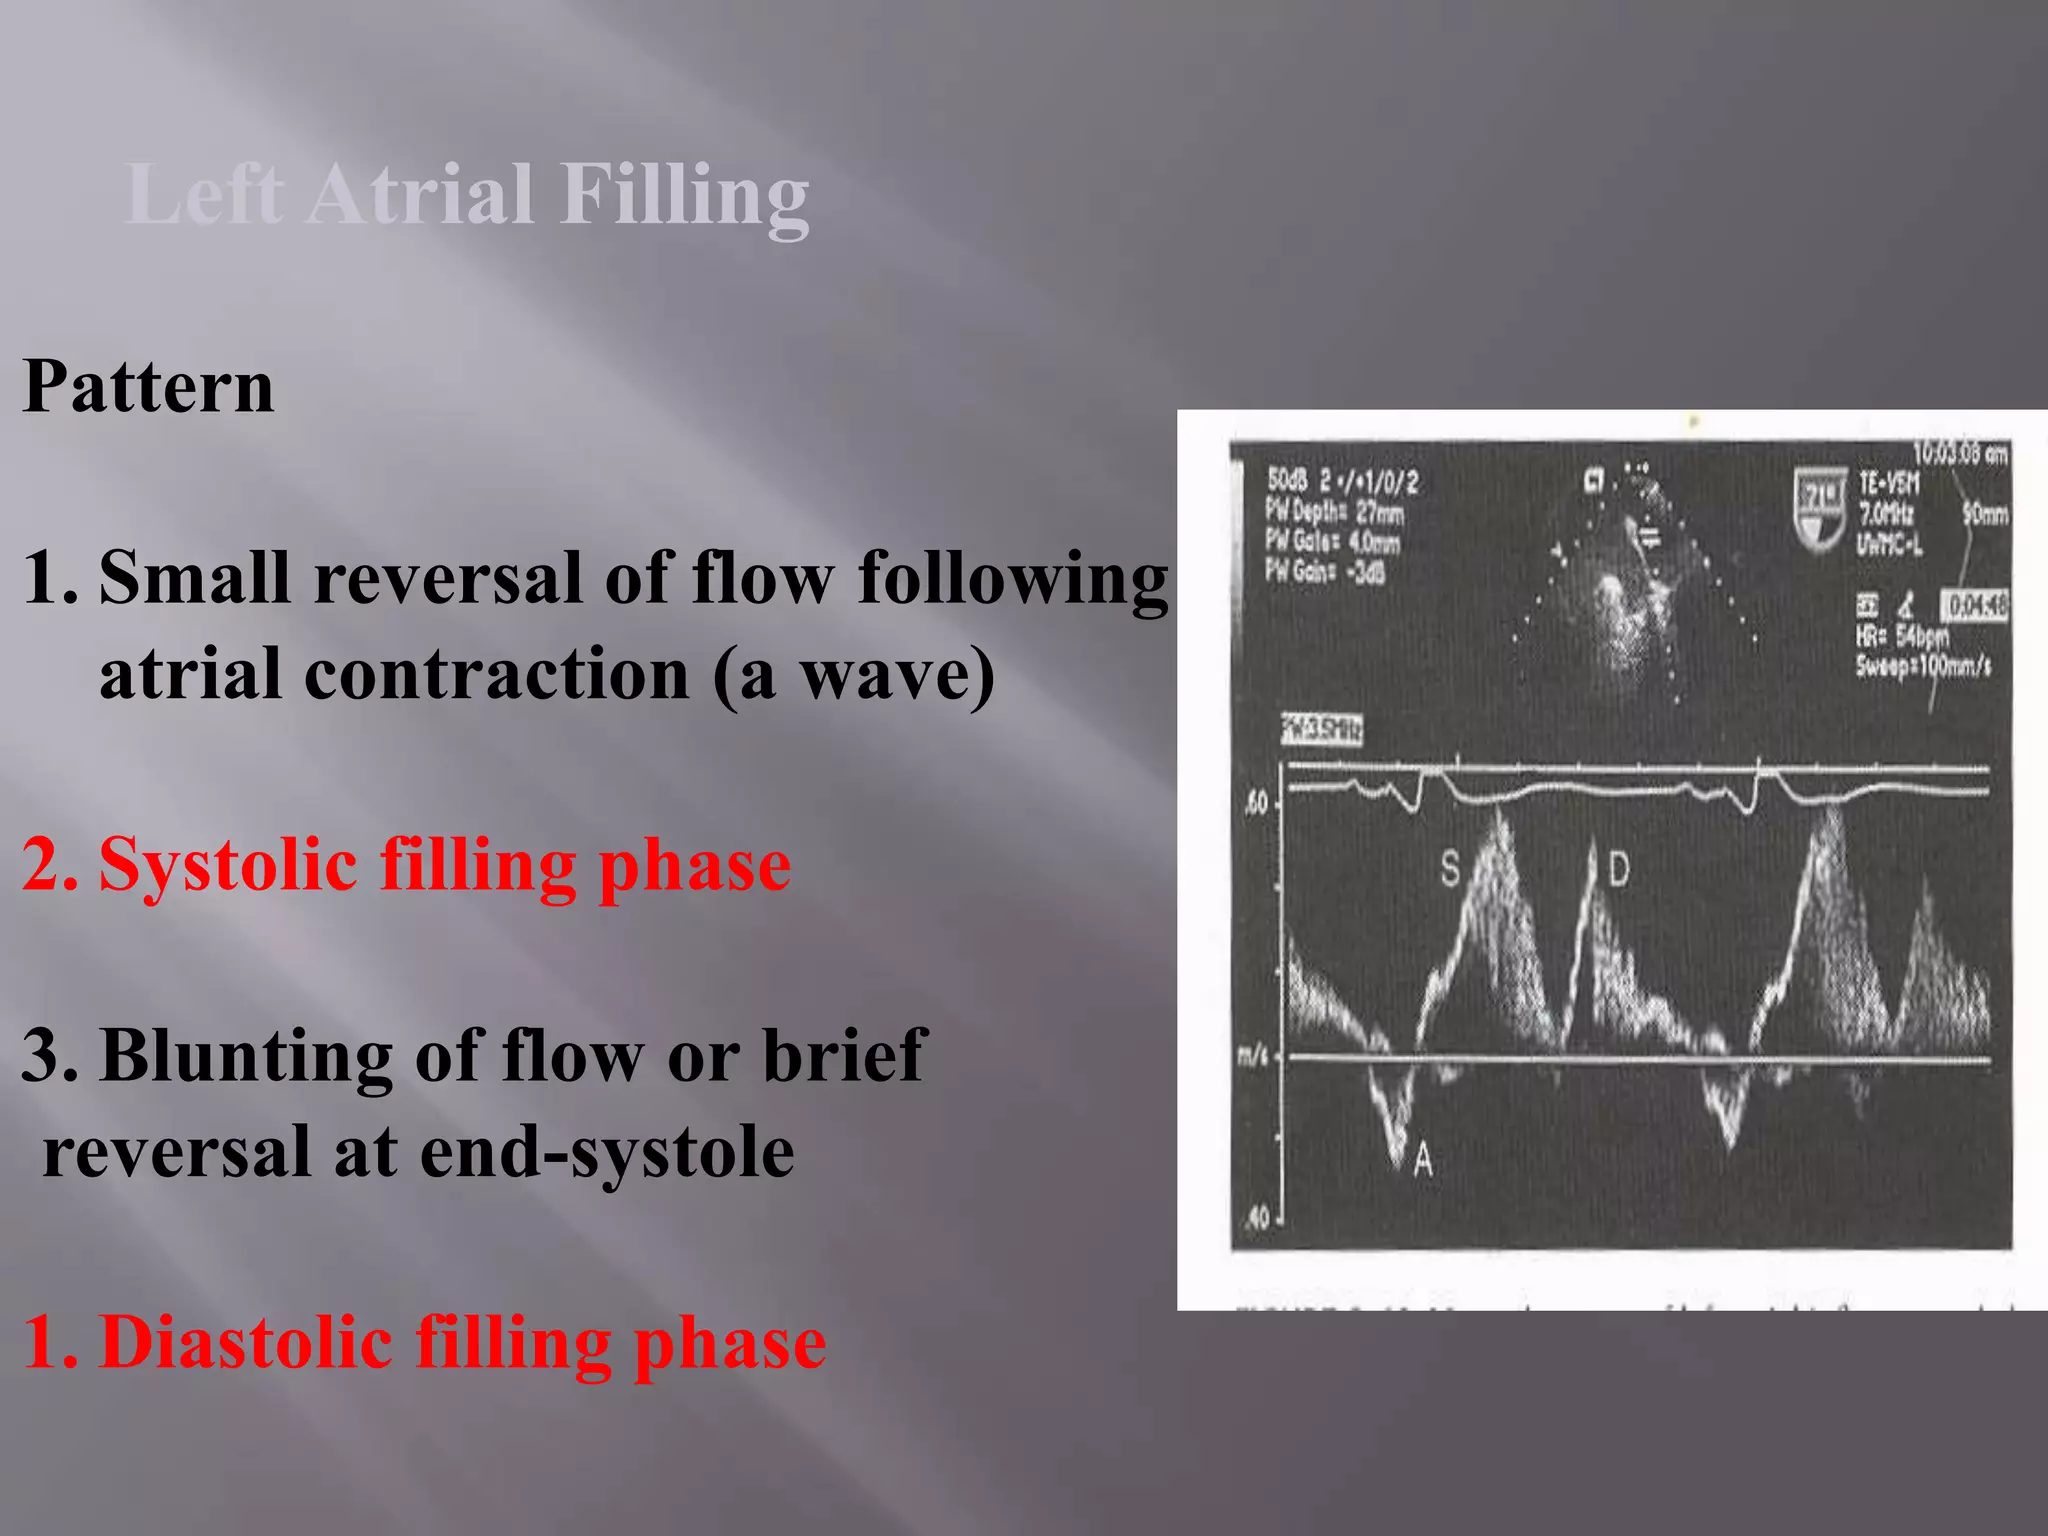
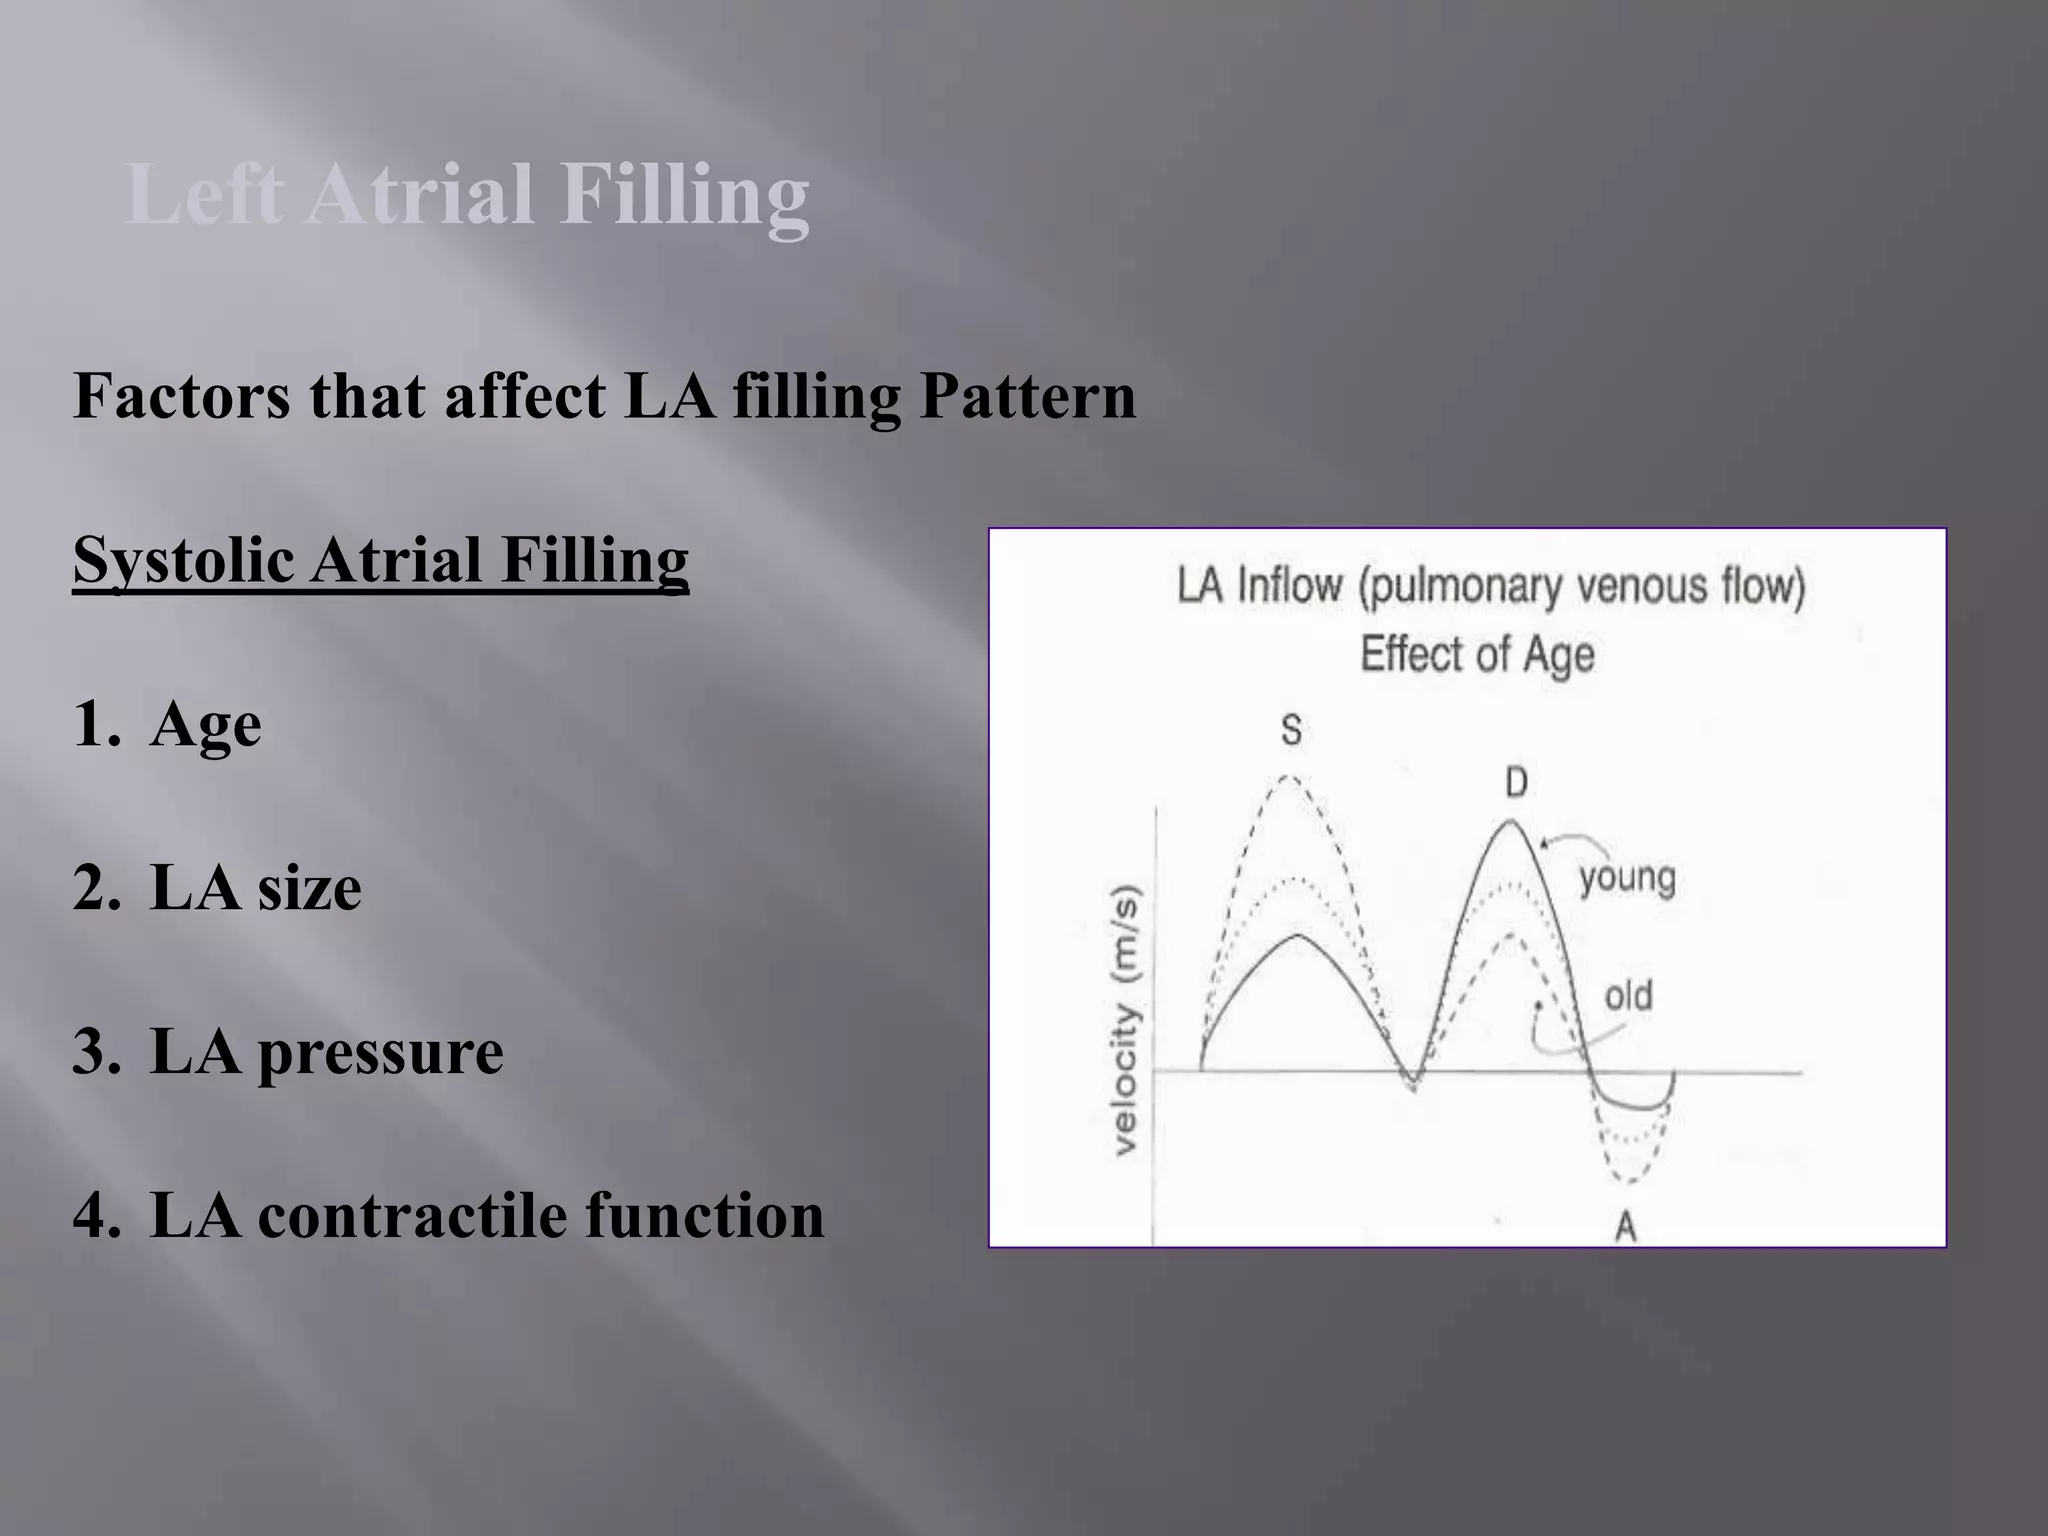
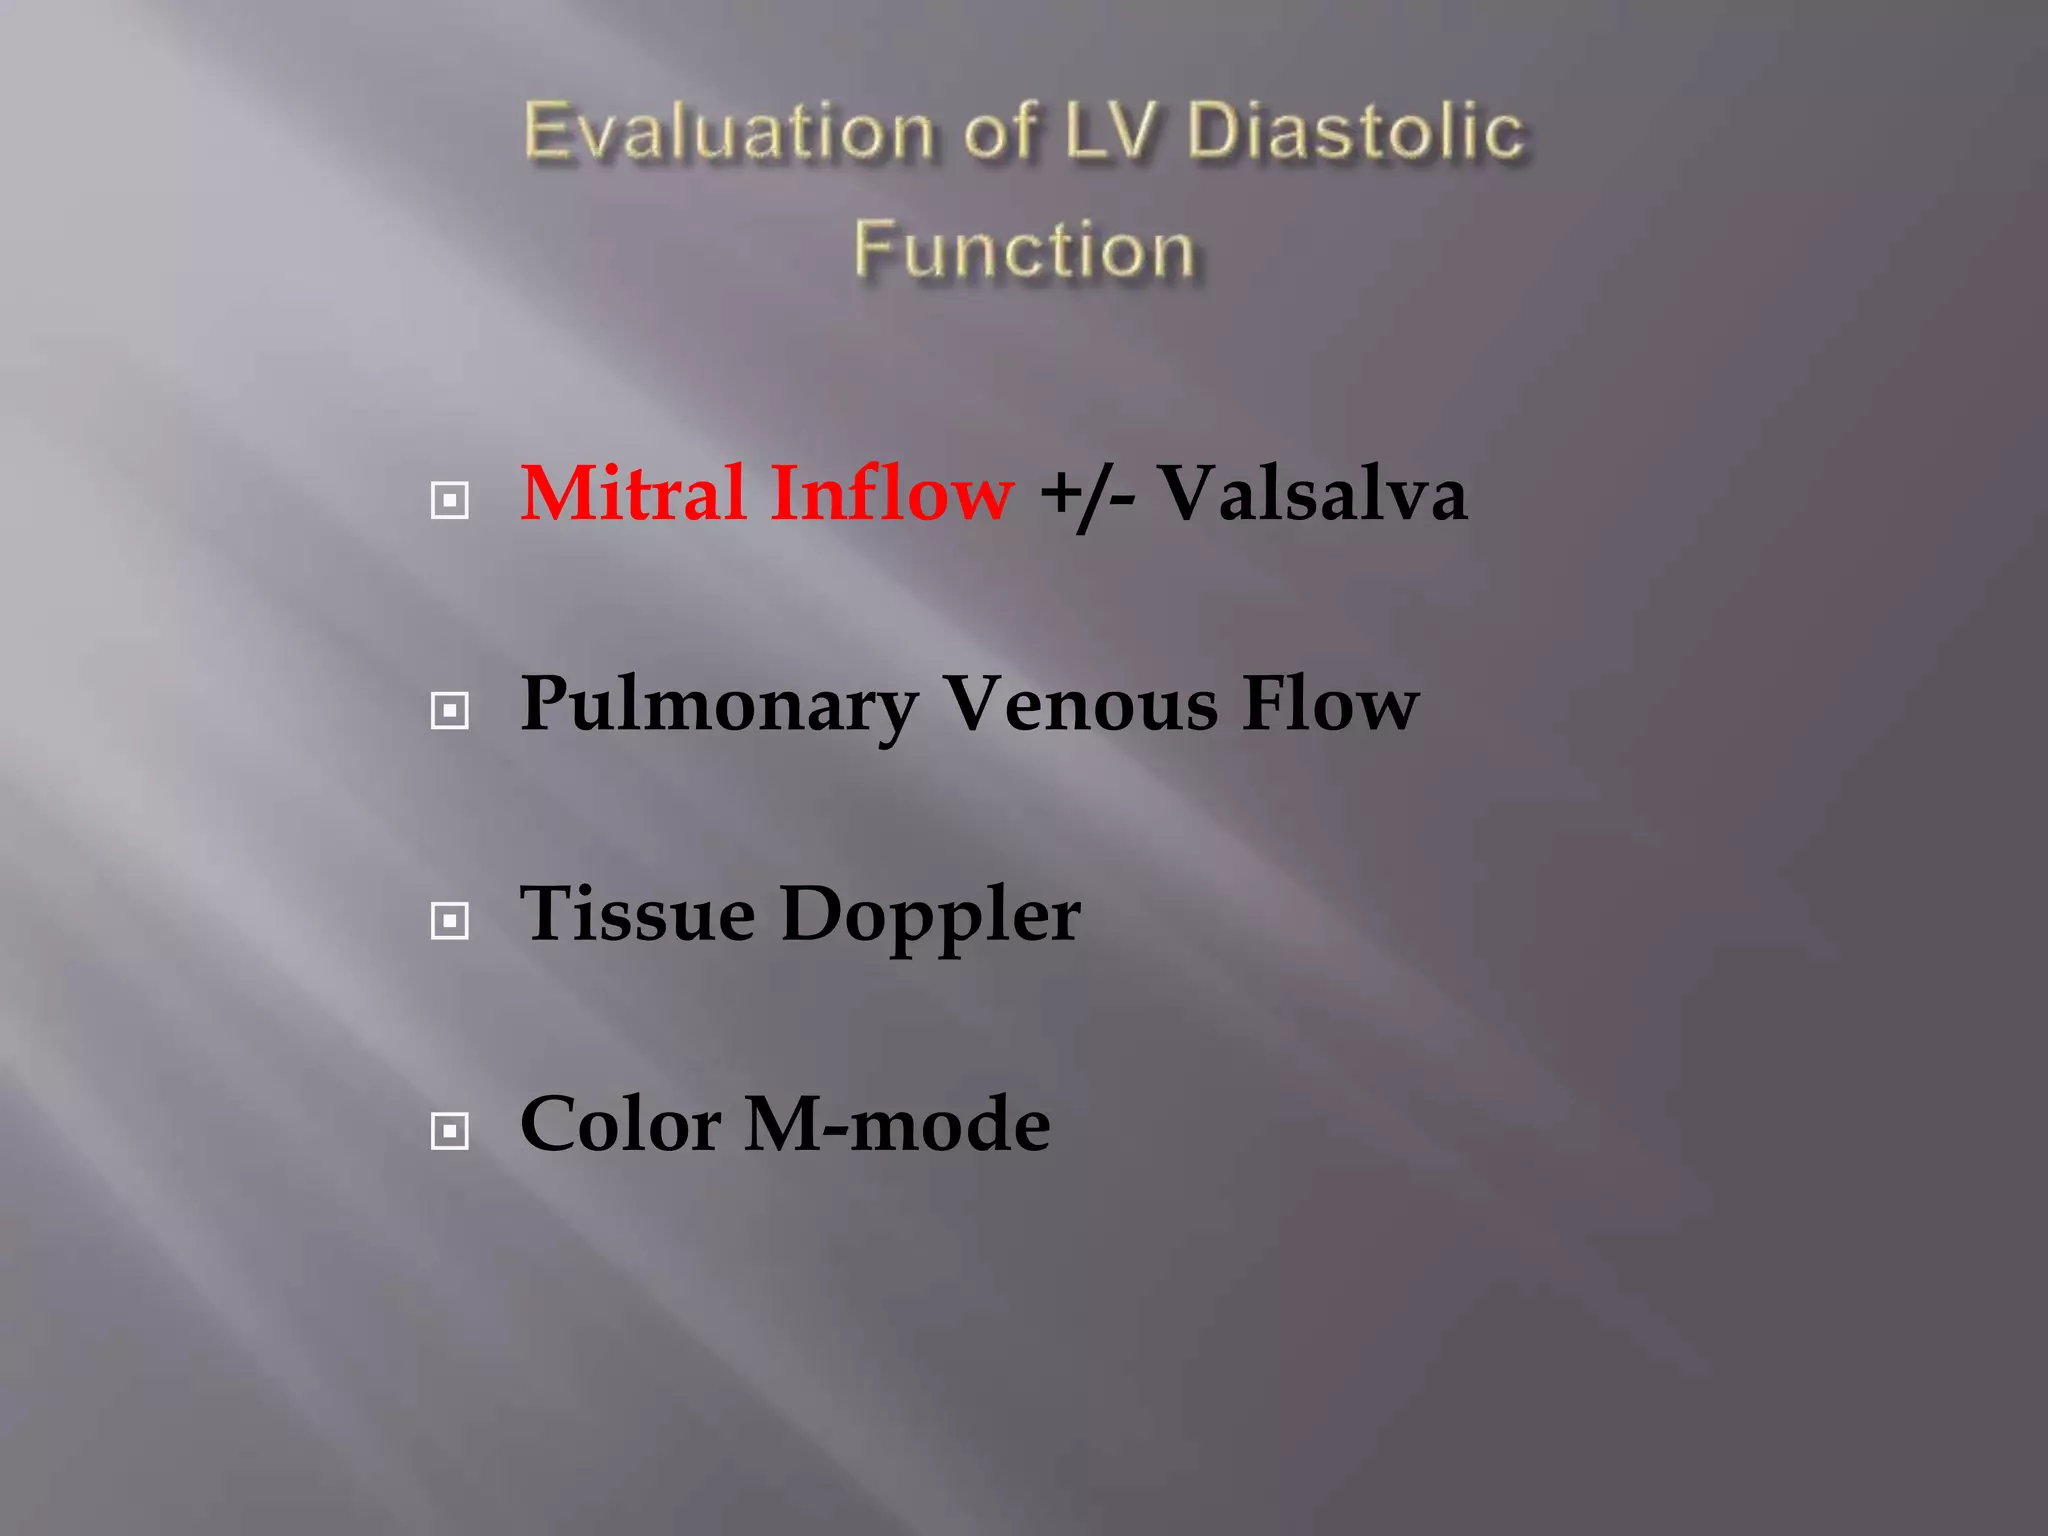
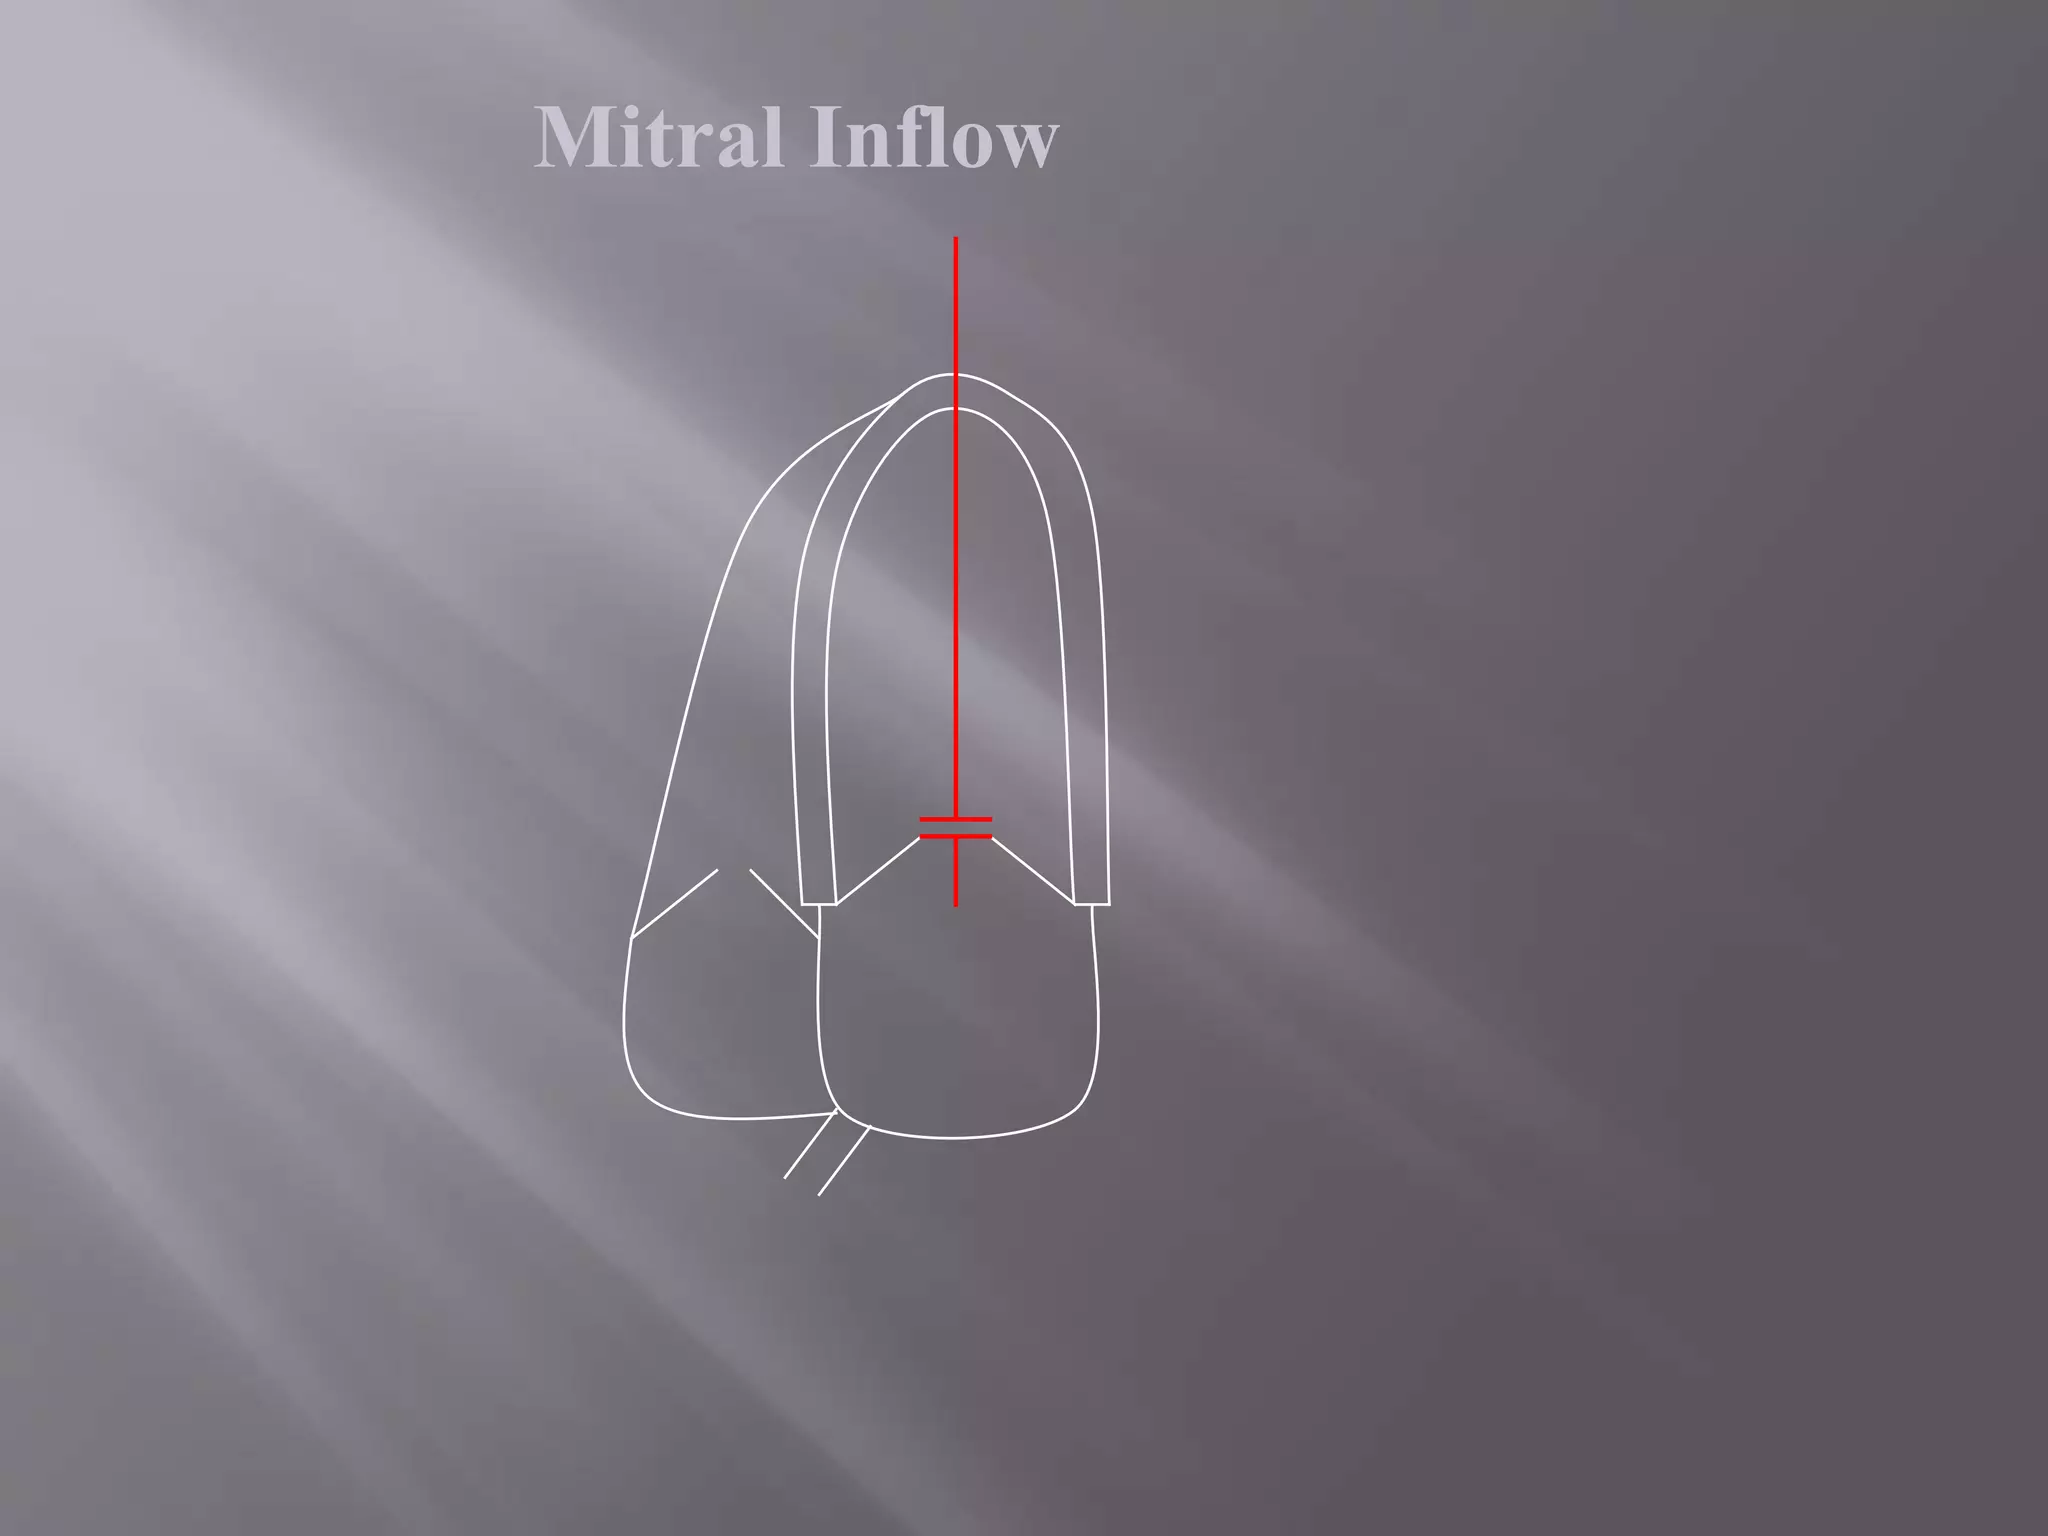
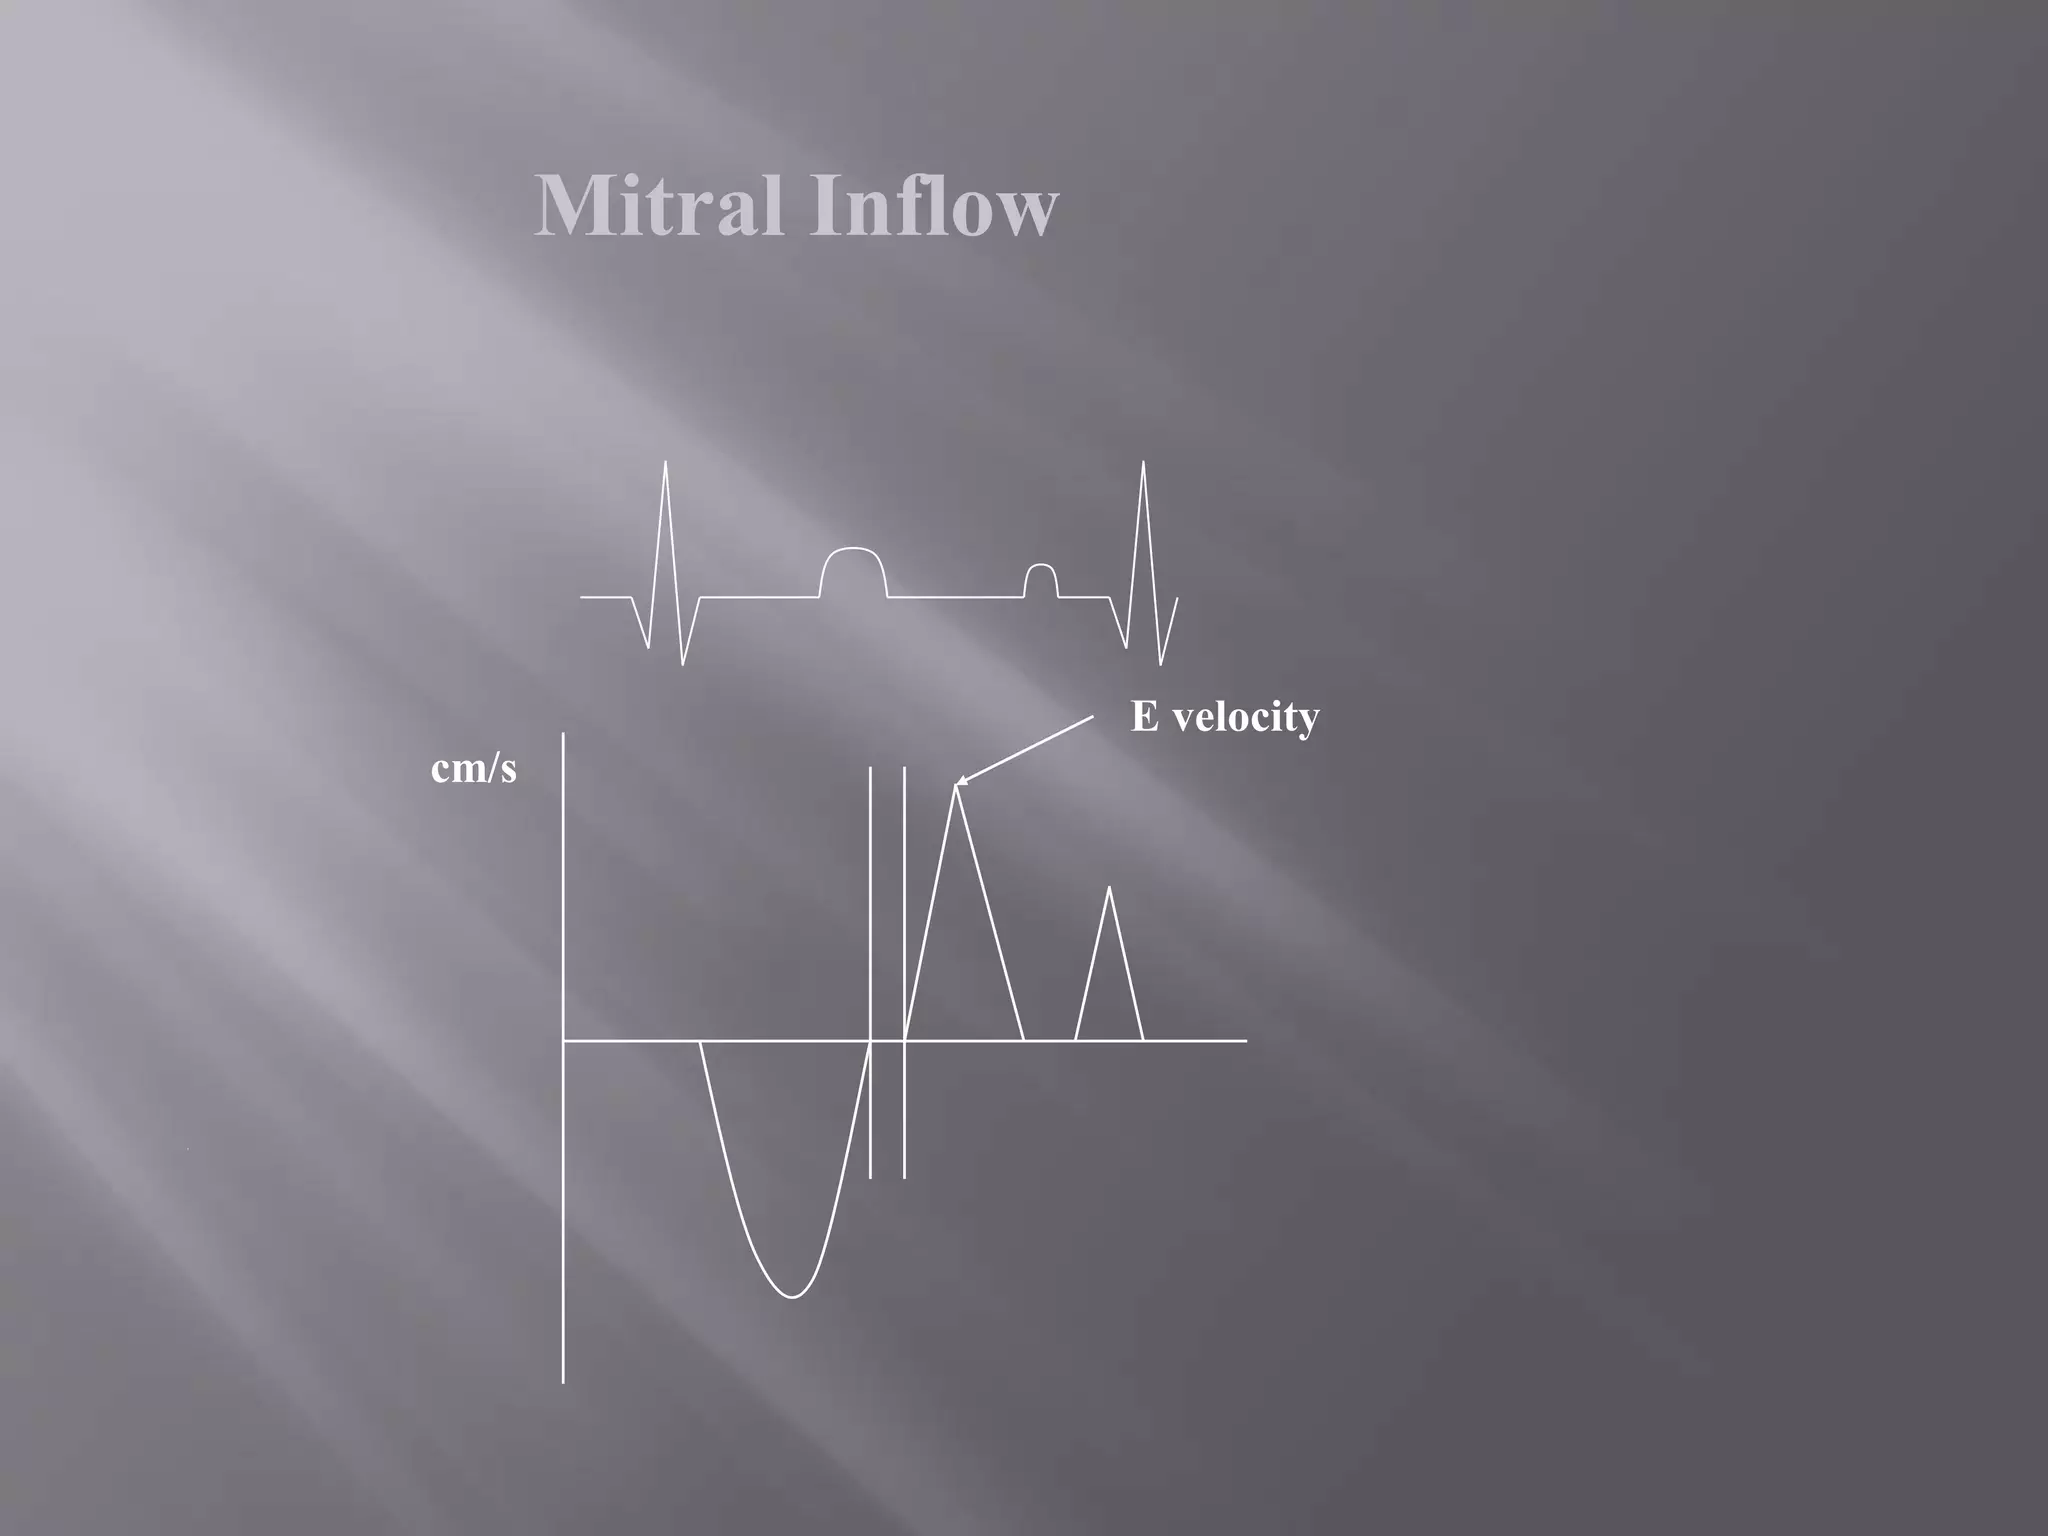
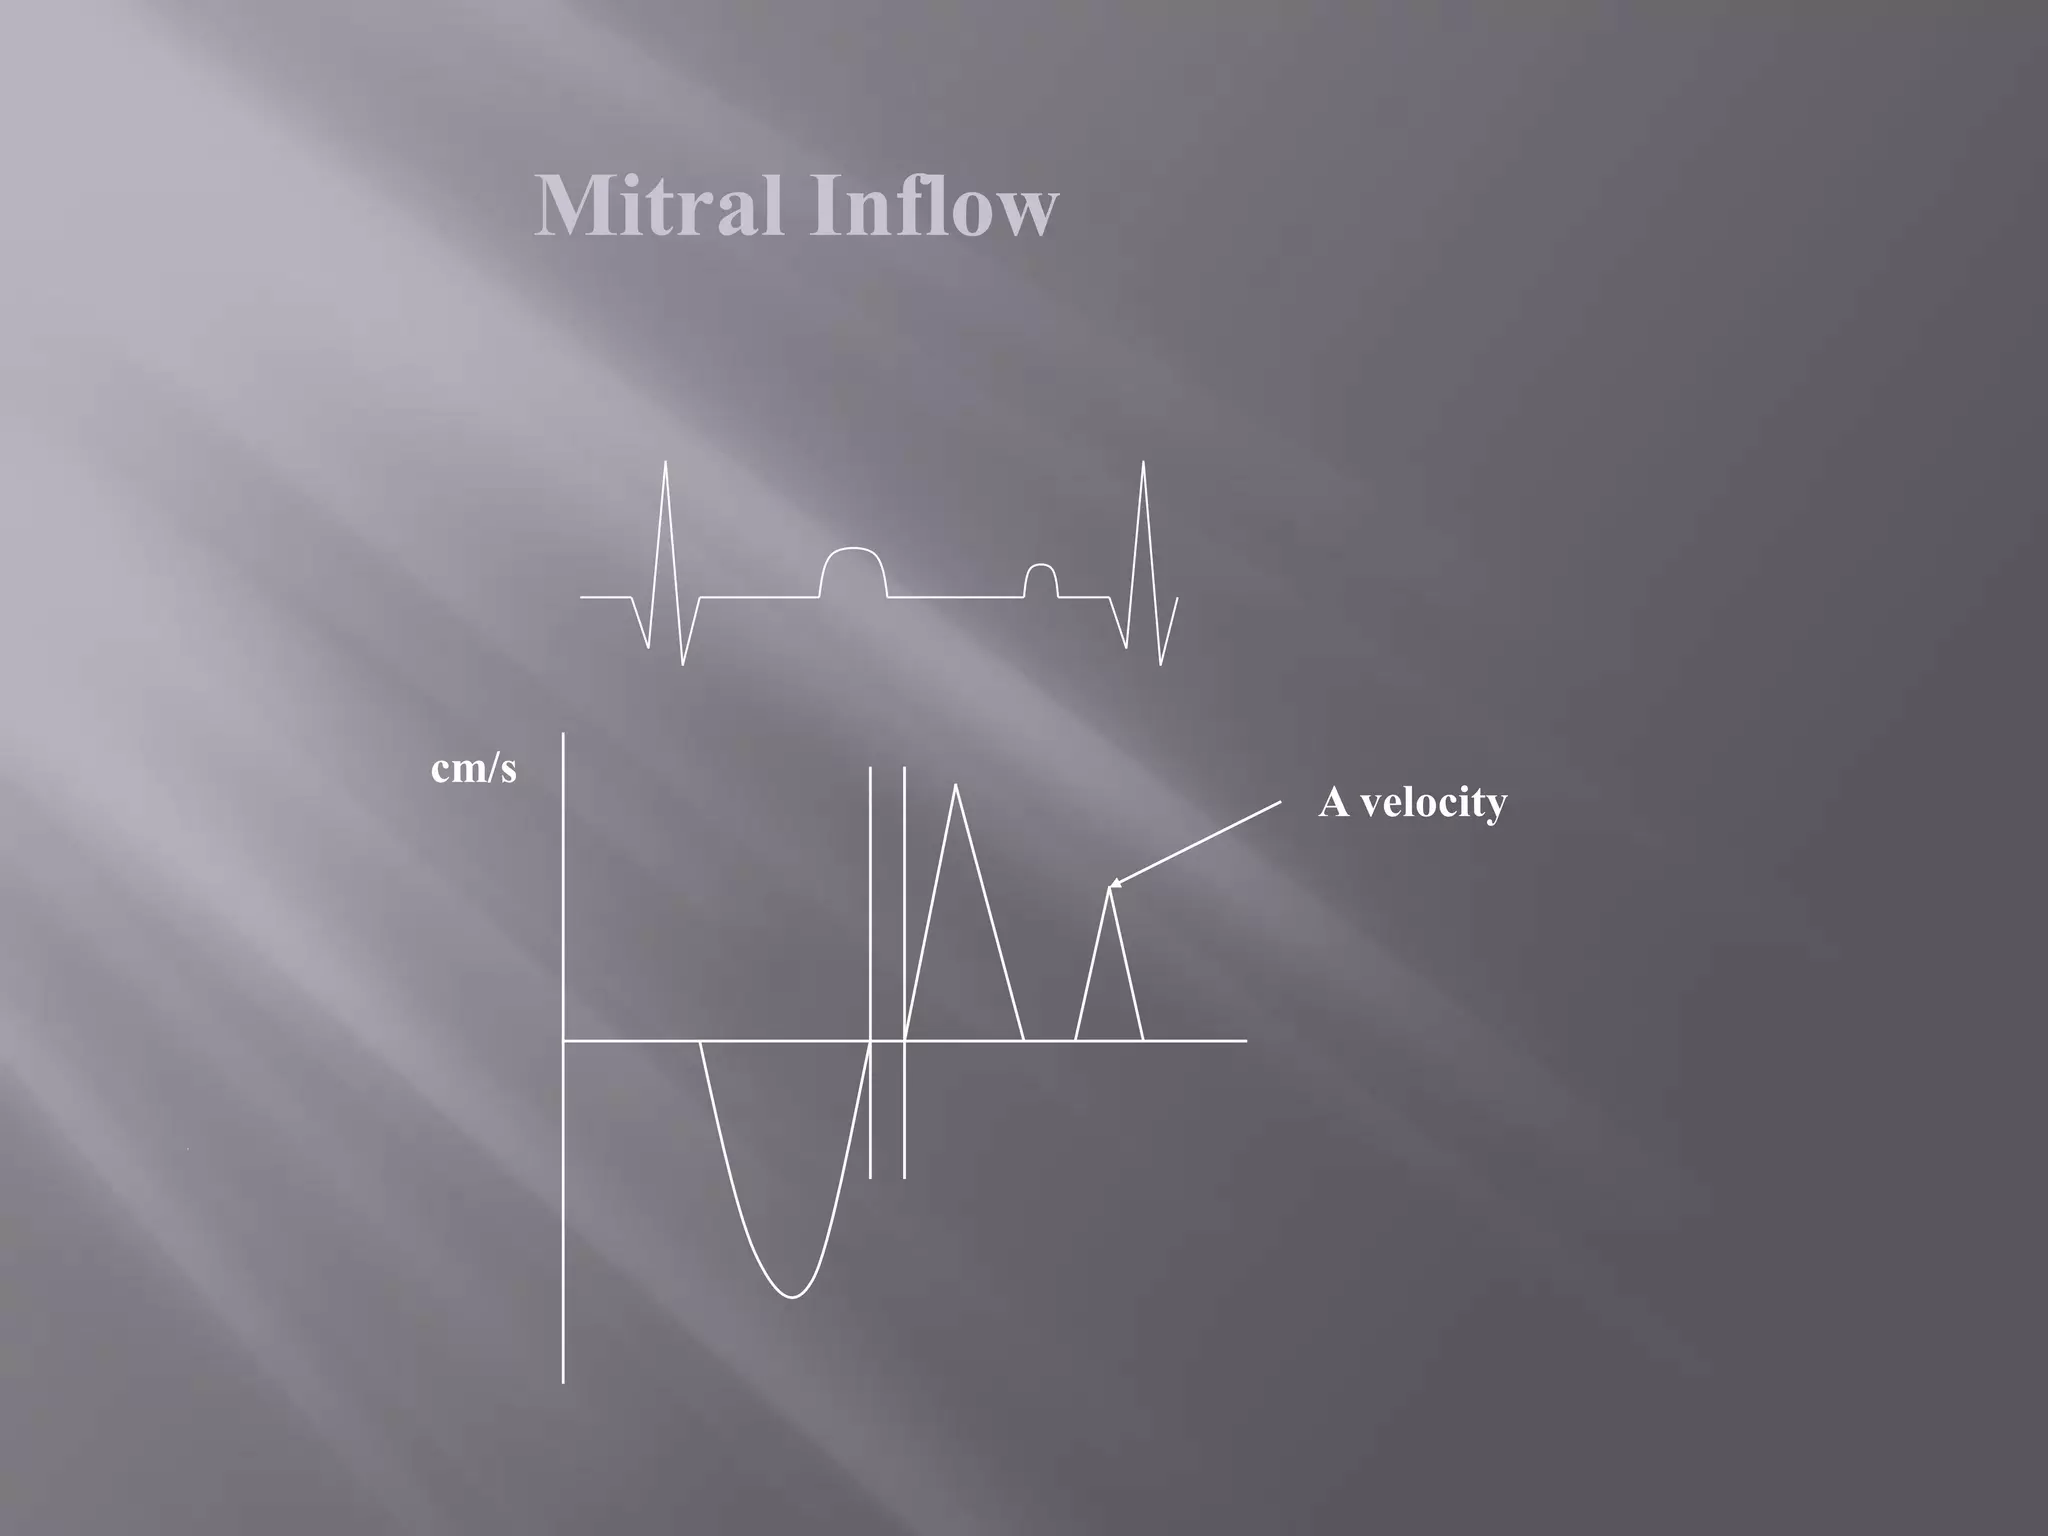
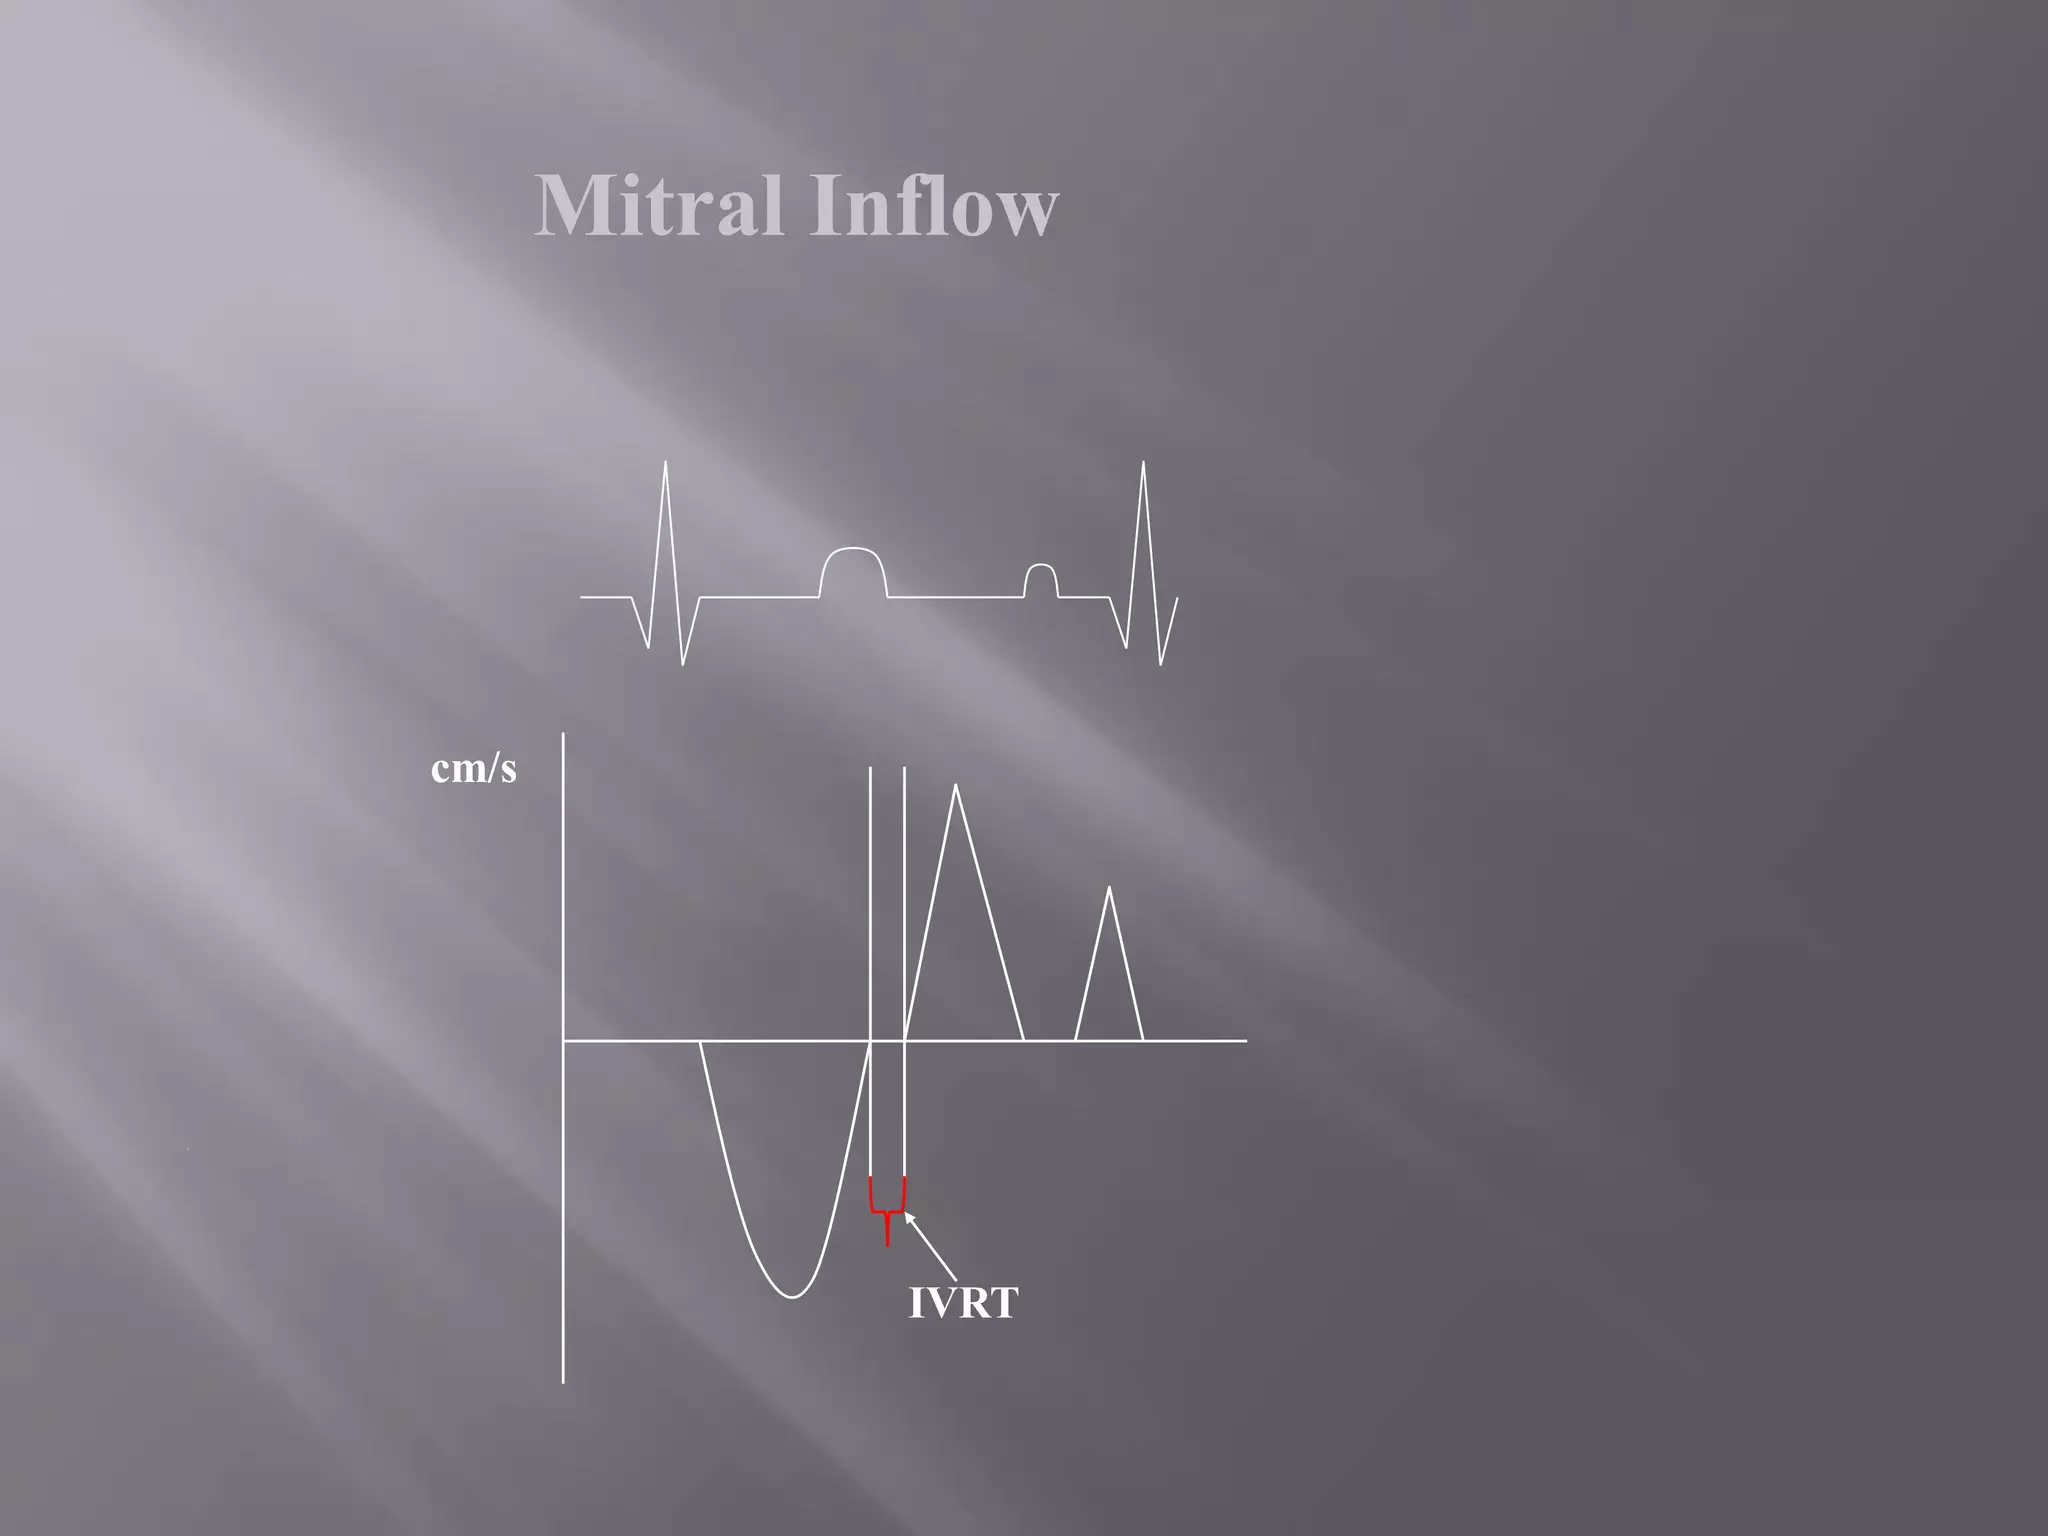

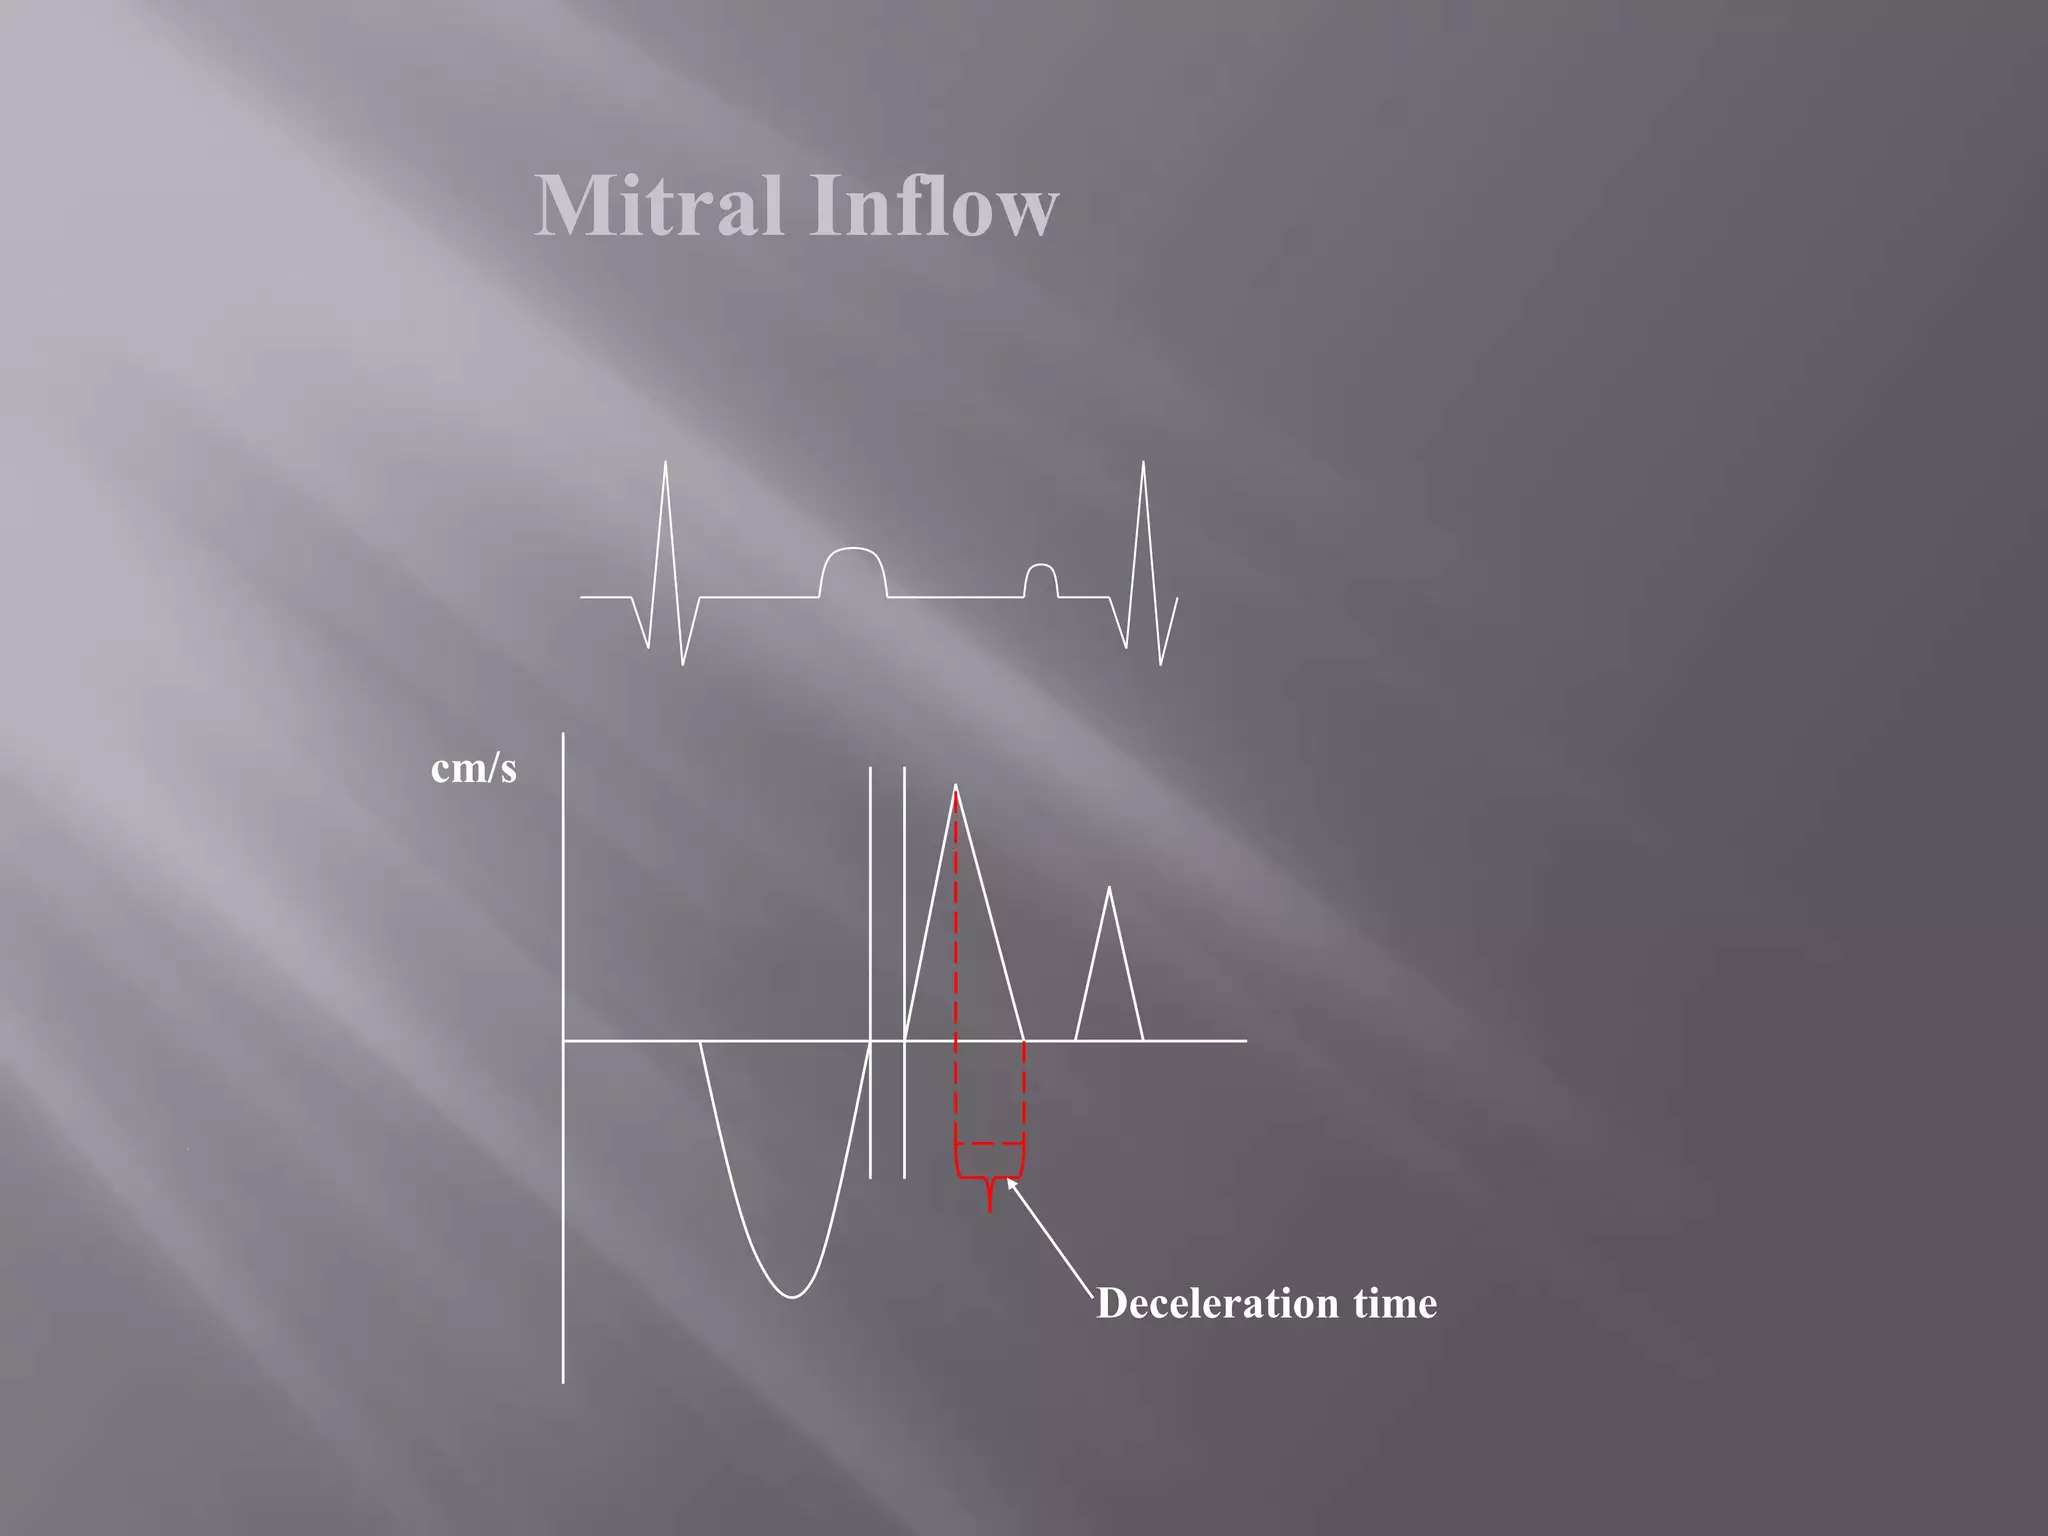
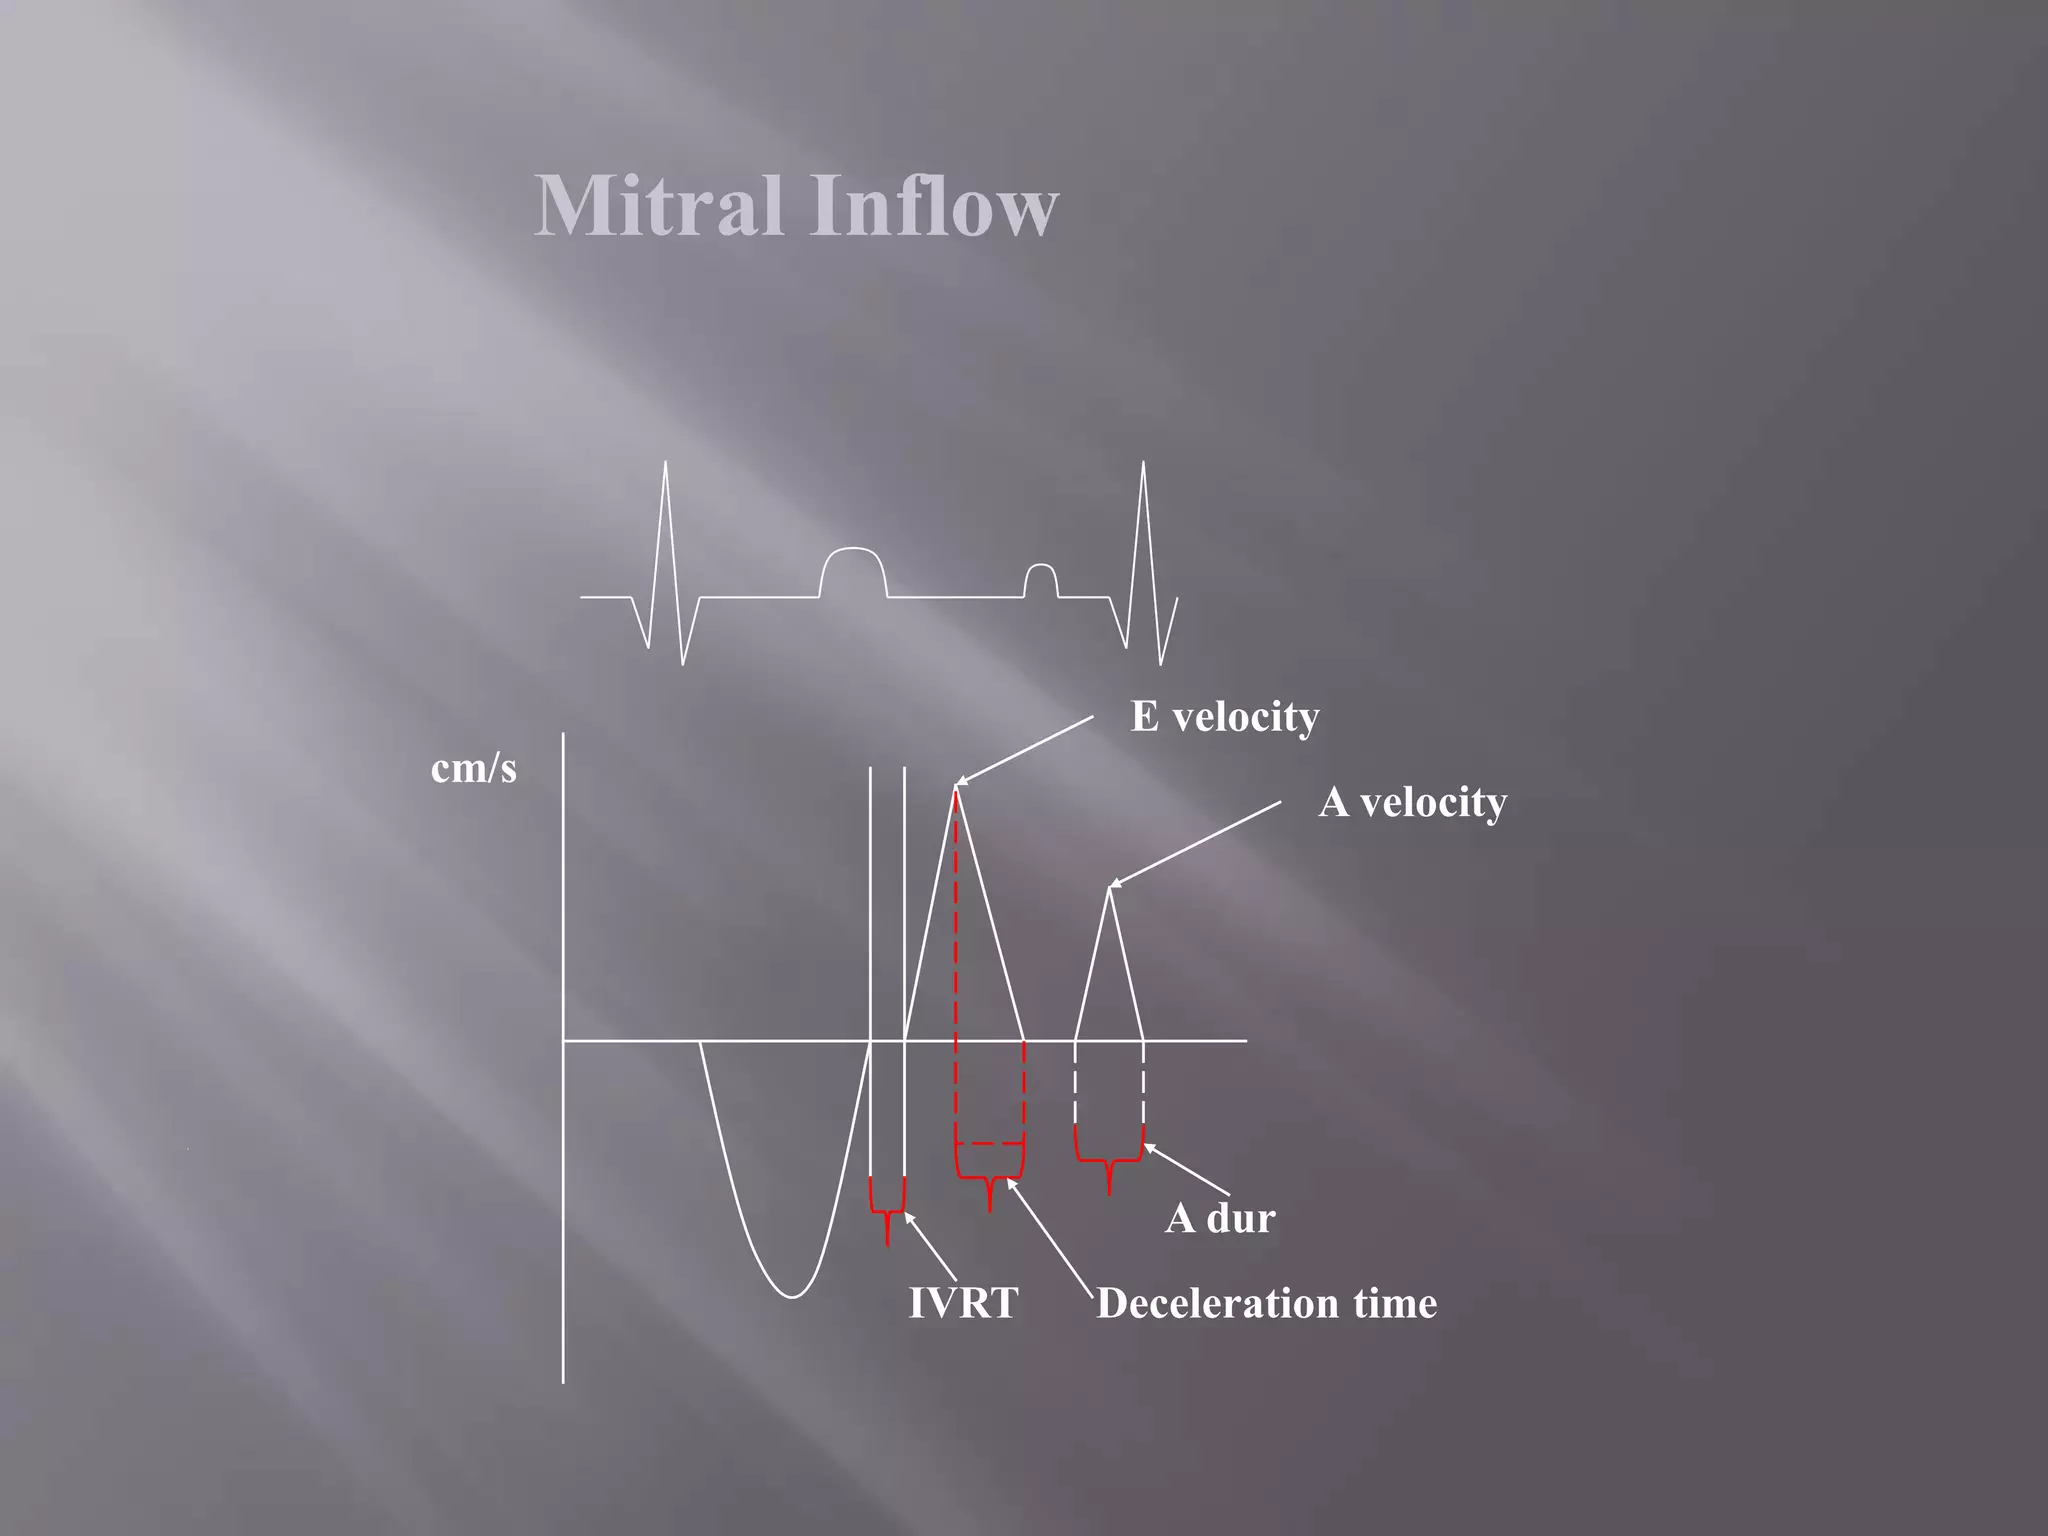
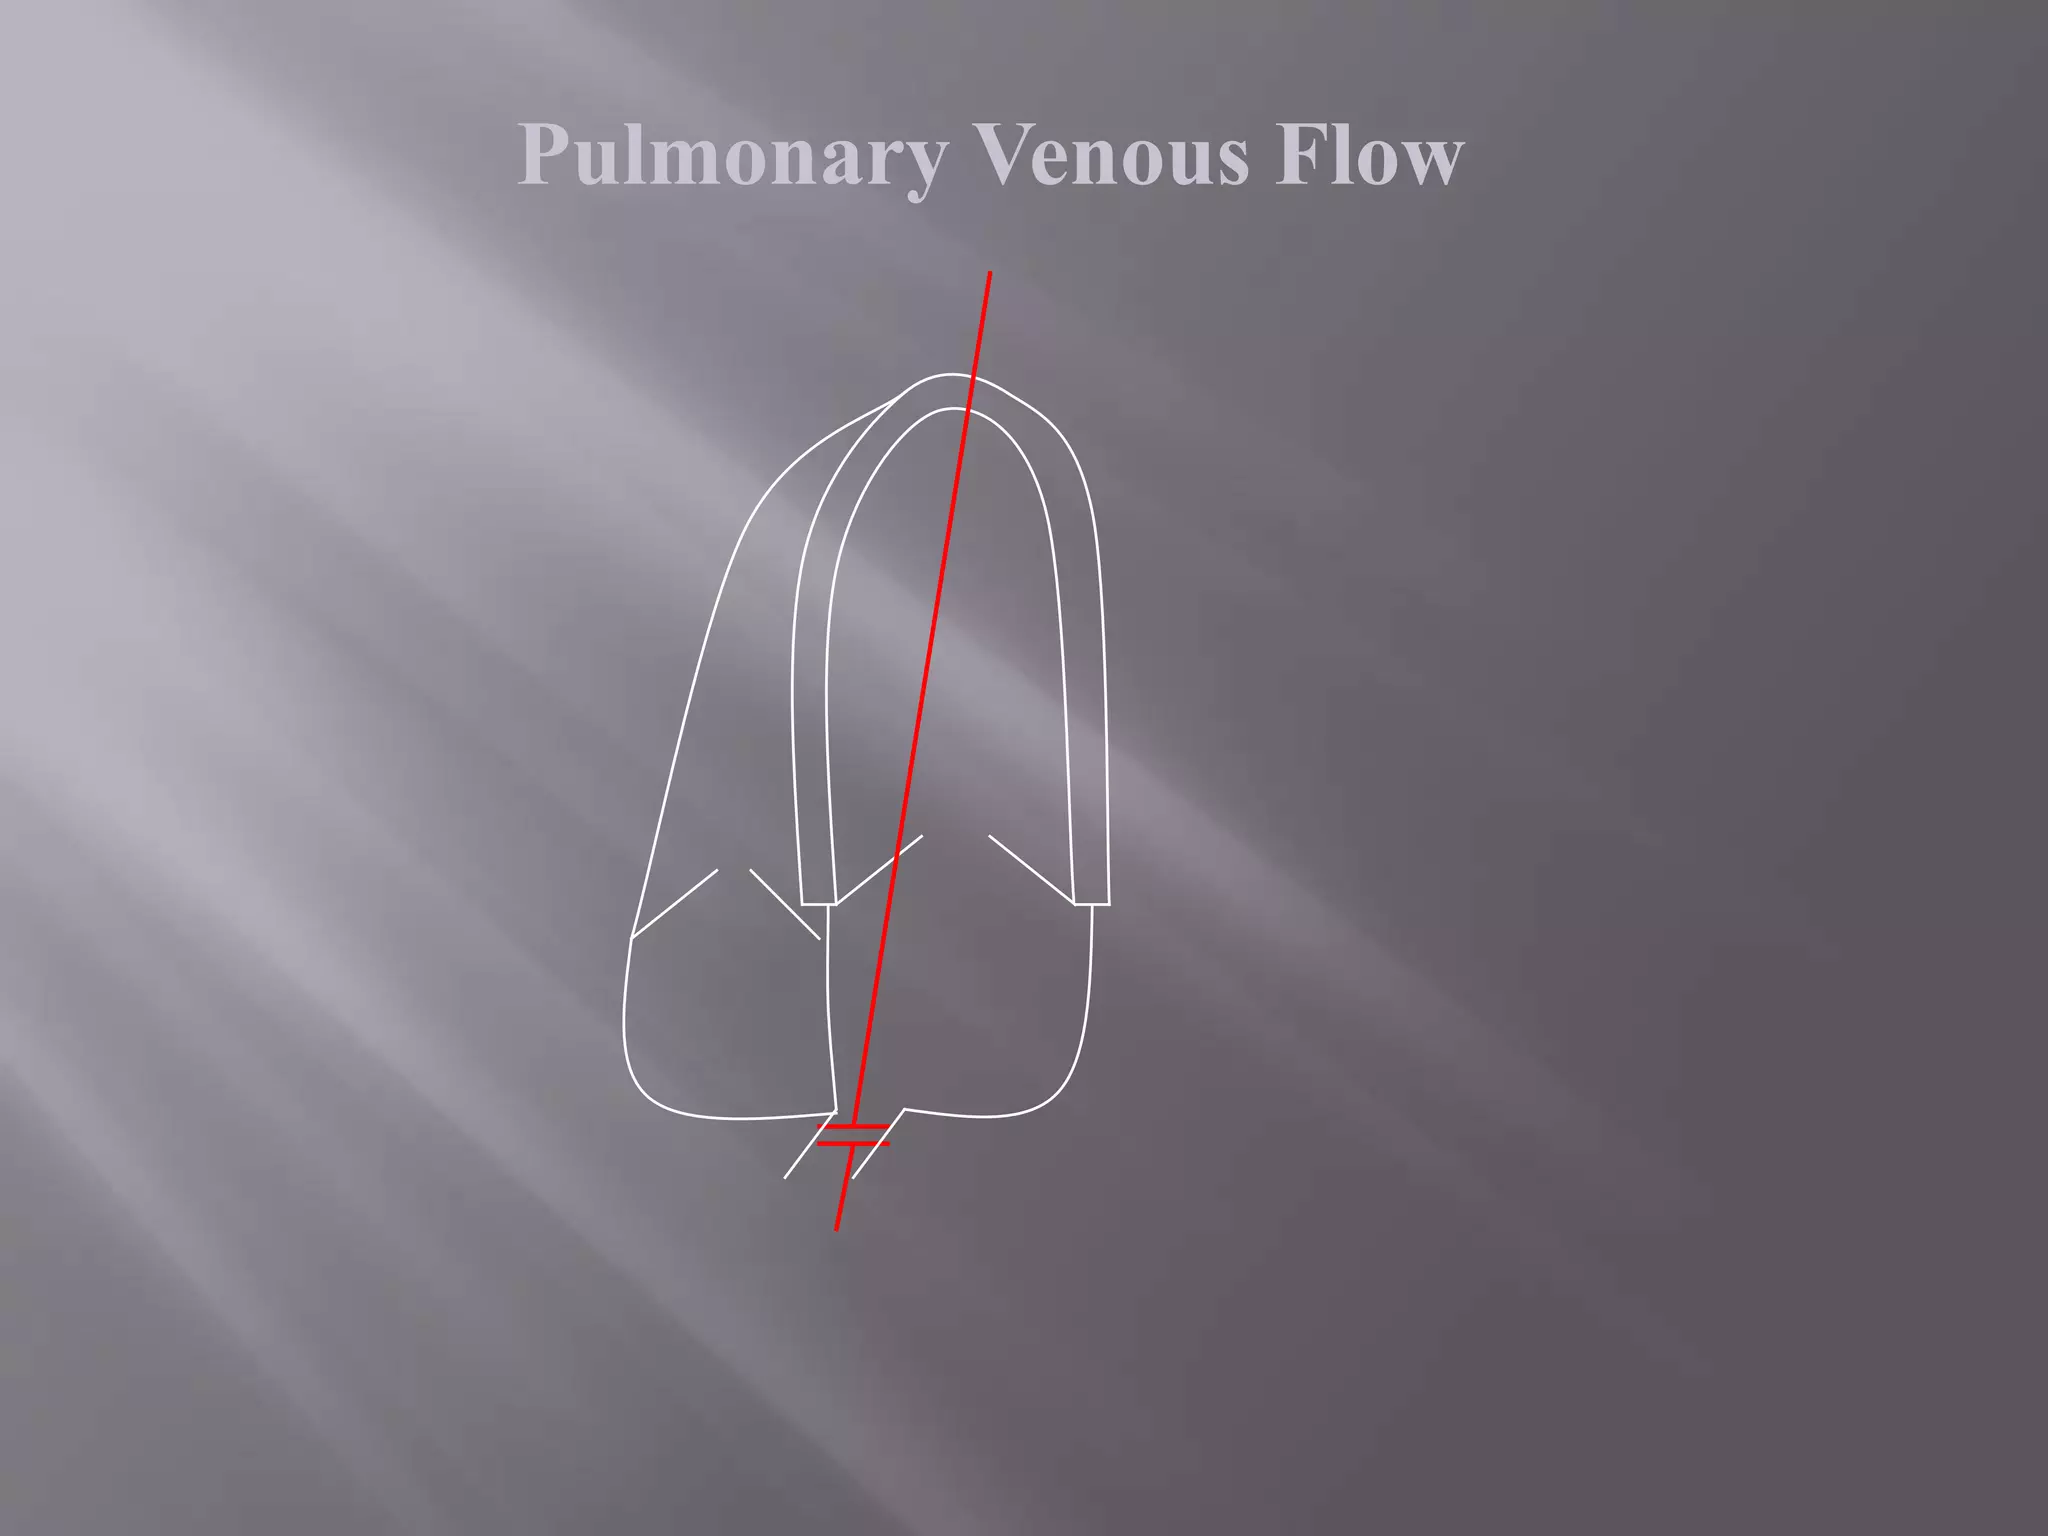
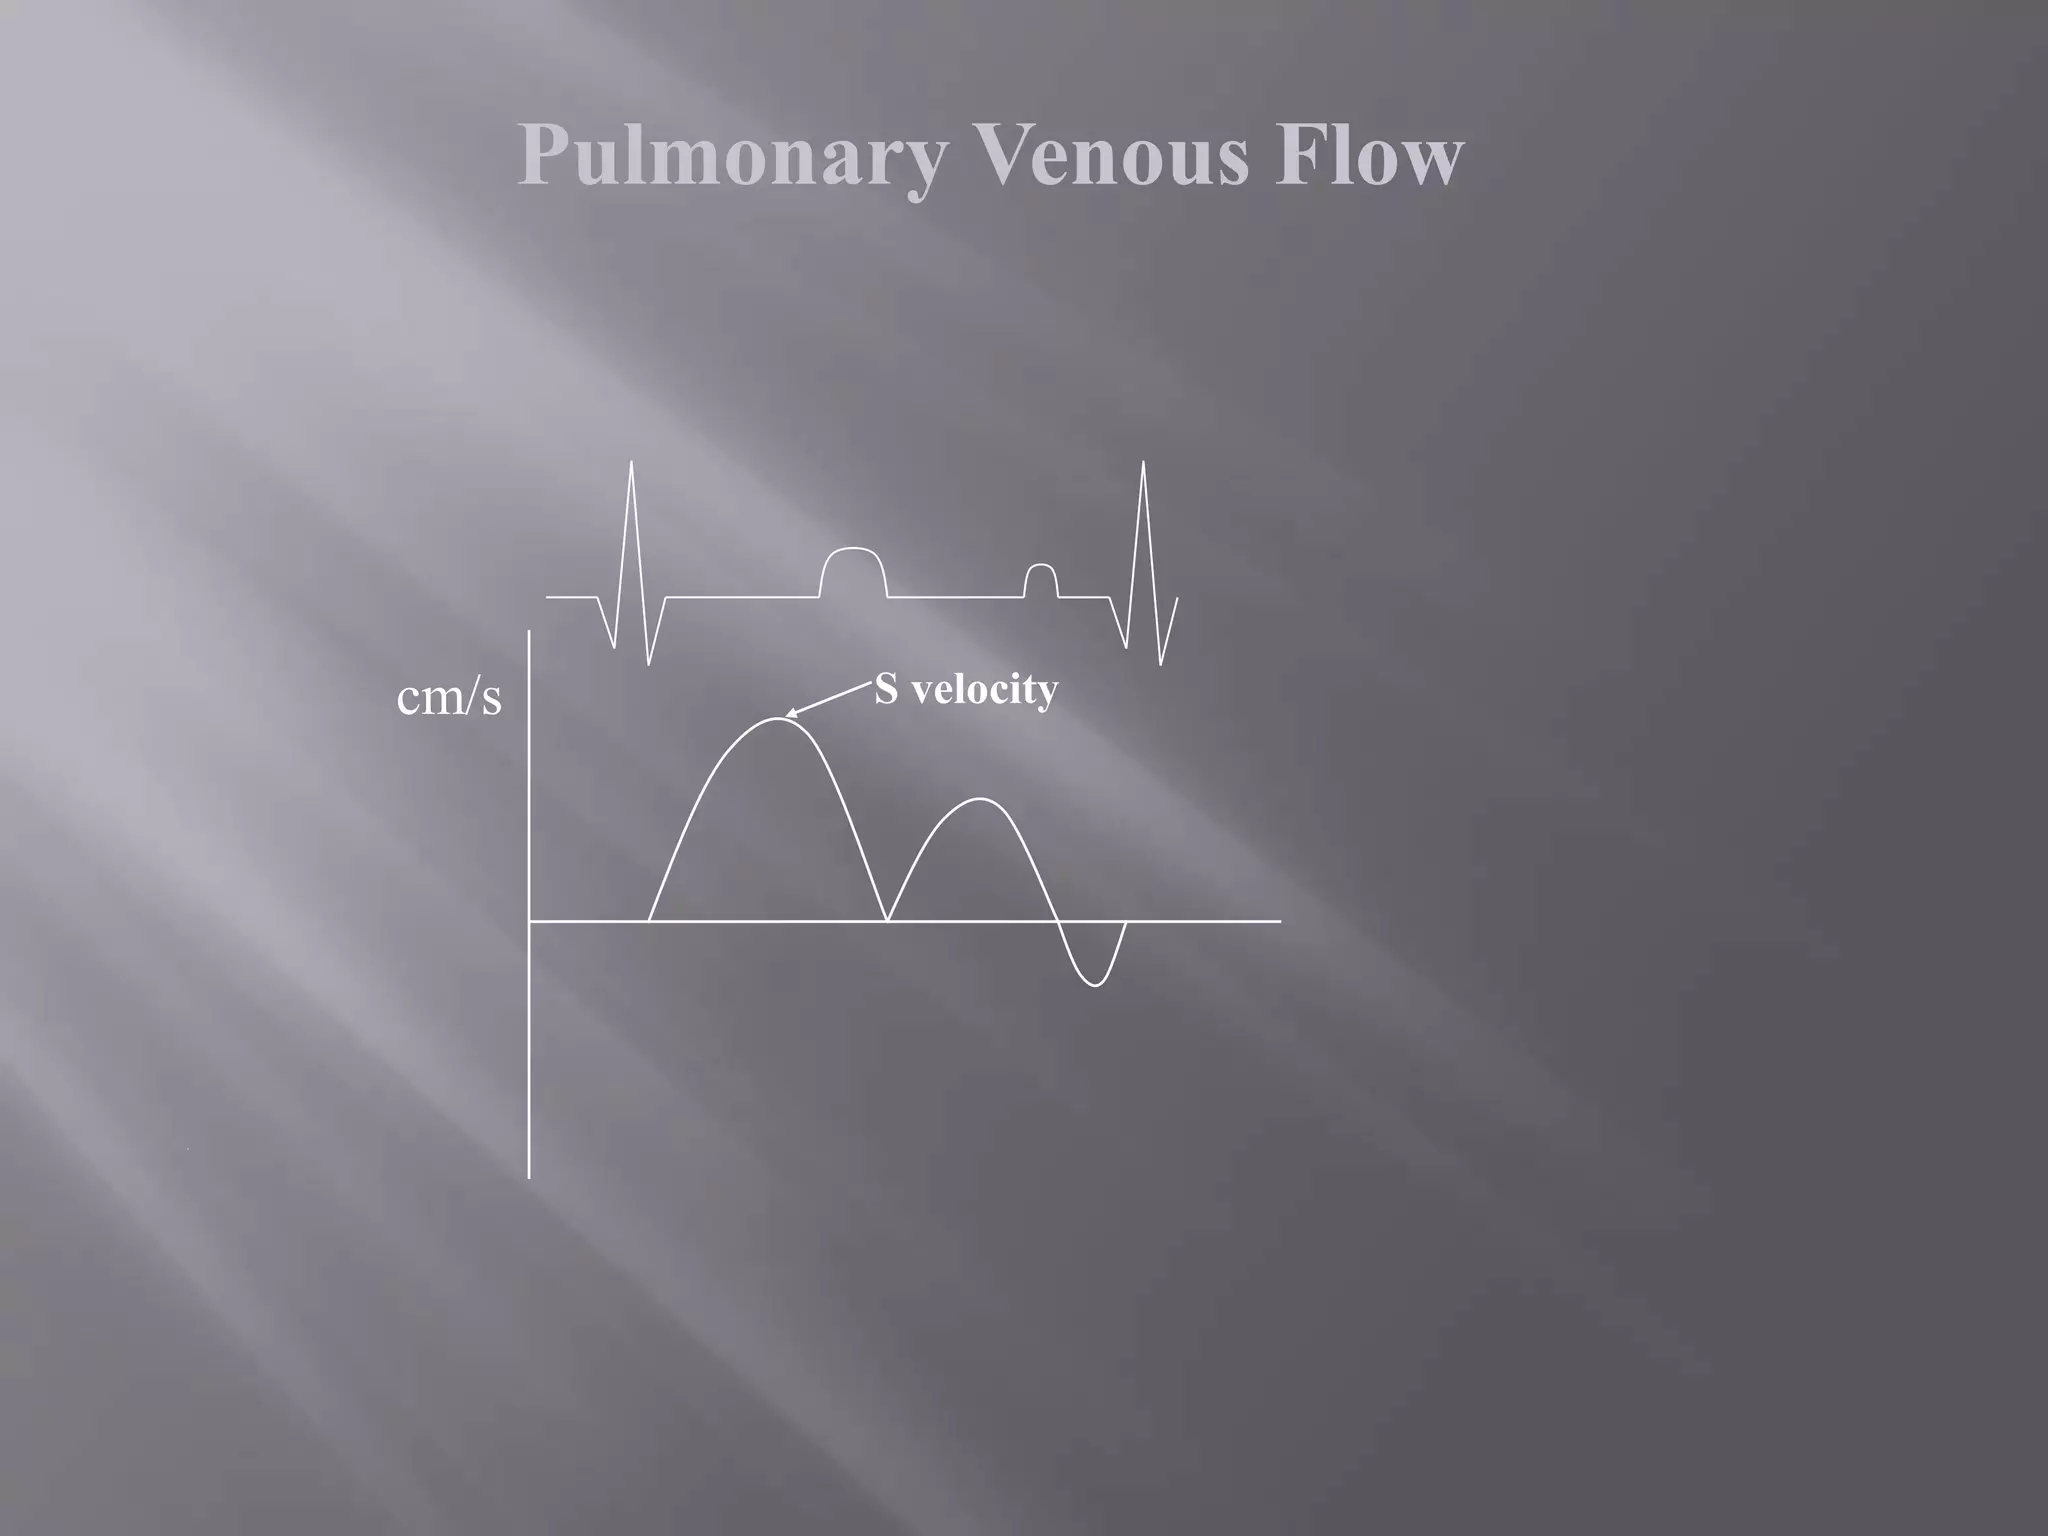
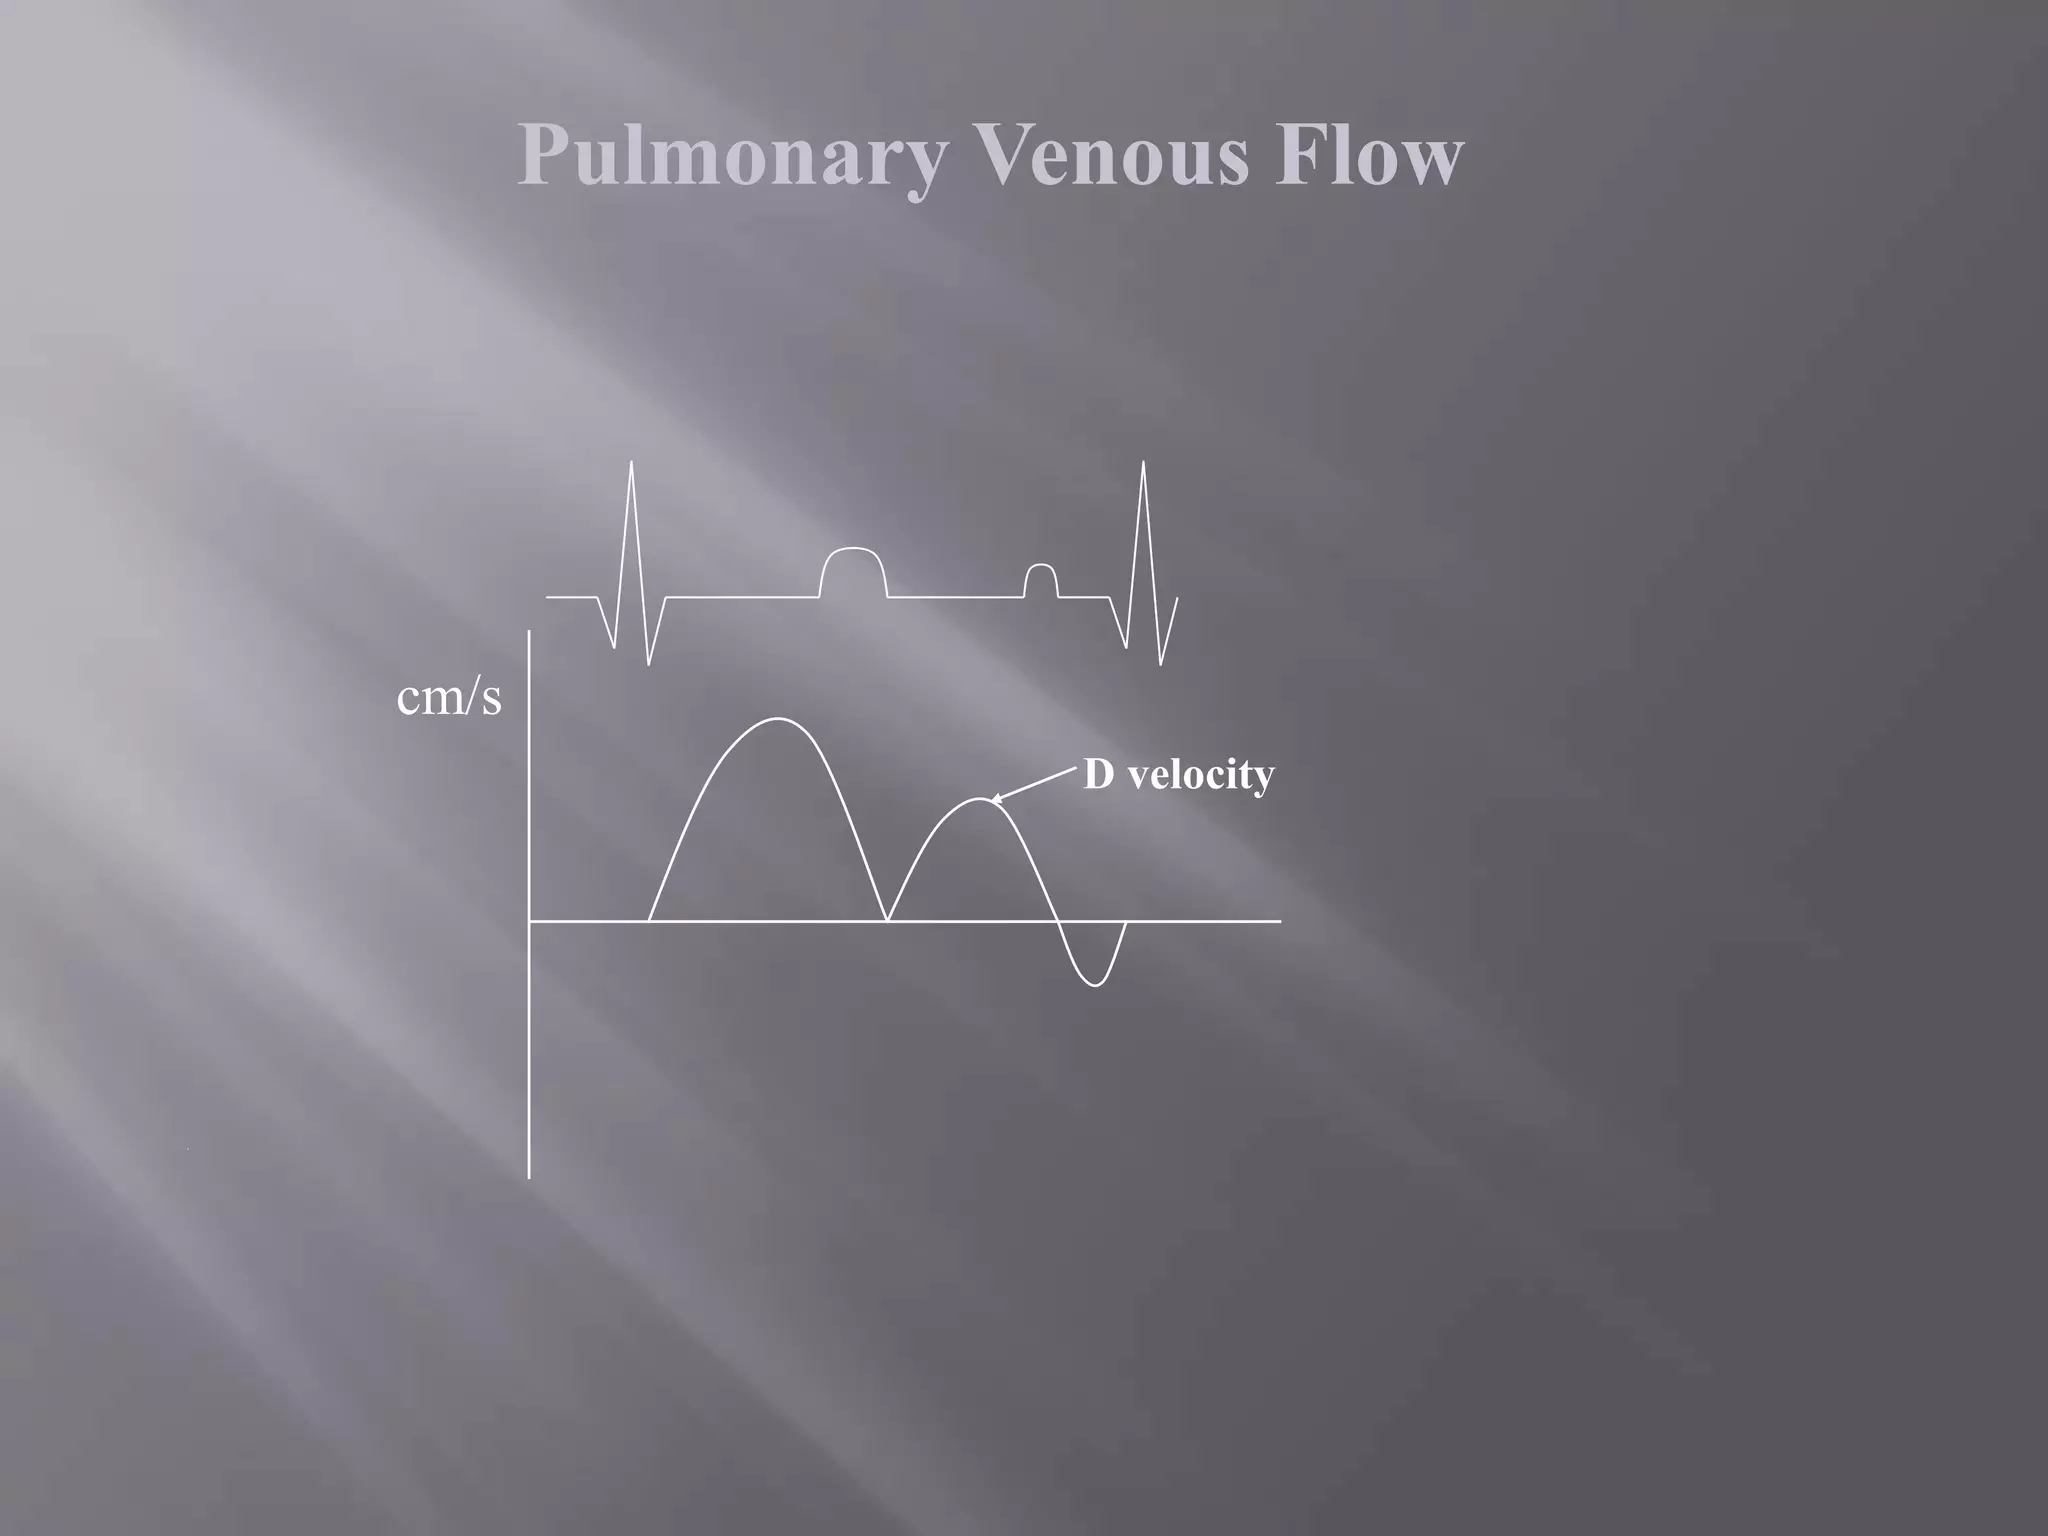
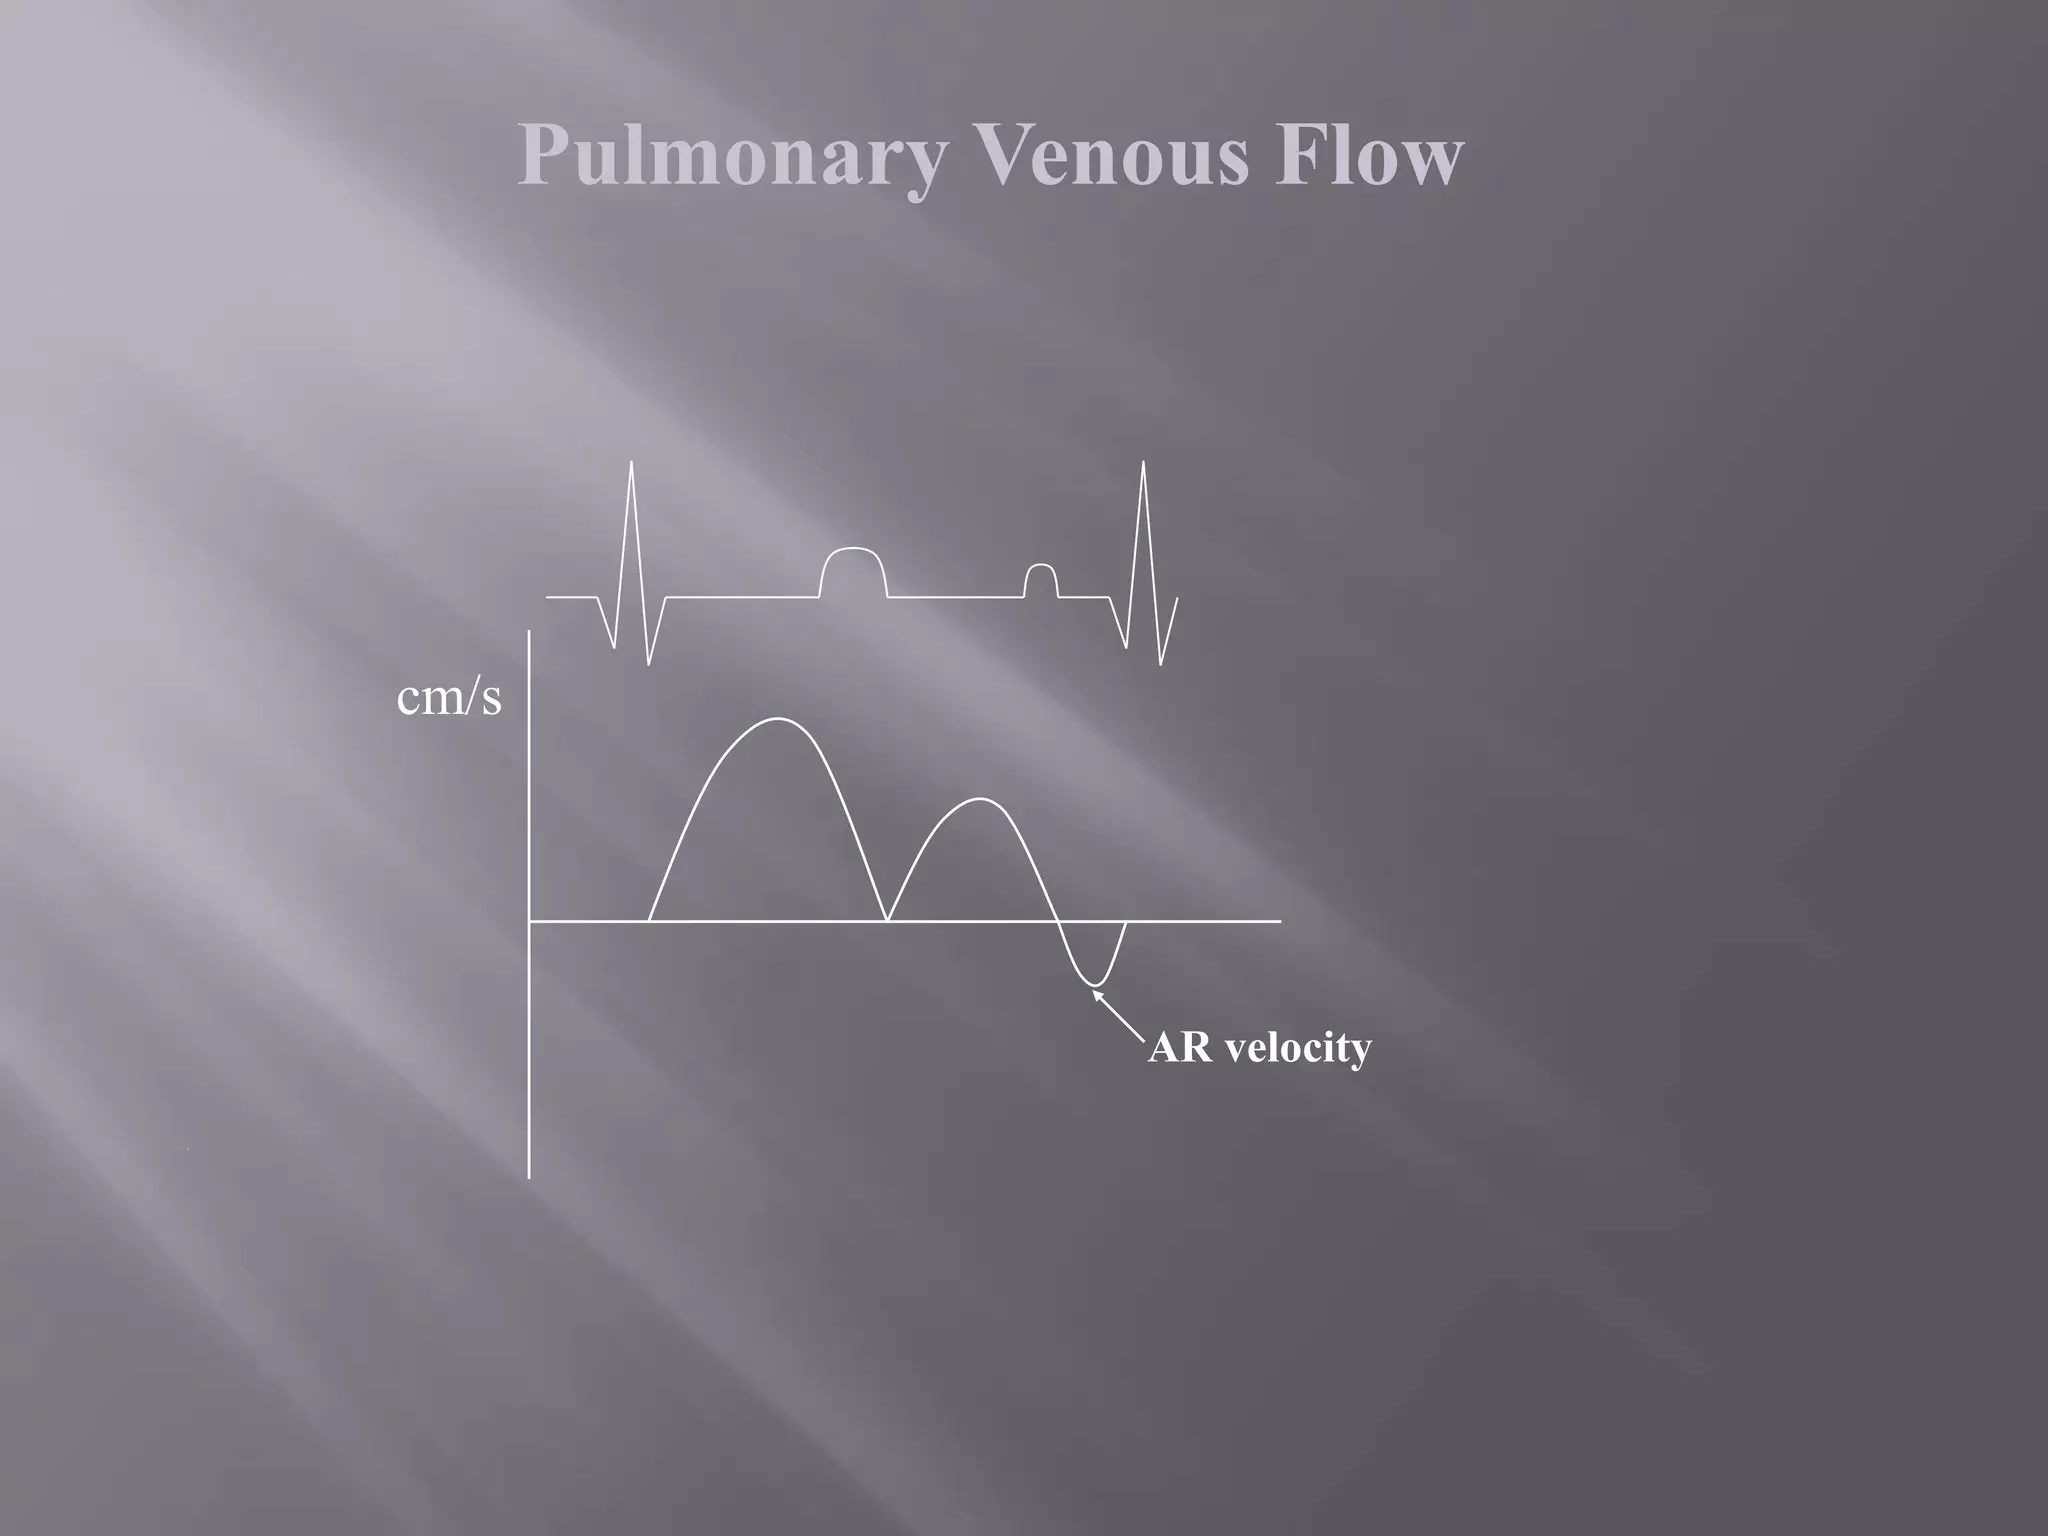
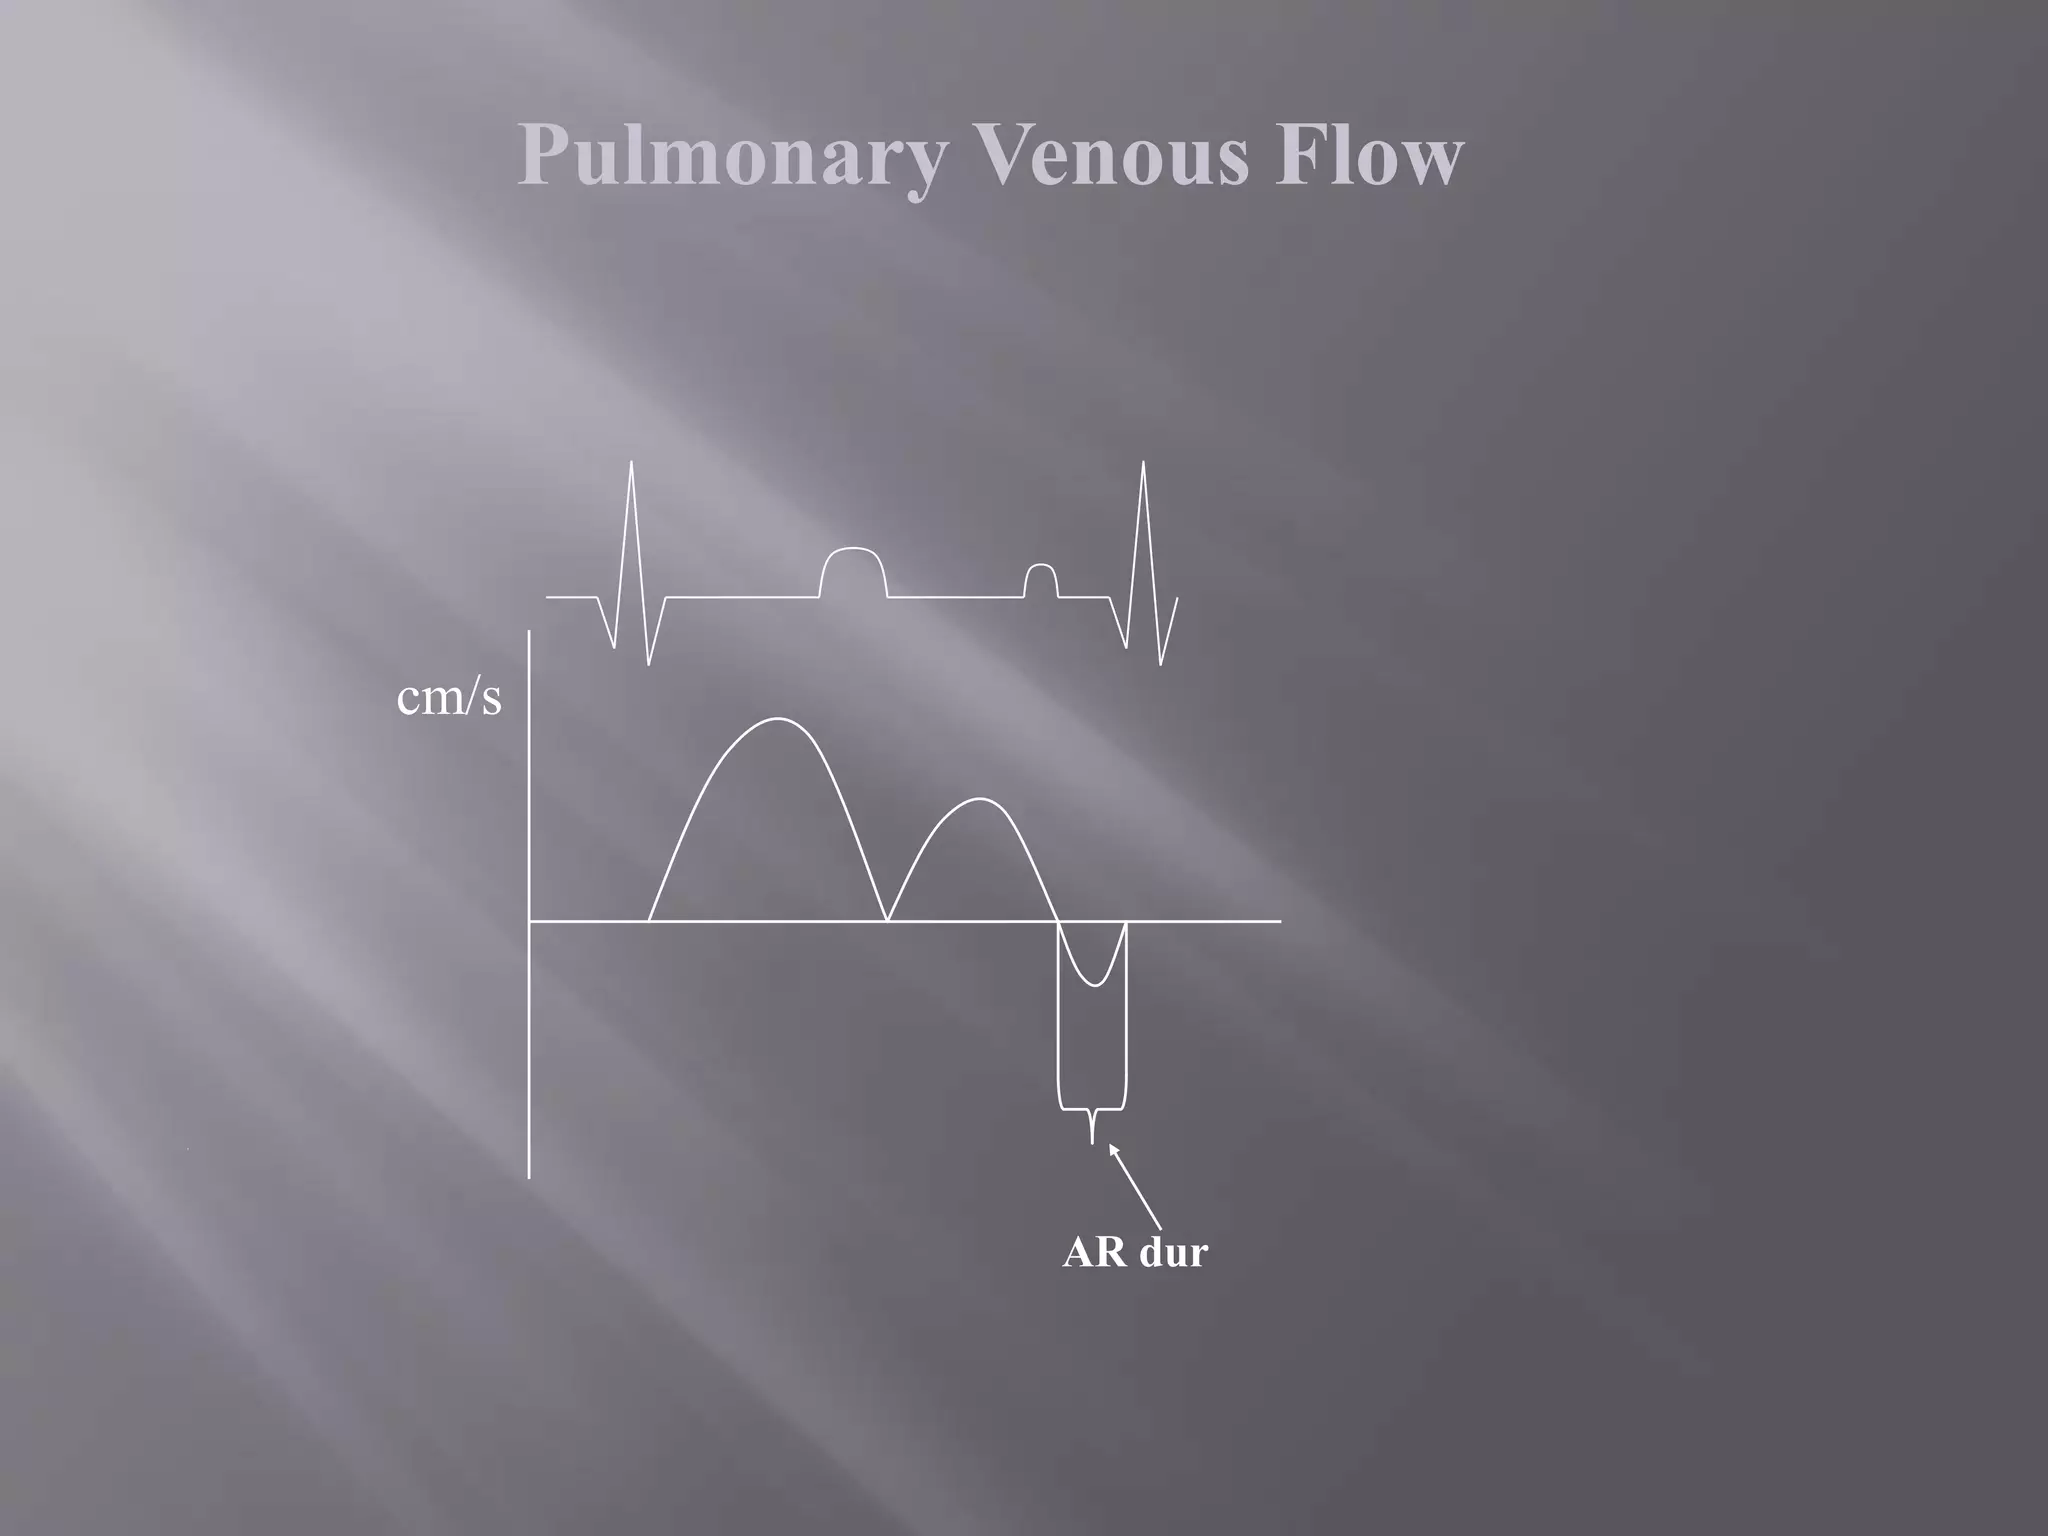
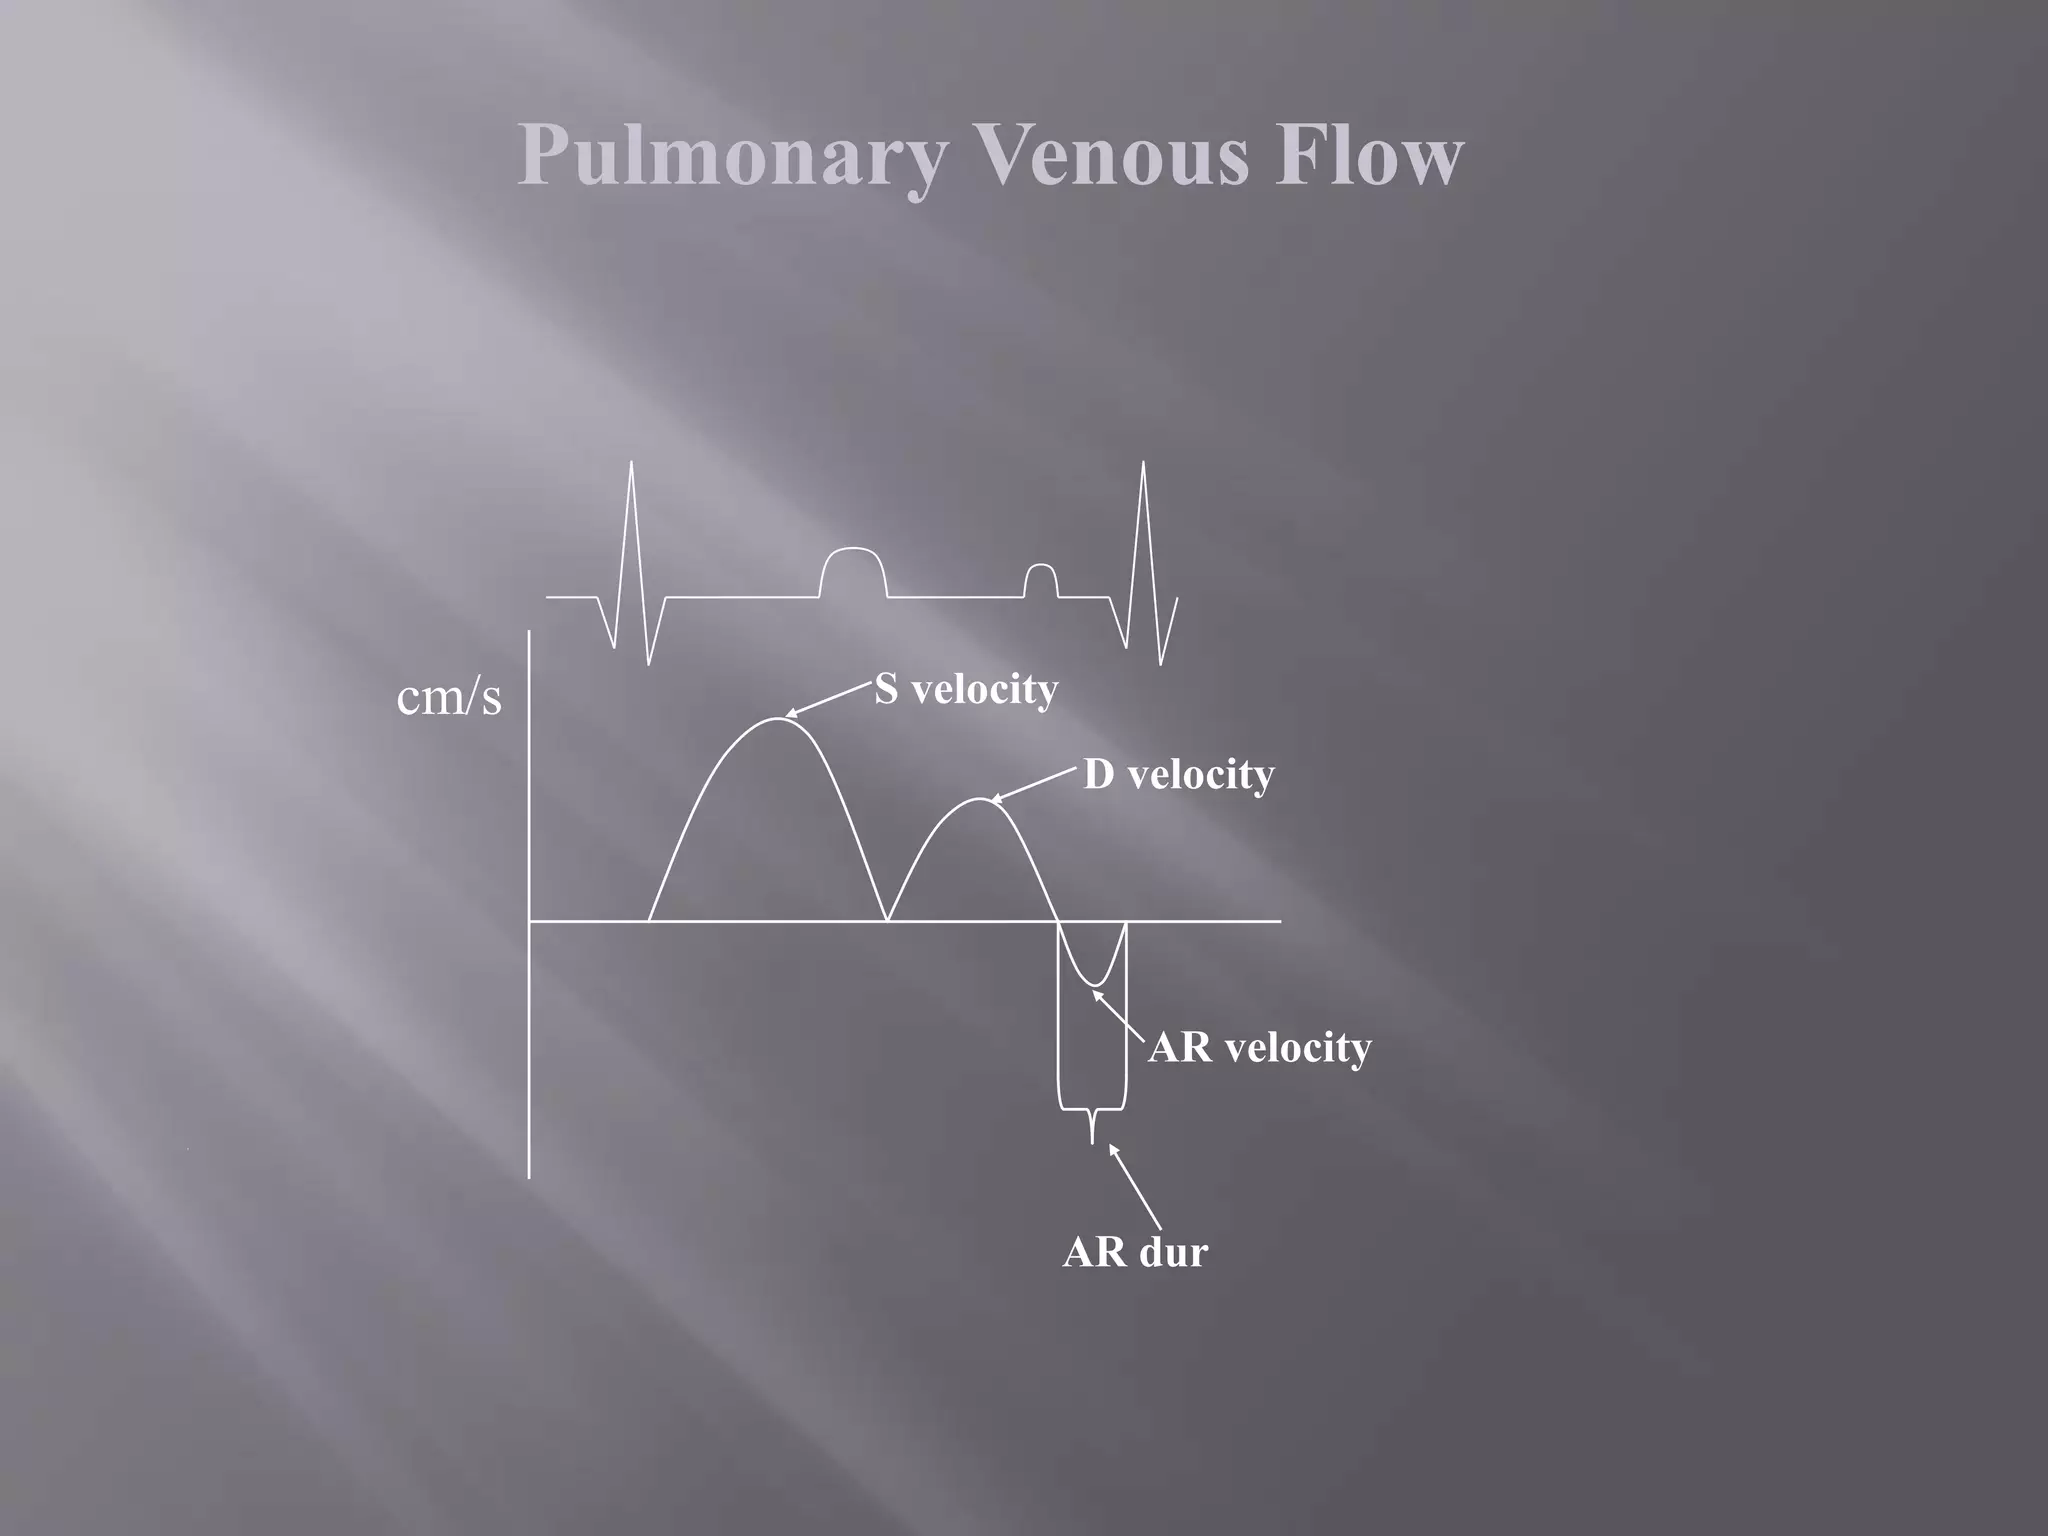

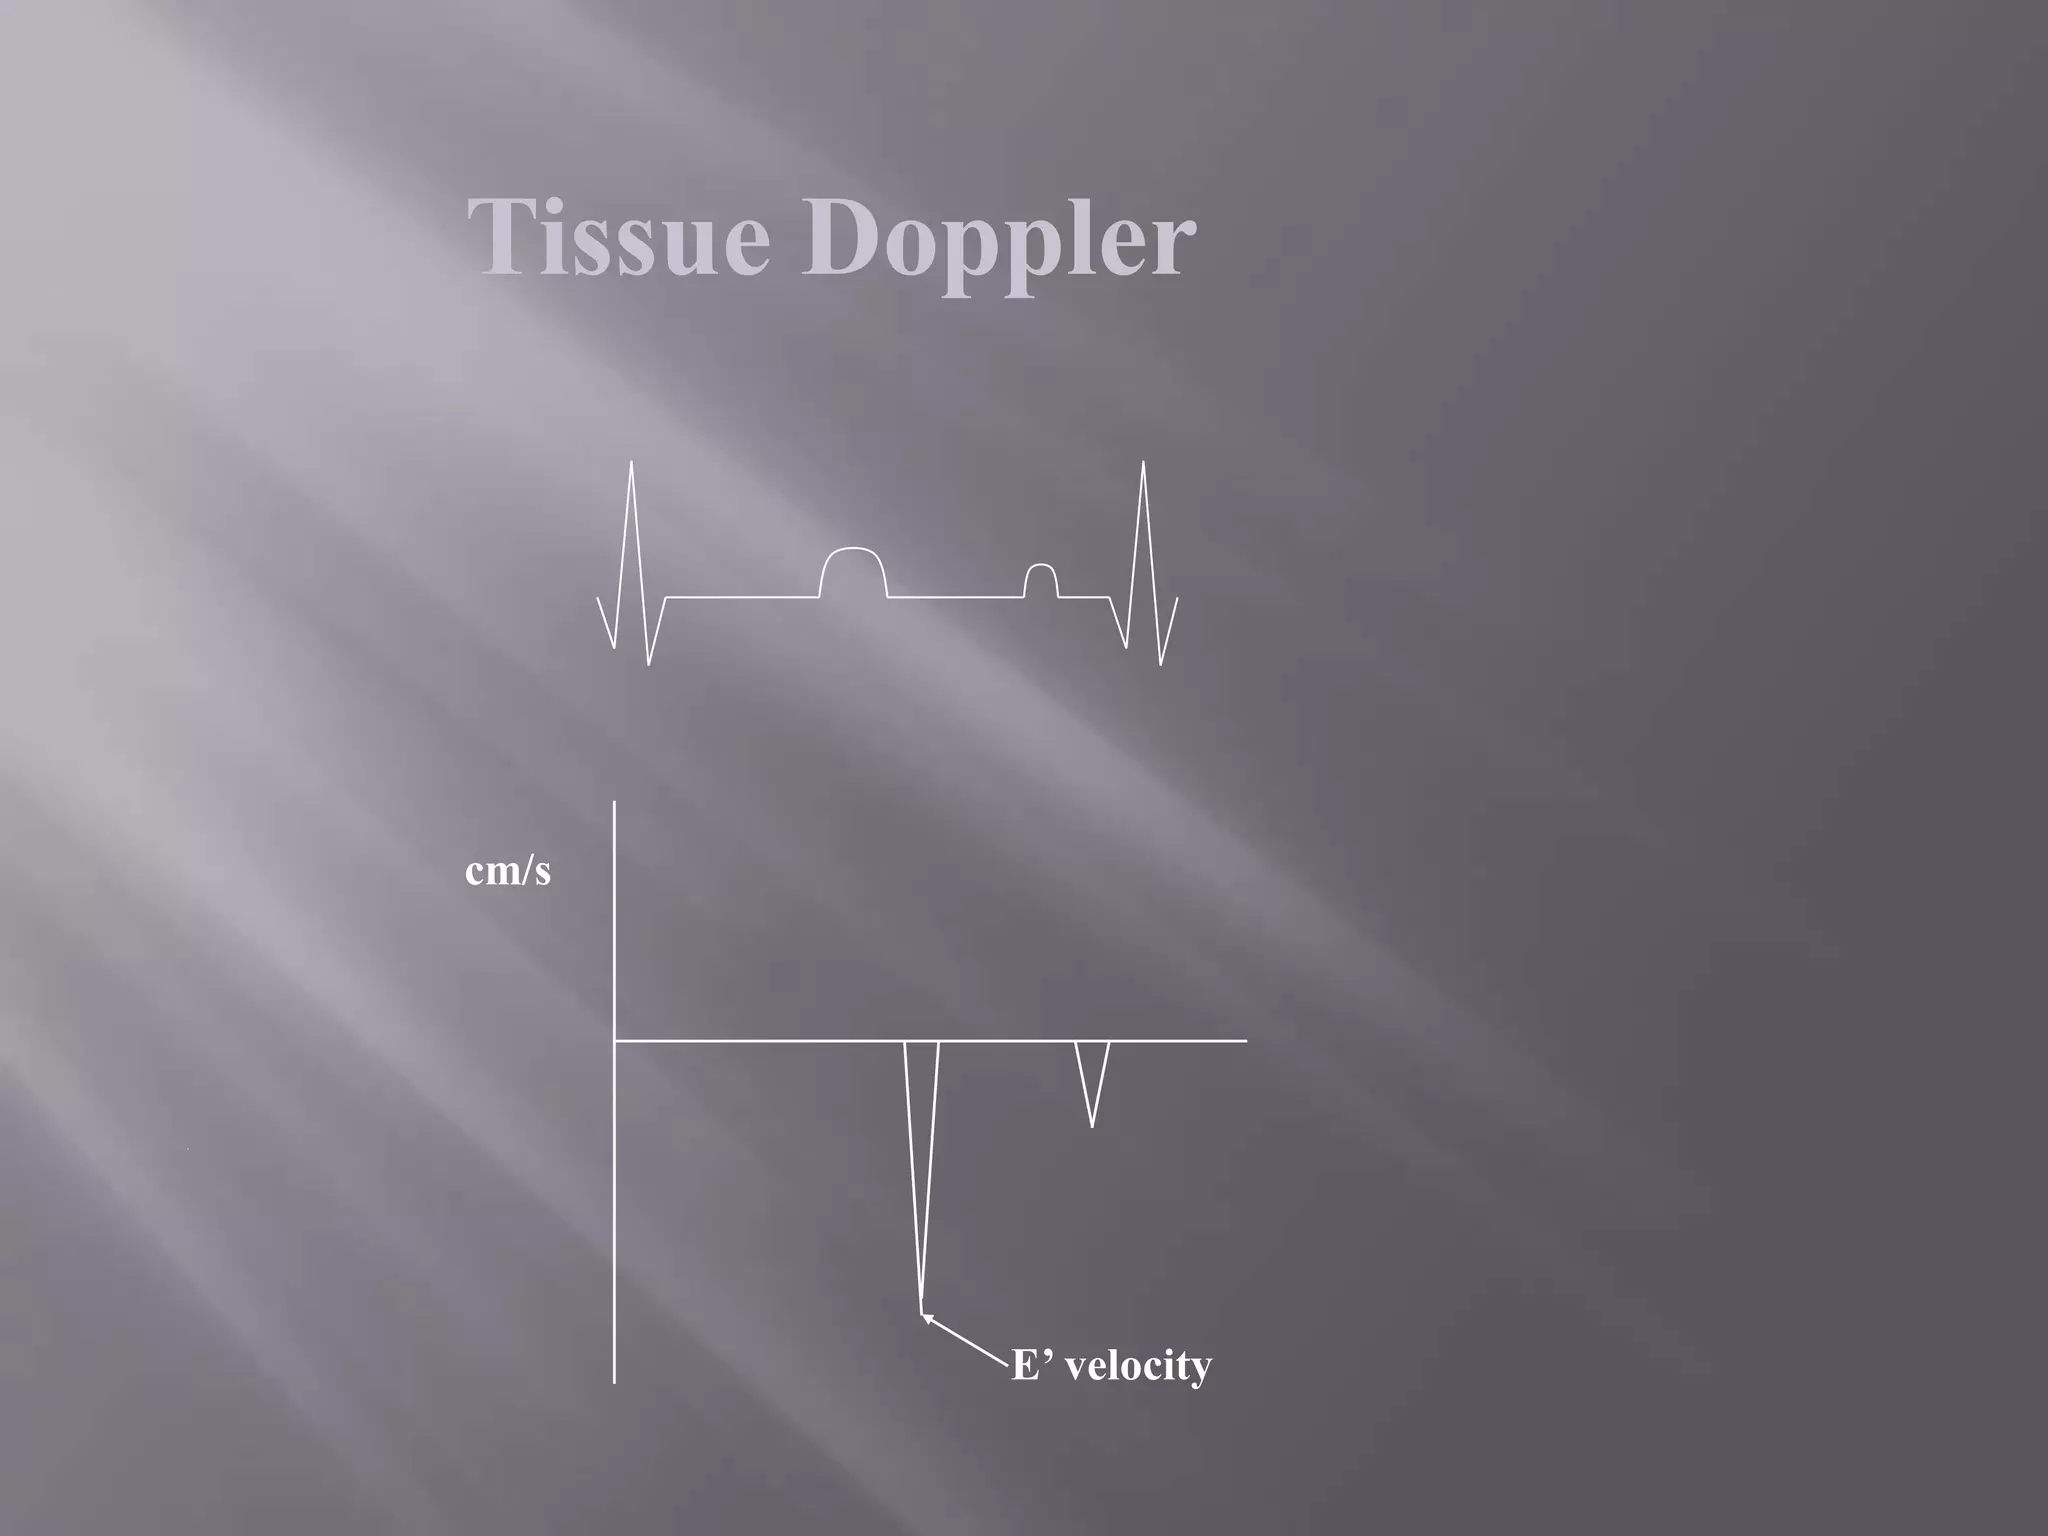
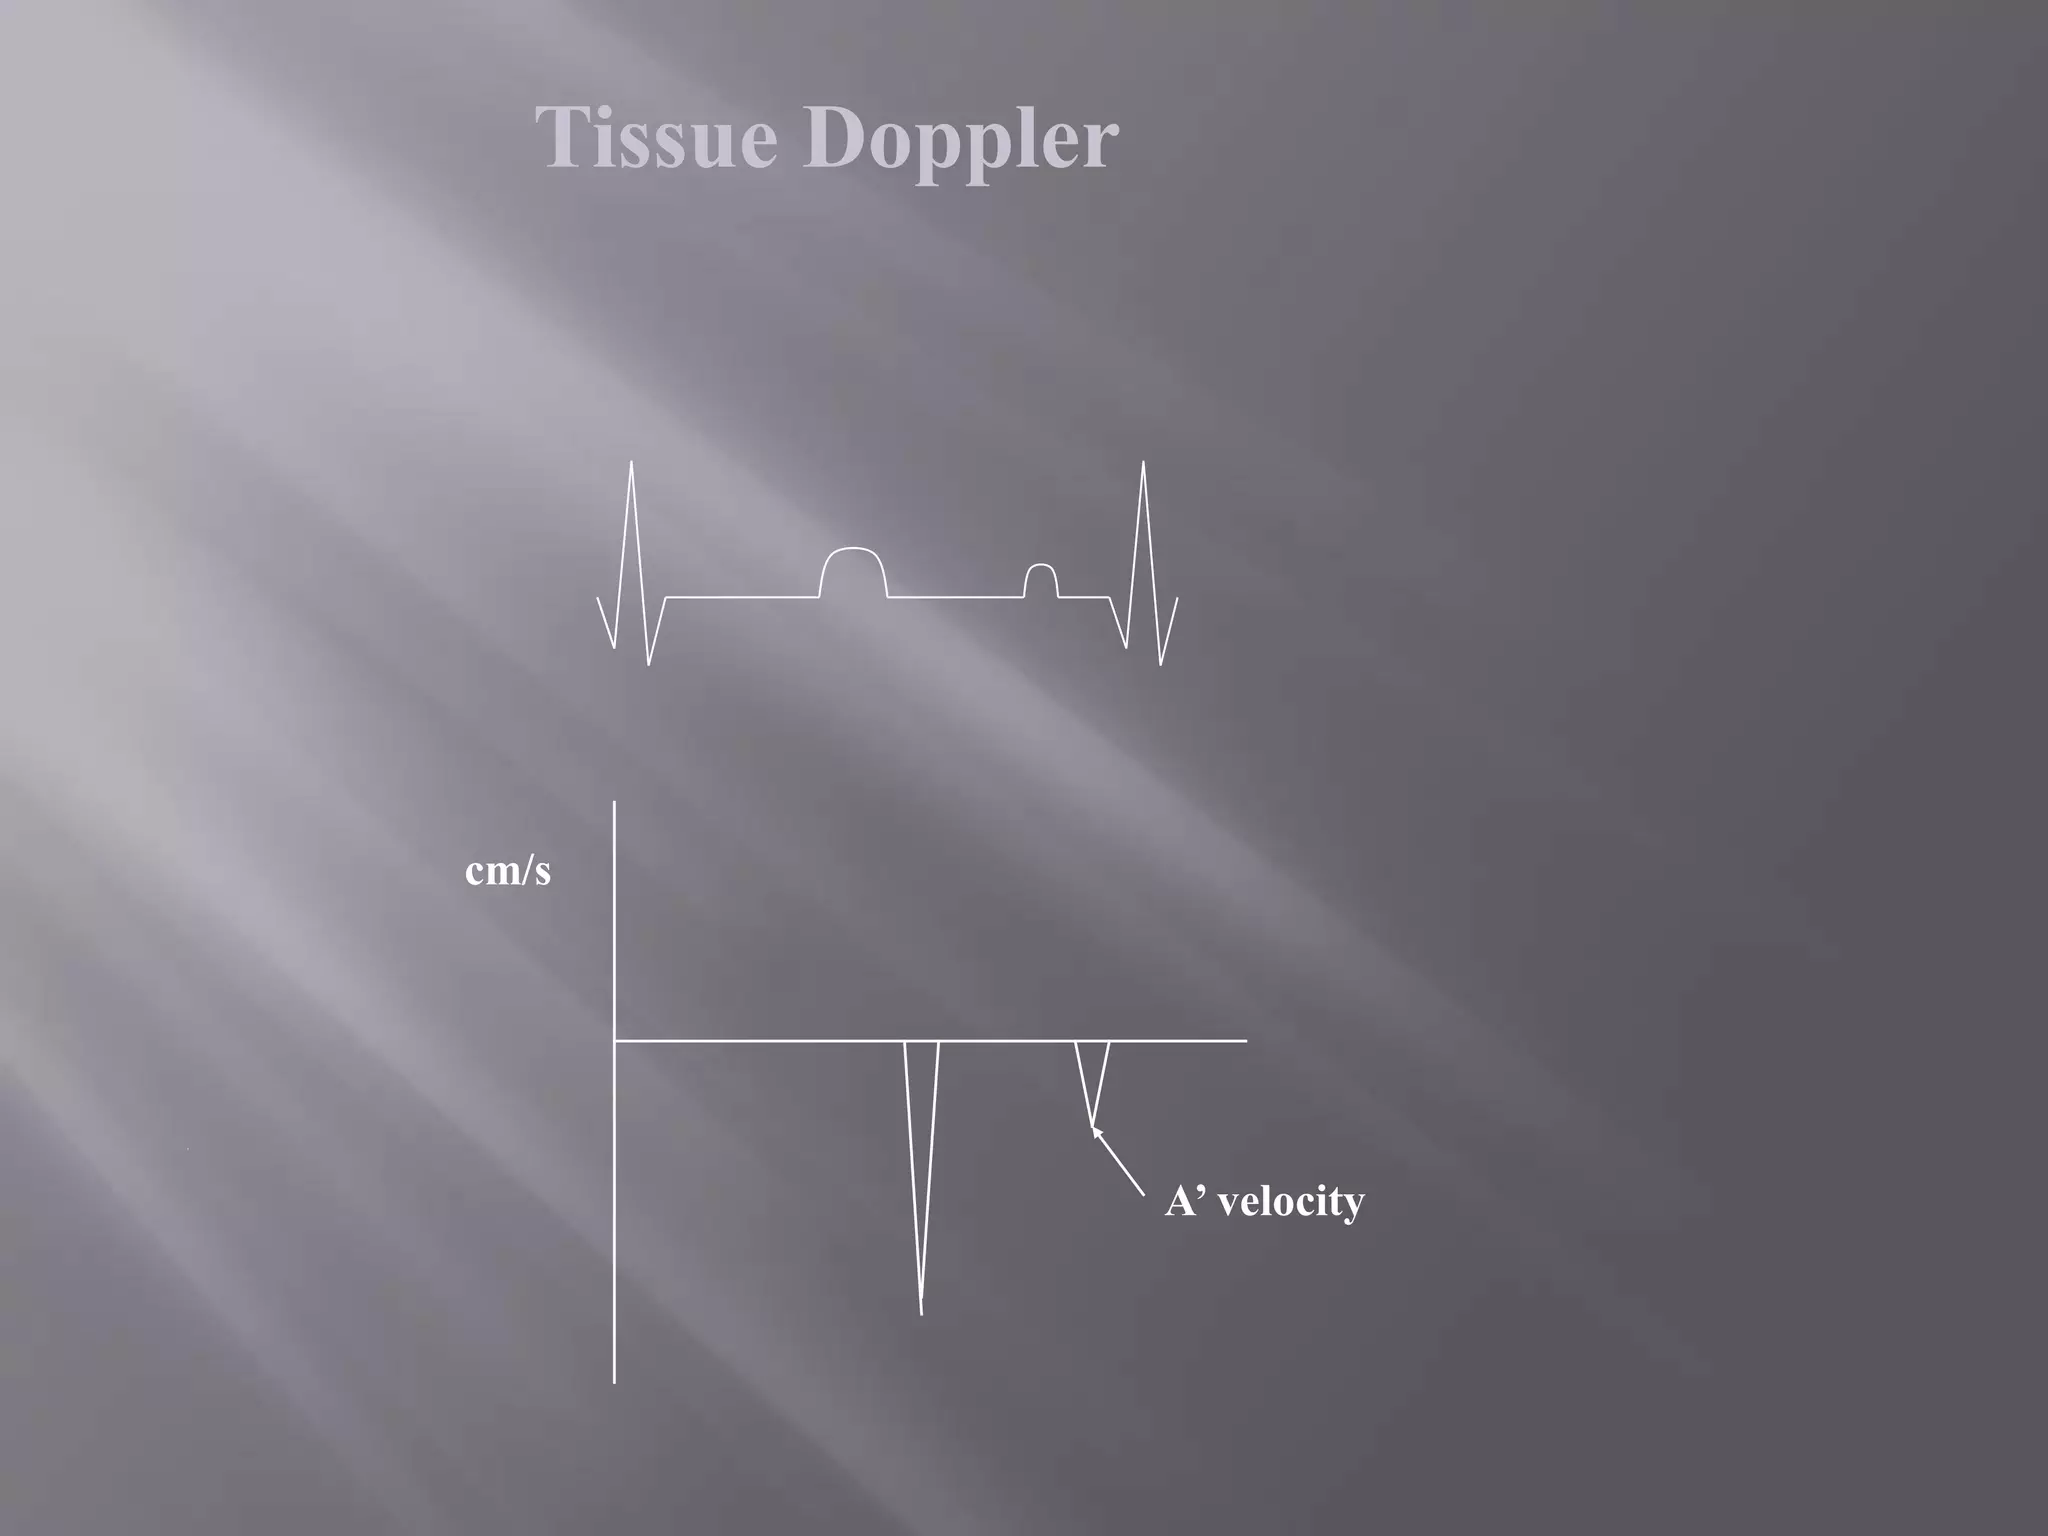

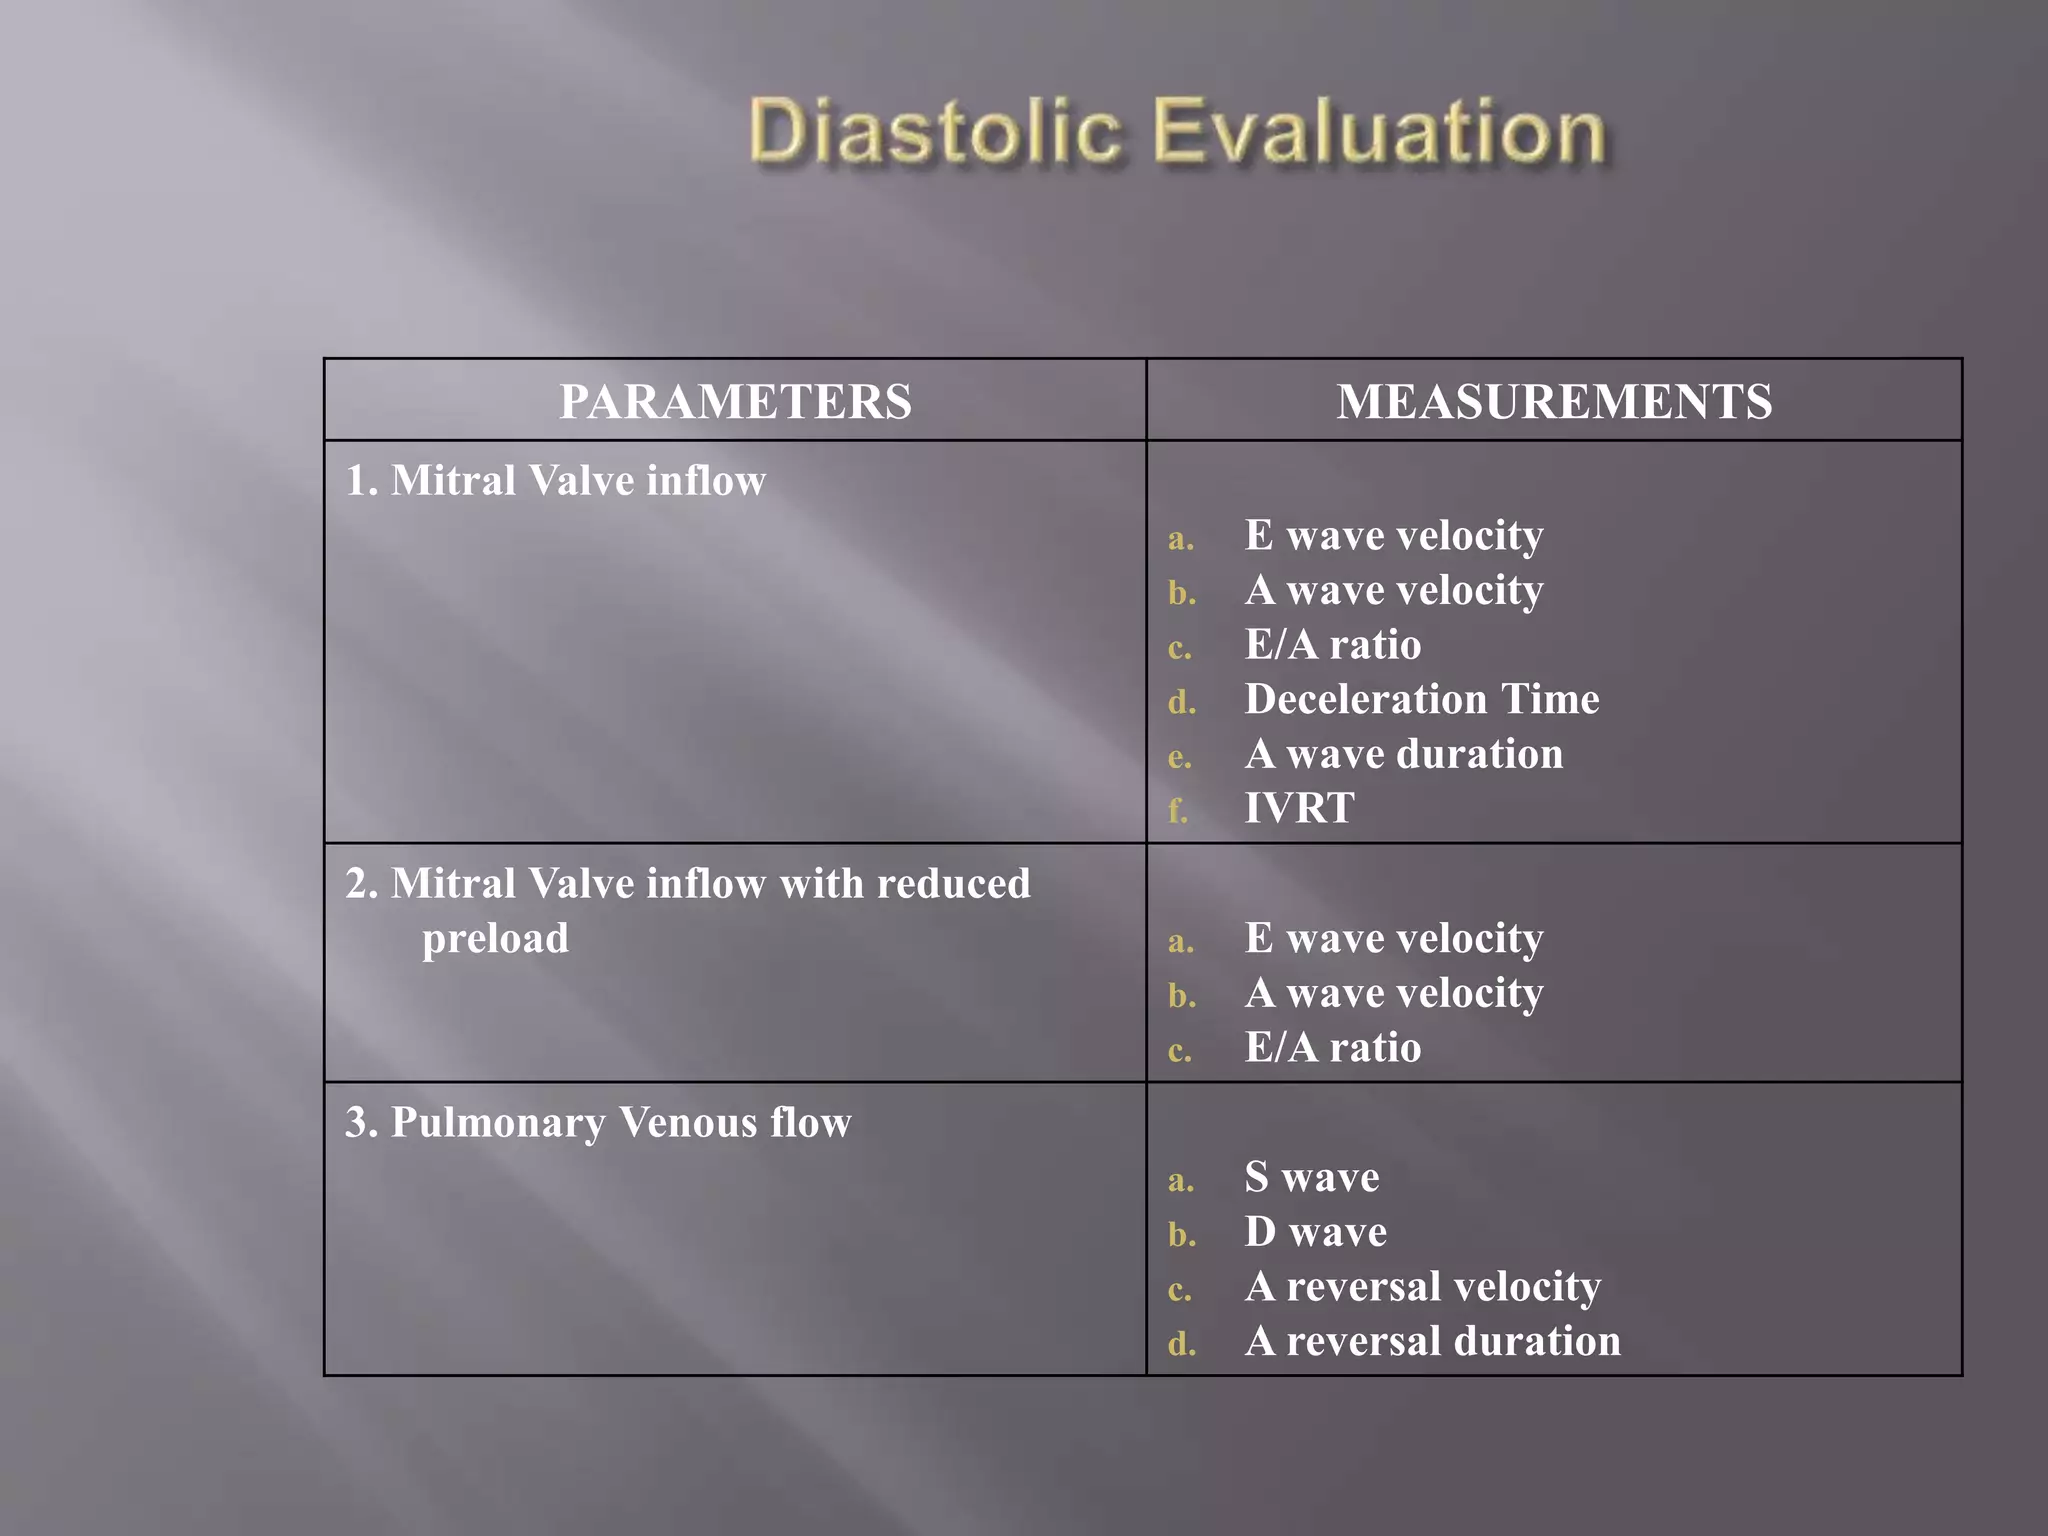

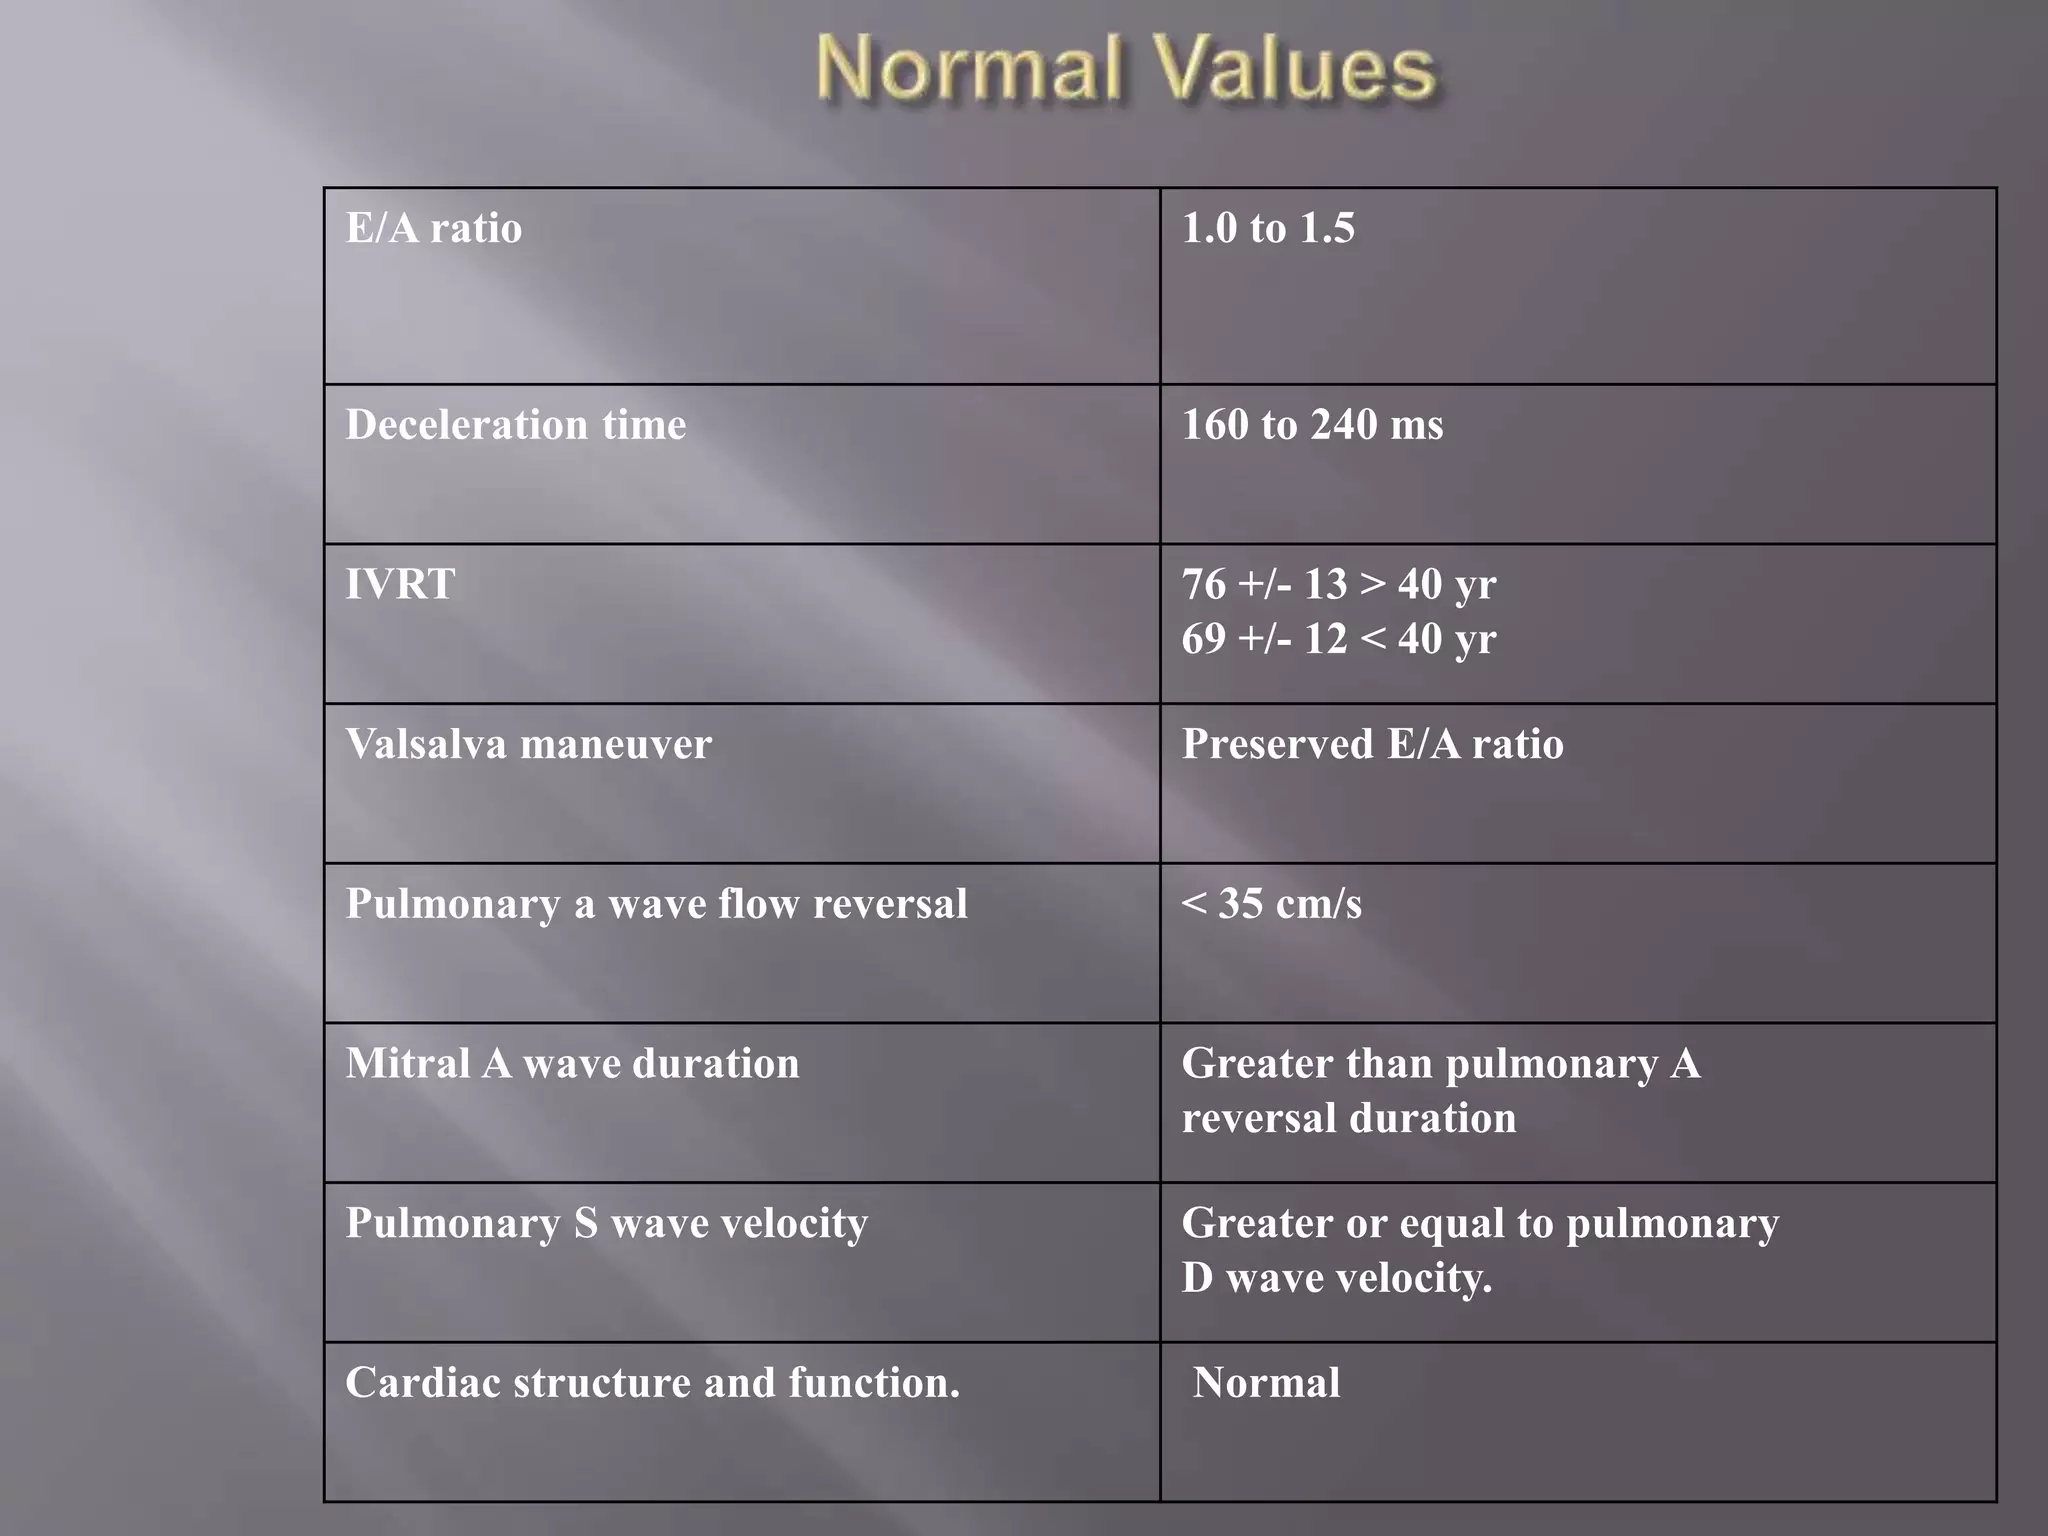
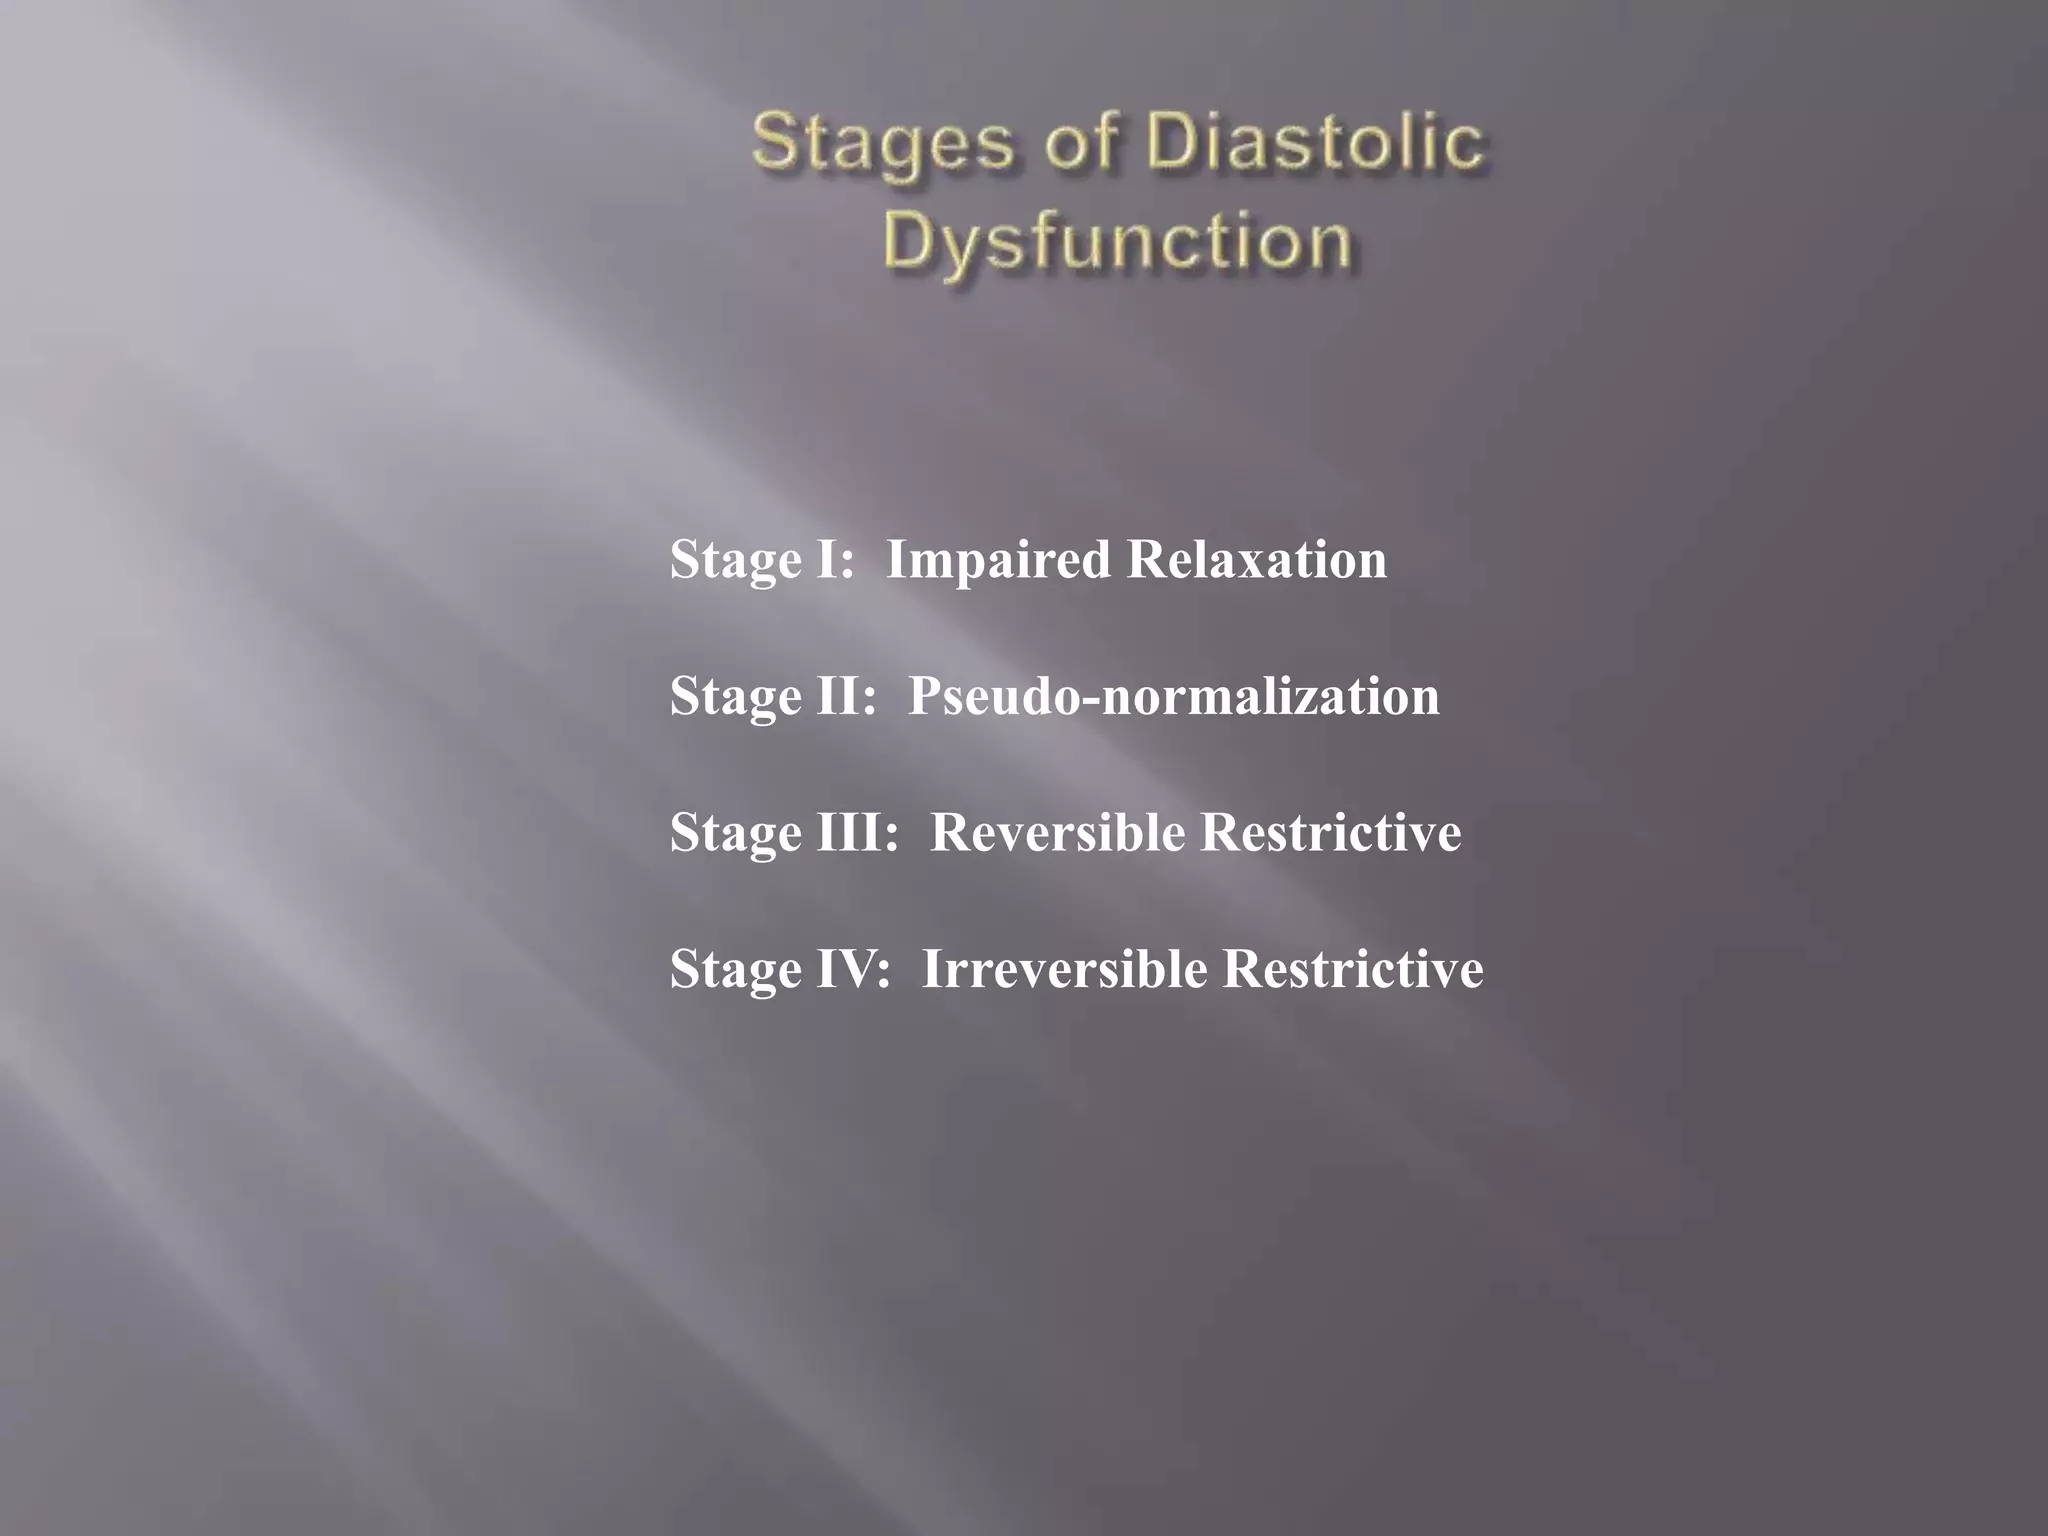
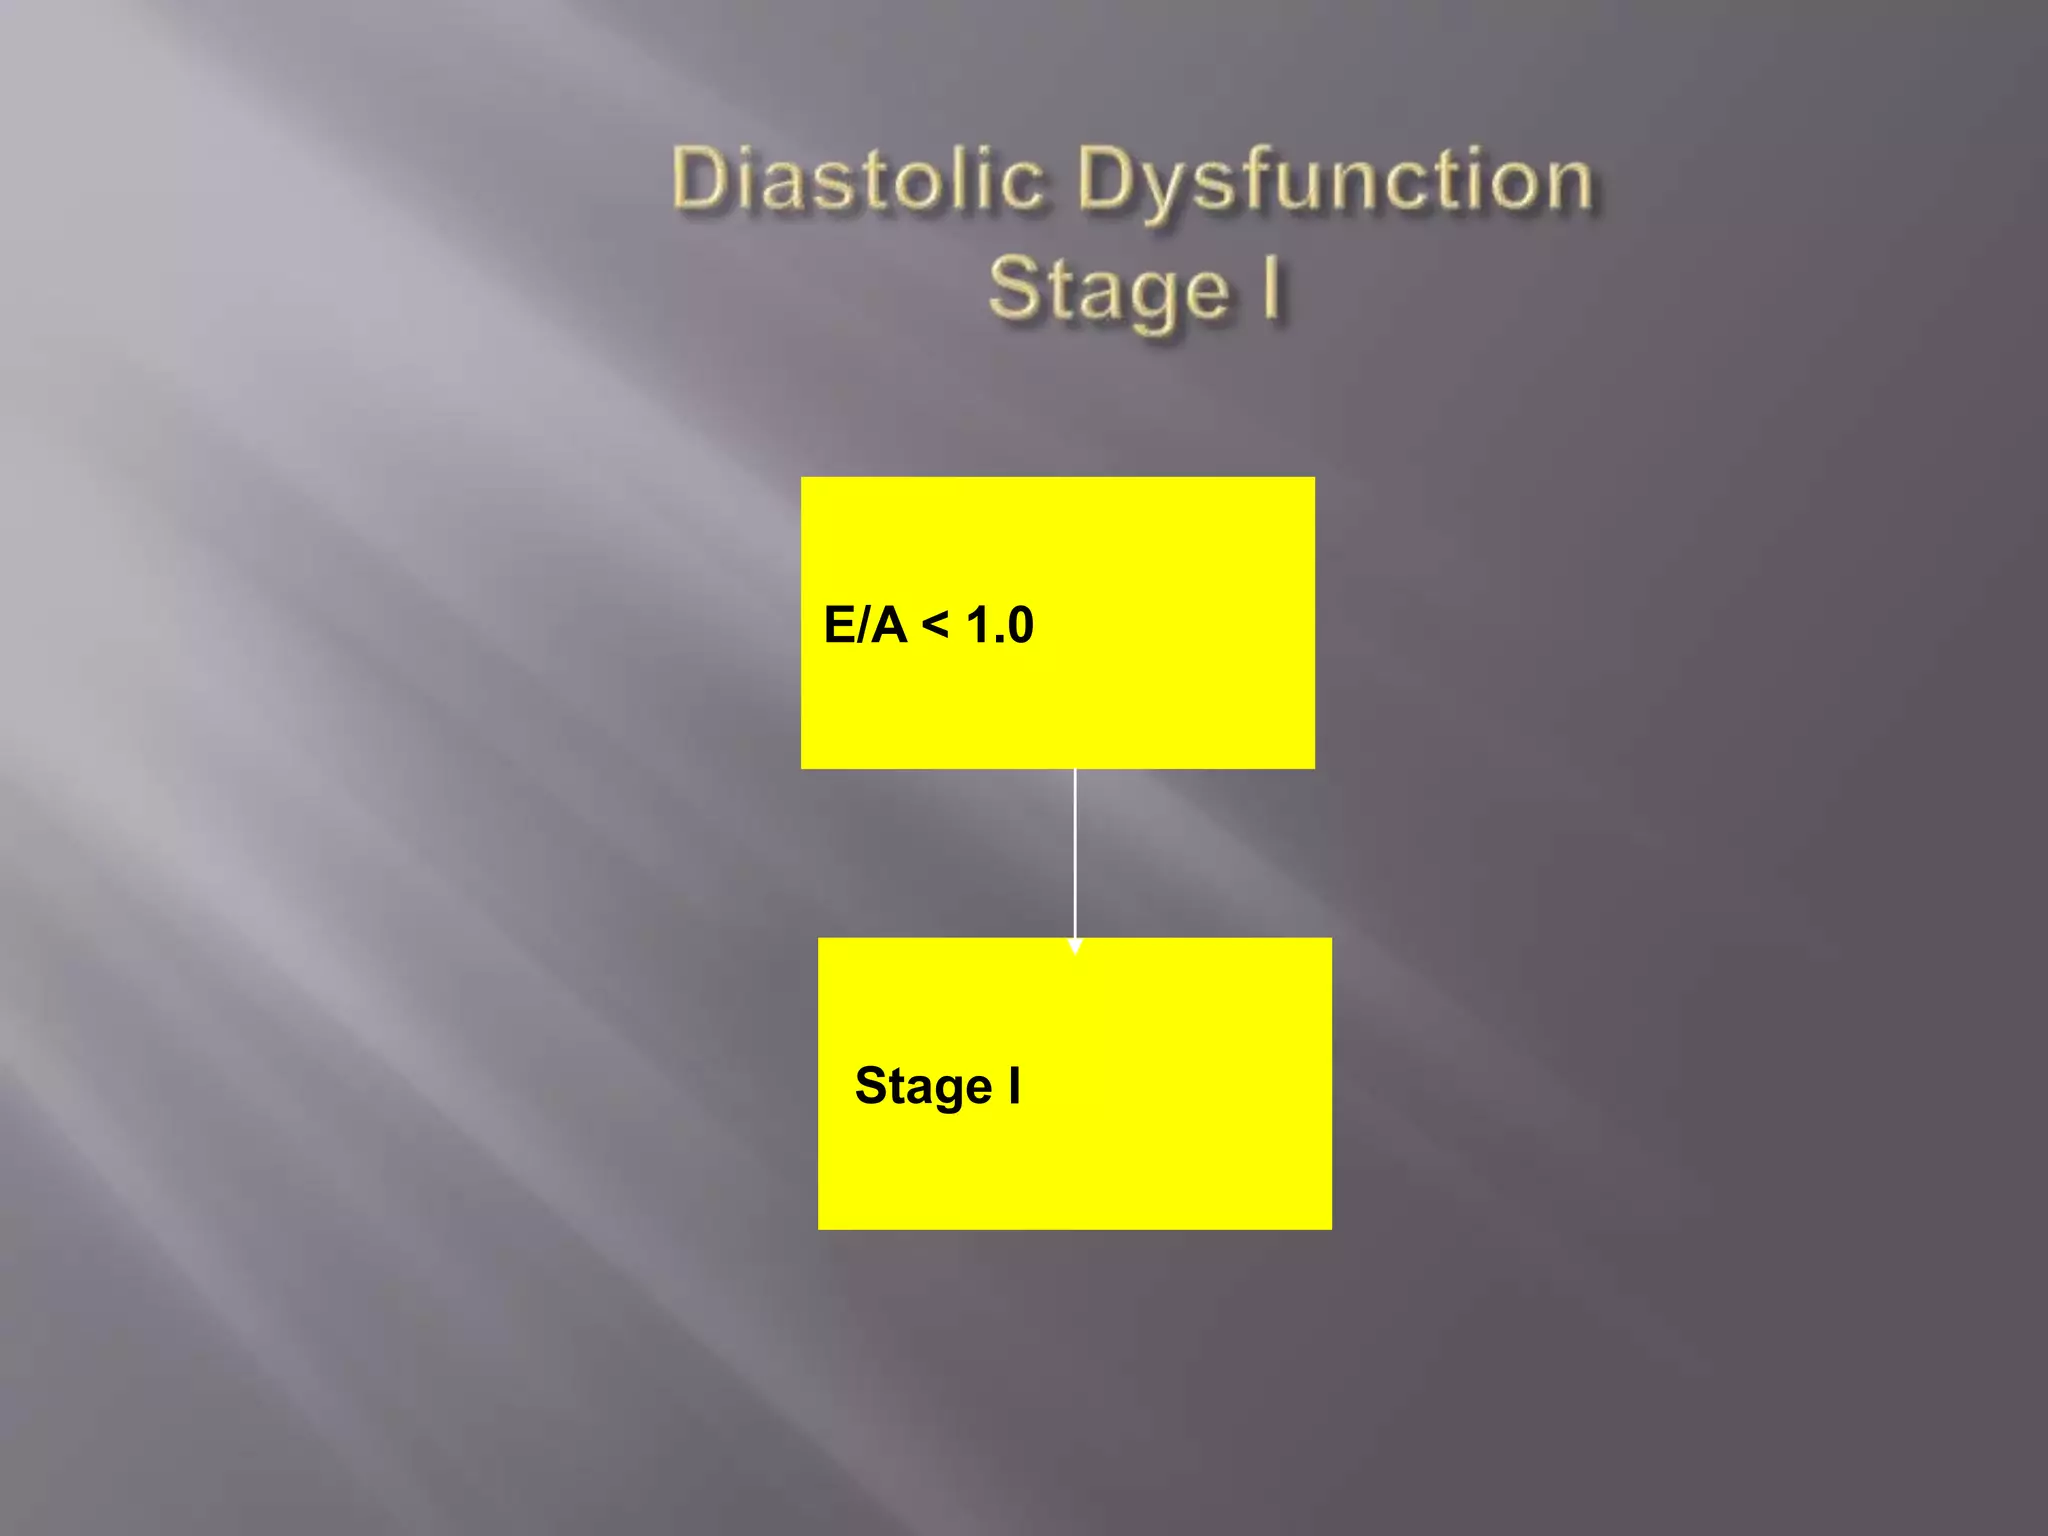
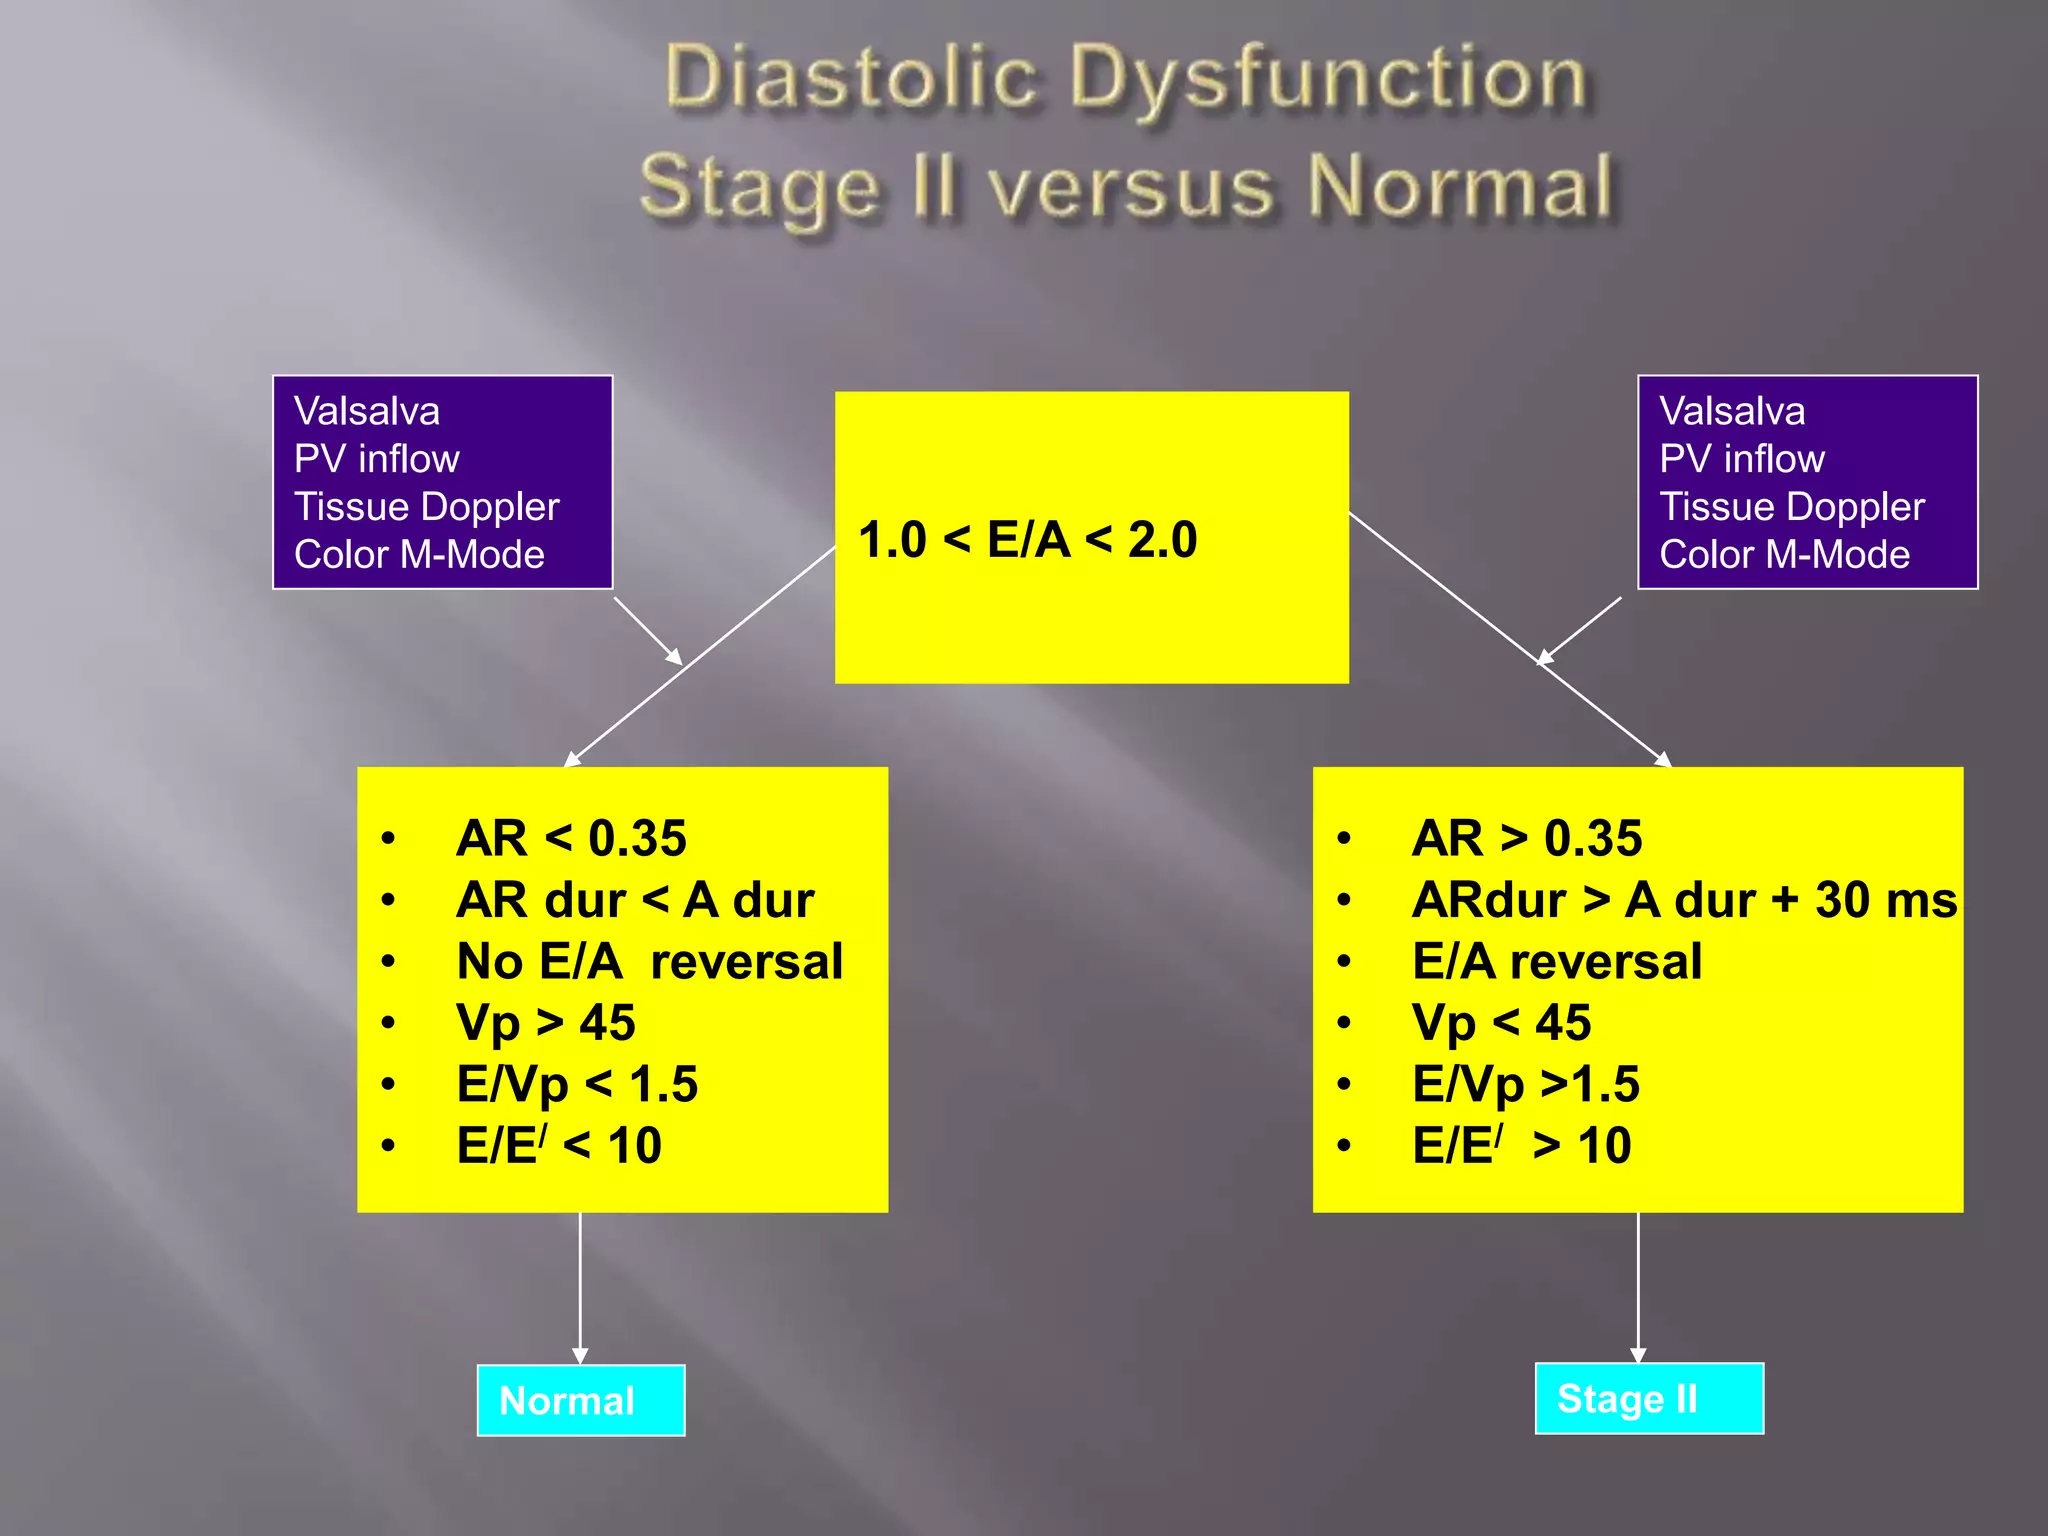
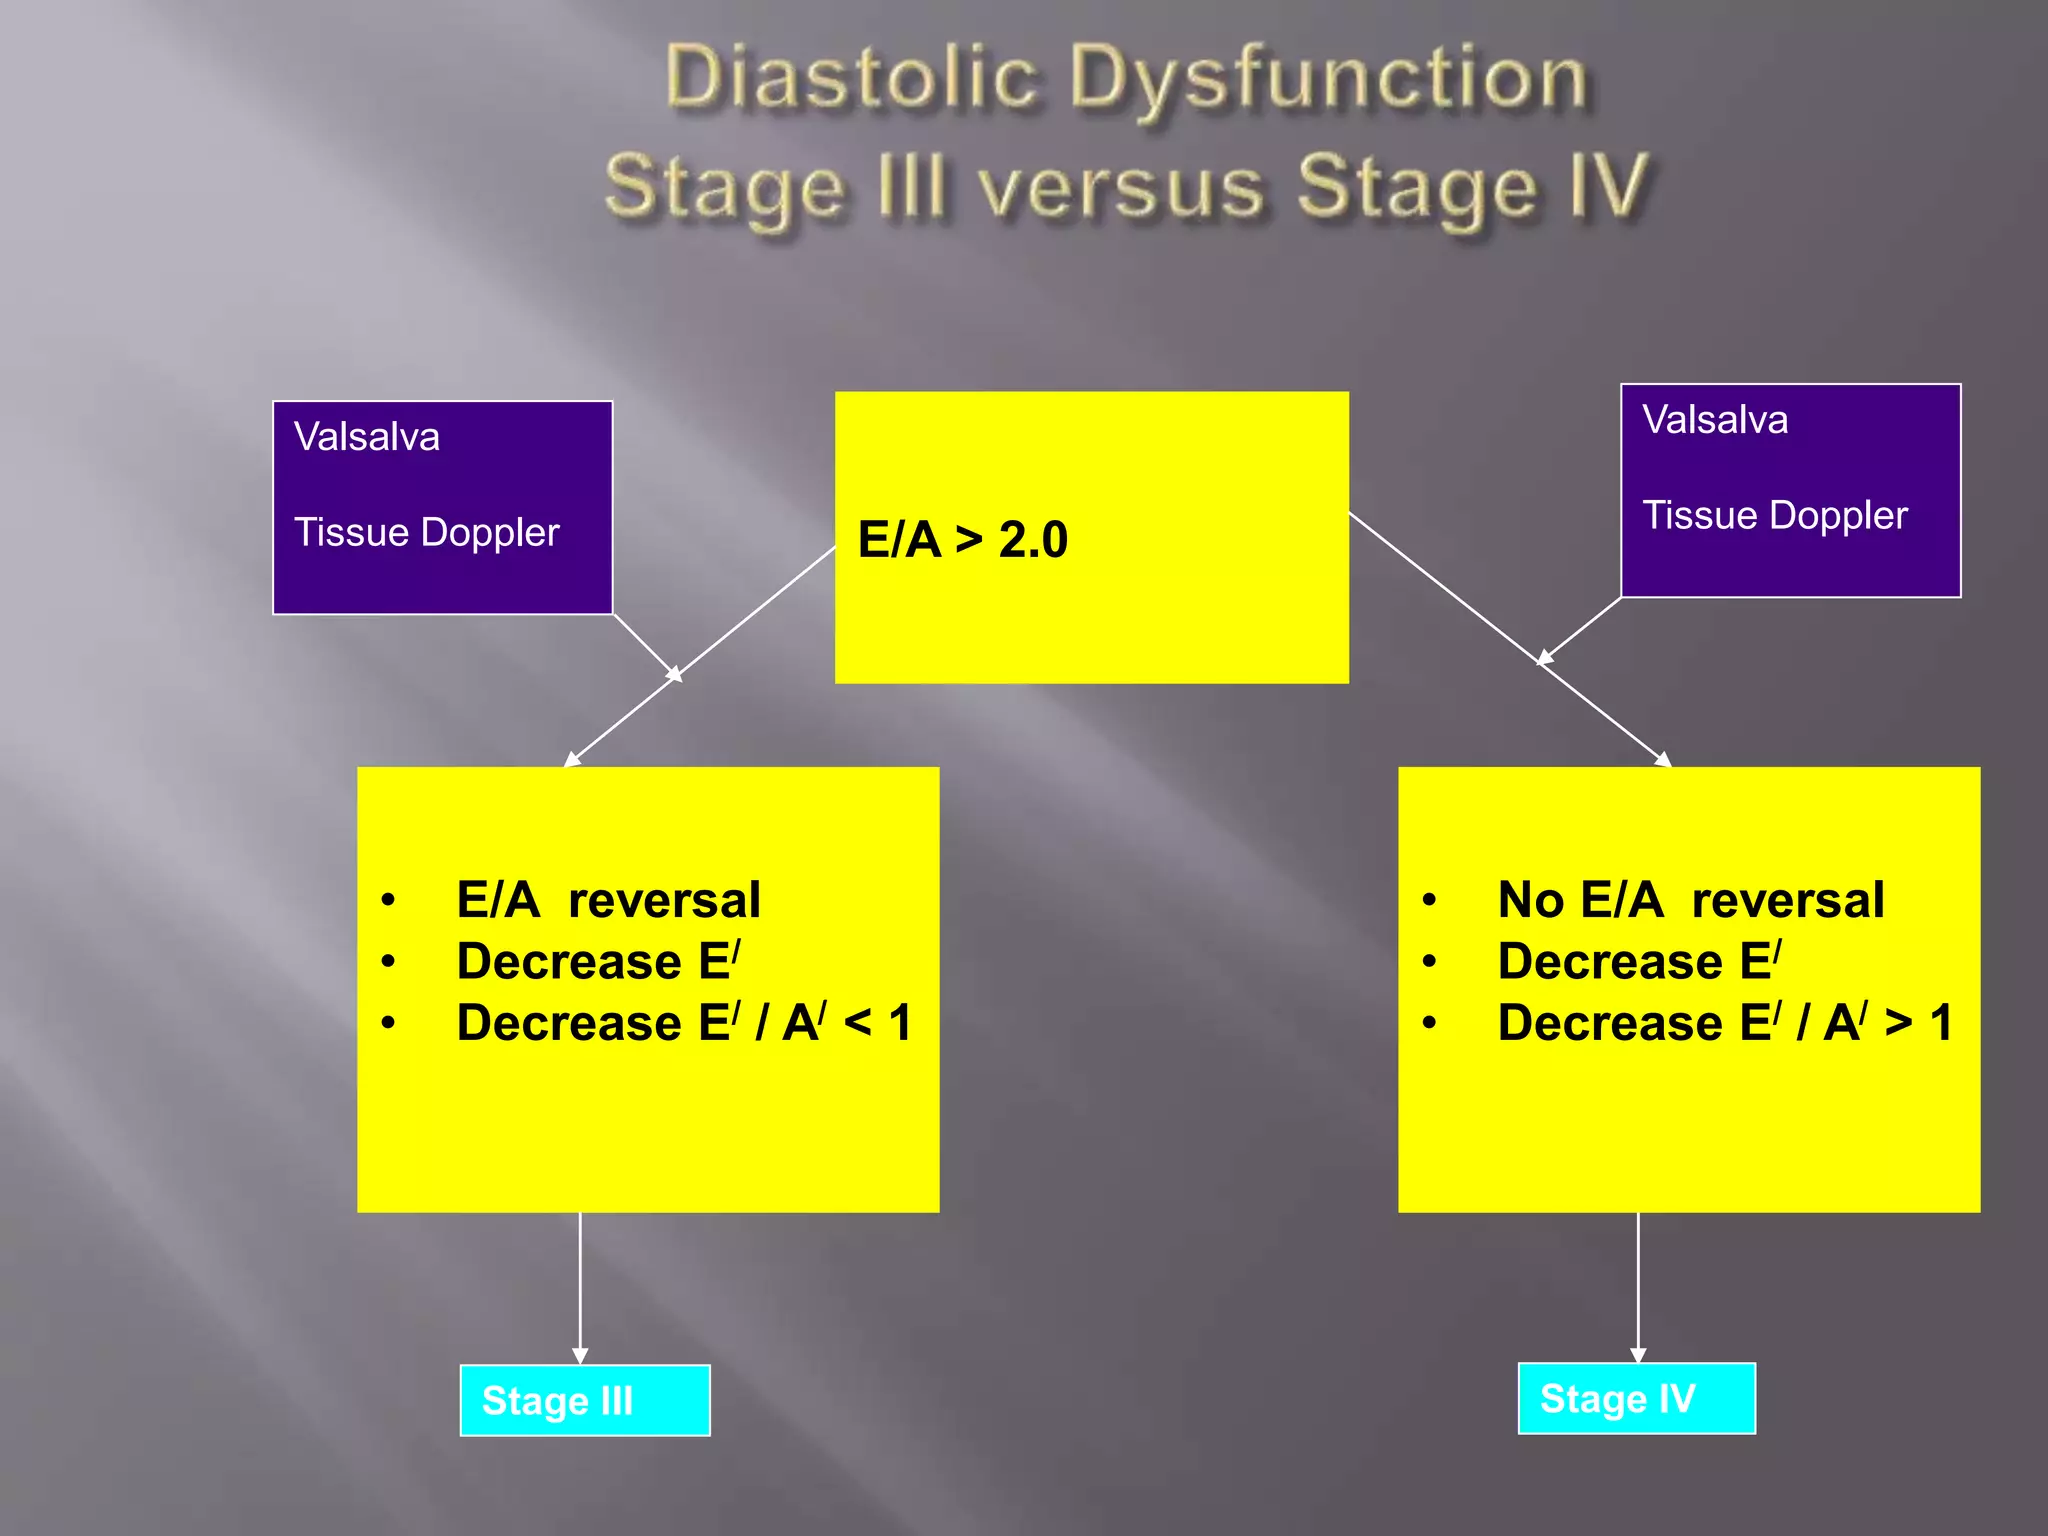

This document discusses various parameters used to evaluate cardiac structure and function using echocardiography. It describes parameters such as ejection fraction, mitral inflow patterns, pulmonary venous flow, tissue Doppler imaging, and color M-mode measurements that are used to assess global and regional left ventricular function as well as diastolic function. The parameters are grouped into categories of ventricular structure and systolic function, diastolic function evaluation, and stages of diastolic dysfunction. Normal ranges for various measurements are also provided.