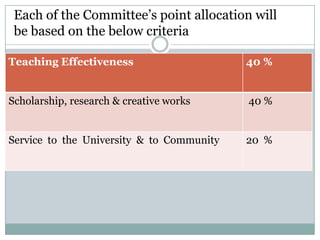
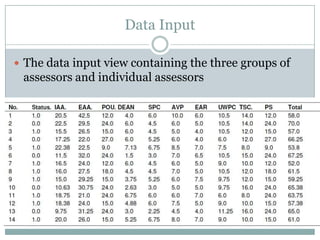
Canonical correlation analysis was used to detect potential bias in faculty promotion scoring at the American University of Nigeria (AUN). The analysis compared scores from three promotion committees and tested whether any committee showed bias that influenced candidates' promotability. The analysis found:
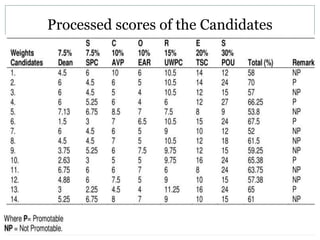
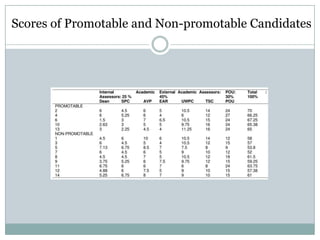
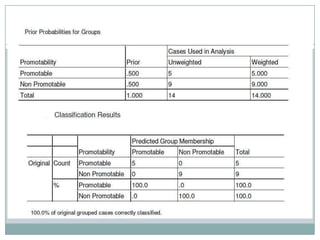
1) It could discriminate between candidates deemed promotable versus non-promotable, rejecting the hypothesis that it couldn't do so.
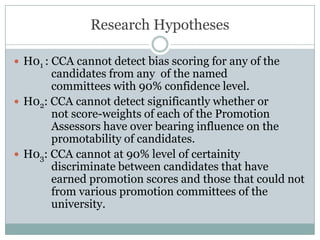
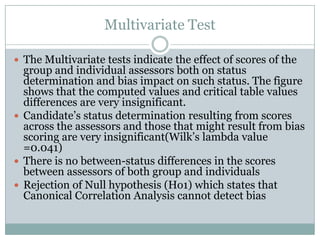
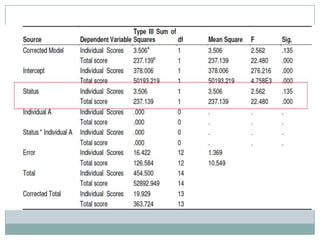
2) There were no significant differences in scoring between committees, rejecting the hypothesis that it couldn't detect bias.
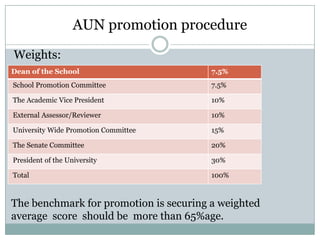
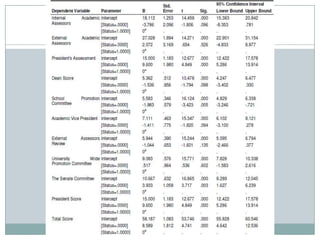
3) Only the president's committee showed significant score weight influence on promotability, rejecting the hypothesis that it couldn't detect overbearing influences.
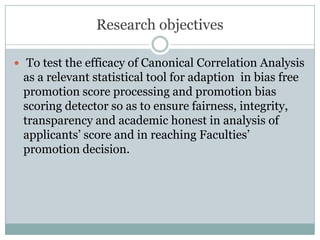
The study demonstrated canonical correlation analysis can be an effective tool for unbiased faculty


![Brazil country analysis report [team 2]](https://cdn.slidesharecdn.com/ss_thumbnails/brazil-countryanalysisreportteam2-110505124207-phpapp01-thumbnail.jpg?width=640&height=640&fit=bounds)


