Despite widespread adoption, machine learning models remain mostly black boxes. Understanding why certains predictions are made are very important in assessing trust, which is very important if one plans to take action based on a prediction. Such understanding also provides insights into the model, which can be used to transform an untrustworthy model or prediction into a trustworthy one. If the user does not trust the model they will never use it .
Prediction of house price using multiple regressionvinovk
- Constructed a mathematical model using Multiple Regression to estimate the Selling price of the house based on a set of predictor variables.
- SAS was used for Variable profiling, data transformations, data preparation, regression modeling, fitting data, model diagnostics, and outlier detection.
Binary Logistic Regression Classification makes use of one or more predictor variables that may be either continuous or categorical to predict target variable classes. This technique identifies important factors impacting the target variable and also the nature of the relationship between each of these factors and the dependent variable. It is useful in the analysis of multiple factors influencing an outcome, or other classification where there two possible outcomes.
Principal Component Analysis and ClusteringUsha Vijay
Identifying the borrower segments from the give bank data set which has 27000 rows and 77 variable using PROC PRINCOMP. variables, it is important to reduce the data set to a smaller set of variables to derive a feasible
conclusion. With the effect of multicollinearity two or more variables can share the same plane in the in dimensions. Each row of the data can
be envisioned as a 77 dimensional graph and when we project the data as orthonormal, it is expected that the certain characteristics of the
data based on the plots to cluster together as principal components. In order to identify these principal components. PROC PRINCOMP is
executed with all the variables except the constant variables(recoveries and collection fees) and we derive a plot of Eigen values of all the
principal components
In this presentation is given an introduction to Bayesian networks and basic probability theory. Graphical explanation of Bayes' theorem, random variable, conditional and joint probability. Spam classifier, medical diagnosis, fault prediction. The main software for Bayesian Networks are presented.
very detailed illustration of Log of Odds, Logit/ logistic regression and their types from binary logit, ordered logit to multinomial logit and also with their assumptions.
Thanks, for your time, if you enjoyed this short article there are tons of topics in advanced analytics, data science, and machine learning available in my medium repo. https://medium.com/@bobrupakroy
The R language is a project designed to create a free, open source language which can be used as a replacement for the S-PLUS language, originally developed as the S language at AT&T Bell Labs, and currently marketed by Insightful Corporation of Seattle, Washington. R is an open source implementation of S, and differs from S-plus largely in its command-line only format.
Topics Covered:
1.Introduction to R
2.Installing R
3.Why Learn R
4.The R Console
5.Basic Arithmetic and Objects
6.Program Example
7.Programming with Big Data in R
8.Big Data Strategies in R
9.Applications of R Programming
10.Companies Using R
11.What R is not so good at
12.Conclusion
Linear regression [Theory and Application (In physics point of view) using py...ANIRBANMAJUMDAR18
Machine-learning models are behind many recent technological advances, including high-accuracy translations of the text and self-driving cars. They are also increasingly used by researchers to help in solving physics problems, like Finding new phases of matter, Detecting interesting outliers
in data from high-energy physics experiments, Founding astronomical objects are known as gravitational lenses in maps of the night sky etc. The rudimentary algorithm that every Machine Learning enthusiast starts with is a linear regression algorithm. In statistics, linear regression is a linear approach to modelling the relationship between a scalar response (or dependent variable) and one or more explanatory variables (or independent
variables). Linear regression analysis (least squares) is used in a physics lab to prepare the computer-aided report and to fit data. In this article, the application is made to experiment: 'DETERMINATION OF DIELECTRIC CONSTANT OF NON-CONDUCTING LIQUIDS'. The entire computation is made through Python 3.6 programming language in this article.
Use of eigenvalues and eigenvectors to analyze bipartivity of network graphscsandit
This paper presents the applications of Eigenvalues and Eigenvectors (as part of spectral
decomposition) to analyze the bipartivity index of graphs as well as to predict the set of vertices
that will constitute the two partitions of graphs that are truly bipartite and those that are close
to being bipartite. Though the largest eigenvalue and the corresponding eigenvector (called the
principal eigenvalue and principal eigenvector) are typically used in the spectral analysis of
network graphs, we show that the smallest eigenvalue and the smallest eigenvector (called the
bipartite eigenvalue and the bipartite eigenvector) could be used to predict the bipartite
partitions of network graphs. For each of the predictions, we hypothesize an expected partition
for the input graph and compare that with the predicted partitions. We also analyze the impact
of the number of frustrated edges (edges connecting the vertices within a partition) and their
location across the two partitions on the bipartivity index. We observe that for a given number
of frustrated edges, if the frustrated edges are located in the larger of the two partitions of the
bipartite graph (rather than the smaller of the two partitions or equally distributed across the
two partitions), the bipartivity index is likely to be relatively larger.
COVARIANCE ESTIMATION AND RELATED PROBLEMS IN PORTFOLIO OPTIMICruzIbarra161
COVARIANCE ESTIMATION AND RELATED PROBLEMS IN PORTFOLIO OPTIMIZATION
Ilya Pollak
Purdue University
School of Electrical and Computer Engineering
West Lafayette, IN 47907
USA
ABSTRACT
This overview paper reviews covariance estimation problems and re-
lated issues arising in the context of portfolio optimization. Given
several assets, a portfolio optimizer seeks to allocate a fixed amount
of capital among these assets so as to optimize some cost function.
For example, the classical Markowitz portfolio optimization frame-
work defines portfolio risk as the variance of the portfolio return,
and seeks an allocation which minimizes the risk subject to a target
expected return. If the mean return vector and the return covariance
matrix for the underlying assets are known, the Markowitz problem
has a closed-form solution.
In practice, however, the expected returns and the covariance
matrix of the returns are unknown and are therefore estimated from
historical data. This introduces several problems which render the
Markowitz theory impracticable in real portfolio management appli-
cations. This paper discusses these problems and reviews some of
the existing literature on methods for addressing them.
Index Terms— Covariance, estimation, portfolio, market, fi-
nance, Markowitz
1. INTRODUCTION
The return of a security between trading day t1 and trading day t2
is defined as the change in the closing price over this time period,
divided by the closing price on day t1. For example, the daily (i.e.,
one-day) return on trading day t is defined as (p(t)−p(t−1))/p(t−
1) where p(t) is the closing price on day t and p(t−1) is the closing
price on the previous trading day. Note that if t is a Monday or the
day after a holiday, the previous trading day will not be the same as
the previous calendar day.
Suppose an investment is made into N assets whose return vec-
tor is R, modeled as a random vector with expected return µ =
E[R] and covariance matrix Λ = E[(R − µ)(R − µ)T ]. In other
words, R = (R(1), . . . , R(N))T where R(n) is the return of the n-th
asset. It is assumed throughout the paper that the covariance matrix
Λ is invertible. This assumption is realistic, since it is quite unusual
in practice to have a set of assets whose linear combination has re-
turns exactly equal to zero. Even if an investment universe contained
such a set, the number of assets in the universe could be reduced to
eliminate the linear dependence and make the covariance matrix in-
vertible.
Out of these N assets, a portfolio is formed with allocation
weights w = (w(1), . . . , w(N))T . The n-th weight is defined as the
amount invested into the n-th asset, as a fraction of the overall invest-
ment into the portfolio: if the overall investment into the portfolio is
$D, and $D(n) is invested into the n-th asset, then w(n) = D(n)/D.
Therefore, by definition, the weights sum to one:
w
T
1 = 1, (1)
where 1 is an N -vector of ones. Note that some of the weights may
be negative, ...
Investigation of Parameter Behaviors in Stationarity of Autoregressive and Mo...BRNSS Publication Hub
The most important assumption about time series and econometrics data is stationarity. Therefore, this study focuses on behaviors of some parameters in stationarity of autoregressive (AR) and moving average (MA) models. Simulation studies were conducted using R statistical software to investigate the parameter values at different orders (p) of AR and (q) of MA models, and different sample sizes. The stationary status of the p and q are, respectively, determined, parameters such as mean, variance, autocorrelation function (ACF), and partial autocorrelation function (PACF) were determined. The study concluded that the absolute values of ACF and PACF of AR and MA models increase as the parameter values increase but decrease with increase of their orders which as a result, tends to zero at higher lag orders. This is clearly observed in large sample size (n = 300). However, their values decline as sample size increases when compared by orders across the sample sizes. Furthermore, it was observed that the means values of the AR and MA models of first order increased with increased in parameter but decreased when sample sizes were decreased, which tend to zero at large sample sizes, so also the variances
This Presentation is on recommended system on question paper predication using machine learning techniques. We did literature survey and implement using same technique.
In engineering and science, dimensional analysis is the analysis of the relationships between different physical quantities by identifying their fundamental dimensions (such as length, mass, time, and electric charge) and units of measure (such as miles vs. kilometers, or pounds vs. kilograms vs. grams) and tracking these dimensions as calculations or comparisons are performed.
HOT NEW PRODUCT! BIG SALES FAST SHIPPING NOW FROM CHINA!! EU KU DB BK substit...GL Anaacs
Contact us if you are interested:
Email / Skype : kefaya1771@gmail.com
Threema: PXHY5PDH
New BATCH Ku !!! MUCH IN DEMAND FAST SALE EVERY BATCH HAPPY GOOD EFFECT BIG BATCH !
Contact me on Threema or skype to start big business!!
Hot-sale products:
NEW HOT EUTYLONE WHITE CRYSTAL!!
5cl-adba precursor (semi finished )
5cl-adba raw materials
ADBB precursor (semi finished )
ADBB raw materials
APVP powder
5fadb/4f-adb
Jwh018 / Jwh210
Eutylone crystal
Protonitazene (hydrochloride) CAS: 119276-01-6
Flubrotizolam CAS: 57801-95-3
Metonitazene CAS: 14680-51-4
Payment terms: Western Union,MoneyGram,Bitcoin or USDT.
Deliver Time: Usually 7-15days
Shipping method: FedEx, TNT, DHL,UPS etc.Our deliveries are 100% safe, fast, reliable and discreet.
Samples will be sent for your evaluation!If you are interested in, please contact me, let's talk details.
We specializes in exporting high quality Research chemical, medical intermediate, Pharmaceutical chemicals and so on. Products are exported to USA, Canada, France, Korea, Japan,Russia, Southeast Asia and other countries.
Tom Selleck Health: A Comprehensive Look at the Iconic Actor’s Wellness Journeygreendigital
Tom Selleck, an enduring figure in Hollywood. has captivated audiences for decades with his rugged charm, iconic moustache. and memorable roles in television and film. From his breakout role as Thomas Magnum in Magnum P.I. to his current portrayal of Frank Reagan in Blue Bloods. Selleck's career has spanned over 50 years. But beyond his professional achievements. fans have often been curious about Tom Selleck Health. especially as he has aged in the public eye.
Follow us on: Pinterest
Introduction
Many have been interested in Tom Selleck health. not only because of his enduring presence on screen but also because of the challenges. and lifestyle choices he has faced and made over the years. This article delves into the various aspects of Tom Selleck health. exploring his fitness regimen, diet, mental health. and the challenges he has encountered as he ages. We'll look at how he maintains his well-being. the health issues he has faced, and his approach to ageing .
Early Life and Career
Childhood and Athletic Beginnings
Tom Selleck was born on January 29, 1945, in Detroit, Michigan, and grew up in Sherman Oaks, California. From an early age, he was involved in sports, particularly basketball. which played a significant role in his physical development. His athletic pursuits continued into college. where he attended the University of Southern California (USC) on a basketball scholarship. This early involvement in sports laid a strong foundation for his physical health and disciplined lifestyle.
Transition to Acting
Selleck's transition from an athlete to an actor came with its physical demands. His first significant role in "Magnum P.I." required him to perform various stunts and maintain a fit appearance. This role, which he played from 1980 to 1988. necessitated a rigorous fitness routine to meet the show's demands. setting the stage for his long-term commitment to health and wellness.
Fitness Regimen
Workout Routine
Tom Selleck health and fitness regimen has evolved. adapting to his changing roles and age. During his "Magnum, P.I." days. Selleck's workouts were intense and focused on building and maintaining muscle mass. His routine included weightlifting, cardiovascular exercises. and specific training for the stunts he performed on the show.
Selleck adjusted his fitness routine as he aged to suit his body's needs. Today, his workouts focus on maintaining flexibility, strength, and cardiovascular health. He incorporates low-impact exercises such as swimming, walking, and light weightlifting. This balanced approach helps him stay fit without putting undue strain on his joints and muscles.
Importance of Flexibility and Mobility
In recent years, Selleck has emphasized the importance of flexibility and mobility in his fitness regimen. Understanding the natural decline in muscle mass and joint flexibility with age. he includes stretching and yoga in his routine. These practices help prevent injuries, improve posture, and maintain mobilit
263778731218 Abortion Clinic /Pills In Harare ,sisternakatoto
263778731218 Abortion Clinic /Pills In Harare ,ABORTION WOMEN’S CLINIC +27730423979 IN women clinic we believe that every woman should be able to make choices in her pregnancy. Our job is to provide compassionate care, safety,affordable and confidential services. That’s why we have won the trust from all generations of women all over the world. we use non surgical method(Abortion pills) to terminate…Dr.LISA +27730423979women Clinic is committed to providing the highest quality of obstetrical and gynecological care to women of all ages. Our dedicated staff aim to treat each patient and her health concerns with compassion and respect.Our dedicated group ABORTION WOMEN’S CLINIC +27730423979 IN women clinic we believe that every woman should be able to make choices in her pregnancy. Our job is to provide compassionate care, safety,affordable and confidential services. That’s why we have won the trust from all generations of women all over the world. we use non surgical method(Abortion pills) to terminate…Dr.LISA +27730423979women Clinic is committed to providing the highest quality of obstetrical and gynecological care to women of all ages. Our dedicated staff aim to treat each patient and her health concerns with compassion and respect.Our dedicated group of receptionists, nurses, and physicians have worked together as a teamof receptionists, nurses, and physicians have worked together as a team wwww.lisywomensclinic.co.za/
Ethanol (CH3CH2OH), or beverage alcohol, is a two-carbon alcohol
that is rapidly distributed in the body and brain. Ethanol alters many
neurochemical systems and has rewarding and addictive properties. It
is the oldest recreational drug and likely contributes to more morbidity,
mortality, and public health costs than all illicit drugs combined. The
5th edition of the Diagnostic and Statistical Manual of Mental Disorders
(DSM-5) integrates alcohol abuse and alcohol dependence into a single
disorder called alcohol use disorder (AUD), with mild, moderate,
and severe subclassifications (American Psychiatric Association, 2013).
In the DSM-5, all types of substance abuse and dependence have been
combined into a single substance use disorder (SUD) on a continuum
from mild to severe. A diagnosis of AUD requires that at least two of
the 11 DSM-5 behaviors be present within a 12-month period (mild
AUD: 2–3 criteria; moderate AUD: 4–5 criteria; severe AUD: 6–11 criteria).
The four main behavioral effects of AUD are impaired control over
drinking, negative social consequences, risky use, and altered physiological
effects (tolerance, withdrawal). This chapter presents an overview
of the prevalence and harmful consequences of AUD in the U.S.,
the systemic nature of the disease, neurocircuitry and stages of AUD,
comorbidities, fetal alcohol spectrum disorders, genetic risk factors, and
pharmacotherapies for AUD.
- Video recording of this lecture in English language: https://youtu.be/lK81BzxMqdo
- Video recording of this lecture in Arabic language: https://youtu.be/Ve4P0COk9OI
- Link to download the book free: https://nephrotube.blogspot.com/p/nephrotube-nephrology-books.html
- Link to NephroTube website: www.NephroTube.com
- Link to NephroTube social media accounts: https://nephrotube.blogspot.com/p/join-nephrotube-on-social-media.html
Flu Vaccine Alert in Bangalore Karnatakaaddon Scans
As flu season approaches, health officials in Bangalore, Karnataka, are urging residents to get their flu vaccinations. The seasonal flu, while common, can lead to severe health complications, particularly for vulnerable populations such as young children, the elderly, and those with underlying health conditions.
Dr. Vidisha Kumari, a leading epidemiologist in Bangalore, emphasizes the importance of getting vaccinated. "The flu vaccine is our best defense against the influenza virus. It not only protects individuals but also helps prevent the spread of the virus in our communities," he says.
This year, the flu season is expected to coincide with a potential increase in other respiratory illnesses. The Karnataka Health Department has launched an awareness campaign highlighting the significance of flu vaccinations. They have set up multiple vaccination centers across Bangalore, making it convenient for residents to receive their shots.
To encourage widespread vaccination, the government is also collaborating with local schools, workplaces, and community centers to facilitate vaccination drives. Special attention is being given to ensuring that the vaccine is accessible to all, including marginalized communities who may have limited access to healthcare.
Residents are reminded that the flu vaccine is safe and effective. Common side effects are mild and may include soreness at the injection site, mild fever, or muscle aches. These side effects are generally short-lived and far less severe than the flu itself.
Healthcare providers are also stressing the importance of continuing COVID-19 precautions. Wearing masks, practicing good hand hygiene, and maintaining social distancing are still crucial, especially in crowded places.
Protect yourself and your loved ones by getting vaccinated. Together, we can help keep Bangalore healthy and safe this flu season. For more information on vaccination centers and schedules, residents can visit the Karnataka Health Department’s official website or follow their social media pages.
Stay informed, stay safe, and get your flu shot today!
Acute scrotum is a general term referring to an emergency condition affecting the contents or the wall of the scrotum.
There are a number of conditions that present acutely, predominantly with pain and/or swelling
A careful and detailed history and examination, and in some cases, investigations allow differentiation between these diagnoses. A prompt diagnosis is essential as the patient may require urgent surgical intervention
Testicular torsion refers to twisting of the spermatic cord, causing ischaemia of the testicle.
Testicular torsion results from inadequate fixation of the testis to the tunica vaginalis producing ischemia from reduced arterial inflow and venous outflow obstruction.
The prevalence of testicular torsion in adult patients hospitalized with acute scrotal pain is approximately 25 to 50 percent
Ozempic: Preoperative Management of Patients on GLP-1 Receptor Agonists Saeid Safari
Preoperative Management of Patients on GLP-1 Receptor Agonists like Ozempic and Semiglutide
ASA GUIDELINE
NYSORA Guideline
2 Case Reports of Gastric Ultrasound
Couples presenting to the infertility clinic- Do they really have infertility...Sujoy Dasgupta
Dr Sujoy Dasgupta presented the study on "Couples presenting to the infertility clinic- Do they really have infertility? – The unexplored stories of non-consummation" in the 13th Congress of the Asia Pacific Initiative on Reproduction (ASPIRE 2024) at Manila on 24 May, 2024.
The prostate is an exocrine gland of the male mammalian reproductive system
It is a walnut-sized gland that forms part of the male reproductive system and is located in front of the rectum and just below the urinary bladder
Function is to store and secrete a clear, slightly alkaline fluid that constitutes 10-30% of the volume of the seminal fluid that along with the spermatozoa, constitutes semen
A healthy human prostate measures (4cm-vertical, by 3cm-horizontal, 2cm ant-post ).
It surrounds the urethra just below the urinary bladder. It has anterior, median, posterior and two lateral lobes
It’s work is regulated by androgens which are responsible for male sex characteristics
Generalised disease of the prostate due to hormonal derangement which leads to non malignant enlargement of the gland (increase in the number of epithelial cells and stromal tissue)to cause compression of the urethra leading to symptoms (LUTS
Title: Sense of Taste
Presenter: Dr. Faiza, Assistant Professor of Physiology
Qualifications:
MBBS (Best Graduate, AIMC Lahore)
FCPS Physiology
ICMT, CHPE, DHPE (STMU)
MPH (GC University, Faisalabad)
MBA (Virtual University of Pakistan)
Learning Objectives:
Describe the structure and function of taste buds.
Describe the relationship between the taste threshold and taste index of common substances.
Explain the chemical basis and signal transduction of taste perception for each type of primary taste sensation.
Recognize different abnormalities of taste perception and their causes.
Key Topics:
Significance of Taste Sensation:
Differentiation between pleasant and harmful food
Influence on behavior
Selection of food based on metabolic needs
Receptors of Taste:
Taste buds on the tongue
Influence of sense of smell, texture of food, and pain stimulation (e.g., by pepper)
Primary and Secondary Taste Sensations:
Primary taste sensations: Sweet, Sour, Salty, Bitter, Umami
Chemical basis and signal transduction mechanisms for each taste
Taste Threshold and Index:
Taste threshold values for Sweet (sucrose), Salty (NaCl), Sour (HCl), and Bitter (Quinine)
Taste index relationship: Inversely proportional to taste threshold
Taste Blindness:
Inability to taste certain substances, particularly thiourea compounds
Example: Phenylthiocarbamide
Structure and Function of Taste Buds:
Composition: Epithelial cells, Sustentacular/Supporting cells, Taste cells, Basal cells
Features: Taste pores, Taste hairs/microvilli, and Taste nerve fibers
Location of Taste Buds:
Found in papillae of the tongue (Fungiform, Circumvallate, Foliate)
Also present on the palate, tonsillar pillars, epiglottis, and proximal esophagus
Mechanism of Taste Stimulation:
Interaction of taste substances with receptors on microvilli
Signal transduction pathways for Umami, Sweet, Bitter, Sour, and Salty tastes
Taste Sensitivity and Adaptation:
Decrease in sensitivity with age
Rapid adaptation of taste sensation
Role of Saliva in Taste:
Dissolution of tastants to reach receptors
Washing away the stimulus
Taste Preferences and Aversions:
Mechanisms behind taste preference and aversion
Influence of receptors and neural pathways
Impact of Sensory Nerve Damage:
Degeneration of taste buds if the sensory nerve fiber is cut
Abnormalities of Taste Detection:
Conditions: Ageusia, Hypogeusia, Dysgeusia (parageusia)
Causes: Nerve damage, neurological disorders, infections, poor oral hygiene, adverse drug effects, deficiencies, aging, tobacco use, altered neurotransmitter levels
Neurotransmitters and Taste Threshold:
Effects of serotonin (5-HT) and norepinephrine (NE) on taste sensitivity
Supertasters:
25% of the population with heightened sensitivity to taste, especially bitterness
Increased number of fungiform papillae
These lecture slides, by Dr Sidra Arshad, offer a quick overview of physiological basis of a normal electrocardiogram.
Learning objectives:
1. Define an electrocardiogram (ECG) and electrocardiography
2. Describe how dipoles generated by the heart produce the waveforms of the ECG
3. Describe the components of a normal electrocardiogram of a typical bipolar leads (limb II)
4. Differentiate between intervals and segments
5. Enlist some common indications for obtaining an ECG
Study Resources:
1. Chapter 11, Guyton and Hall Textbook of Medical Physiology, 14th edition
2. Chapter 9, Human Physiology - From Cells to Systems, Lauralee Sherwood, 9th edition
3. Chapter 29, Ganong’s Review of Medical Physiology, 26th edition
4. Electrocardiogram, StatPearls - https://www.ncbi.nlm.nih.gov/books/NBK549803/
5. ECG in Medical Practice by ABM Abdullah, 4th edition
6. ECG Basics, http://www.nataliescasebook.com/tag/e-c-g-basics
Prix Galien International 2024 Forum ProgramLevi Shapiro
June 20, 2024, Prix Galien International and Jerusalem Ethics Forum in ROME. Detailed agenda including panels:
- ADVANCES IN CARDIOLOGY: A NEW PARADIGM IS COMING
- WOMEN’S HEALTH: FERTILITY PRESERVATION
- WHAT’S NEW IN THE TREATMENT OF INFECTIOUS,
ONCOLOGICAL AND INFLAMMATORY SKIN DISEASES?
- ARTIFICIAL INTELLIGENCE AND ETHICS
- GENE THERAPY
- BEYOND BORDERS: GLOBAL INITIATIVES FOR DEMOCRATIZING LIFE SCIENCE TECHNOLOGIES AND PROMOTING ACCESS TO HEALTHCARE
- ETHICAL CHALLENGES IN LIFE SCIENCES
- Prix Galien International Awards Ceremony
1. Canonical correlation 1
Canonical correlation
In statistics, canonical-correlation analysis (CCA) is a way of making sense of cross-covariance matrices. If we
have two vectors X = (X
1
, ..., X
n
) and Y = (Y
1
, ..., Y
m
) of random variables, and there are correlations among the
variables, then canonical-correlation analysis will find linear combinations of the X
i
and Y
j
which have maximum
correlation with each other. T. R. Knapp notes "virtually all of the commonly encountered parametric tests of
significance can be treated as special cases of canonical-correlation analysis, which is the general procedure for
investigating the relationships between two sets of variables." The method was first introduced by Harold Hotelling
in 1936.
Definition
Given two column vectors and of random variables with finite second
moments, one may define the cross-covariance to be the matrix whose entry
is the covariance . In practice, we would estimate the covariance matrix based on sampled data from
and (i.e. from a pair of data matrices).
Canonical-correlation analysis seeks vectors and such that the random variables and maximize the
correlation . The random variables and are the first pair of
canonical variables. Then one seeks vectors maximizing the same correlation subject to the constraint that they are
to be uncorrelated with the first pair of canonical variables; this gives the second pair of canonical variables. This
procedure may be continued up to times.
Computation
Derivation
Let and . The parameter to maximize is
The first step is to define a change of basis and define
And thus we have
By the Cauchy-Schwarz inequality, we have
There is equality if the vectors and are collinear. In addition, the maximum of correlation is
attained if is the eigenvector with the maximum eigenvalue for the matrix (see
Rayleigh quotient). The subsequent pairs are found by using eigenvalues of decreasing magnitudes. Orthogonality is
guaranteed by the symmetry of the correlation matrices.
2. Canonical correlation 2
Solution
The solution is therefore:
• is an eigenvector of
• is proportional to
Reciprocally, there is also:
• is an eigenvector of
• is proportional to
Reversing the change of coordinates, we have that
• is an eigenvector of
• is proportional to
The canonical variables are defined by:
Implementation
CCA can be computed using singular value decomposition on a correlation matrix. It is available as a function in
• MATLAB as canoncorr
[1]
• R as cancor
[2]
or in FactoMineR
[3]
• SAS as proc cancorr
[4]
• Scikit-Learn,Python as Cross decomposition
[5]
Hypothesis testing
Each row can be tested for significance with the following method. Since the correlations are sorted, saying that row
is zero implies all further correlations are also zero. If we have independent observations in a sample and is
the estimated correlation for . For the th row, the test statistic is:
which is asymptotically distributed as a chi-squared with degrees of freedom for large
. Since all the correlations from to are logically zero (and estimated that way also) the product
for the terms after this point is irrelevant.
Practical uses
A typical use for canonical correlation in the experimental context is to take two sets of variables and see what is
common amongst the two sets. For example in psychological testing, you could take two well established
multidimensional personality tests such as the Minnesota Multiphasic Personality Inventory (MMPI-2) and the NEO.
By seeing how the MMPI-2 factors relate to the NEO factors, you could gain insight into what dimensions were
common between the tests and how much variance was shared. For example you might find that an extraversion or
neuroticism dimension accounted for a substantial amount of shared variance between the two tests.
One can also use canonical-correlation analysis to produce a model equation which relates two sets of variables, for
example a set of performance measures and a set of explanatory variables, or a set of outputs and set of inputs.
3. Canonical correlation 3
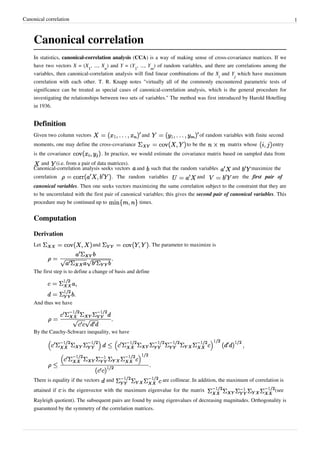
Constraint restrictions can be imposed on such a model to ensure it reflects theoretical requirements or intuitively
obvious conditions. This type of model is known as a maximum correlation model.
Visualization of the results of canonical correlation is usually through bar plots of the coefficients of the two sets of
variables for the pairs of canonical variates showing significant correlation. Some authors suggest that they are best
visualized by plotting them as heliographs, a circular format with ray like bars, with each half representing the two
sets of variables.
Examples
Let with zero expected value, i.e., . If , i.e., and are perfectly correlated,
then, e.g., and , so that the first (and only in this example) pair of canonical variables is and
. If , i.e., and are perfectly anticorrelated, then, e.g., and , so
that the first (and only in this example) pair of canonical variables is and . We notice
that in both cases , which illustrates that the canonical-correlation analysis treats correlated and
anticorrelated variables similarly.
Connection to principal angles
Assuming that and have zero expected values, i.e.,
, their covariance matrices and
can be viewed as Gram matrices in an inner product for the entries of and
, correspondingly. In this interpretation, the random variables, entries of and of are treated as
elements of a vector space with an inner product given by the covariance , see
Covariance#Relationship_to_inner_products.
The definition of the canonical variables and is then equivalent to the definition of principal vectors for the
pair of subspaces spanned by the entries of and with respect to this inner product. The canonical correlations
is equal to the cosine of principal angles.
References
[1] http://www.mathworks.co.uk/help/stats/canoncorr.html
[2] http://stat.ethz.ch/R-manual/R-devel/library/stats/html/cancor.html
[3] http://factominer.free.fr/
[4] http://support.sas.com/documentation/cdl/en/statug/63033/HTML/default/viewer.htm#statug_cancorr_sect005.htm
[5] http://scikit-learn.org/stable/modules/cross_decomposition.html
External links
• Understanding canonical correlation analysis (http://www.qmrg.org.uk/files/2008/12/
3-understanding-canonical-correlation-analysis1.pdf) (Concepts and Techniques in Modern Geography)
• Hardoon, D. R.; Szedmak, S.; Shawe-Taylor, J. (2004). "Canonical Correlation Analysis: An Overview with
Application to Learning Methods". Neural Computation 16 (12): 2639–2664. doi: 10.1162/0899766042321814
(http://dx.doi.org/10.1162/0899766042321814). PMID 15516276 (http://www.ncbi.nlm.nih.gov/
pubmed/15516276).
• A note on the ordinal canonical-correlation analysis of two sets of ranking scores (http://mpra.ub.
uni-muenchen.de/12796/) (Also provides a FORTRAN program)- in J. of Quantitative Economics 7(2), 2009,
pp. 173-199
• Representation-Constrained Canonical Correlation Analysis: A Hybridization of Canonical Correlation and
Principal Component Analyses (http://ssrn.com/abstract=1331886) (Also provides a FORTRAN program)- in J.
of Applied Economic Sciences 4(1), 2009, pp. 115-124
4. Article Sources and Contributors 4
Article Sources and Contributors
Canonical correlation Source: http://en.wikipedia.org/w/index.php?oldid=599494674 Contributors: 2andrewknyazev, Ahsglg0054, AndrewHowse, Angryhaggis, Arthur Rubin, Attarparn,
Bestiasonica, Bkonrad, Bob1960evens, Bruce rennes, Bruguiea, Cyan, Dean p foster, Den fjättrade ankan, Duoduoduo, Fangz, Fnielsen, Free Software Knight, Gareth Jones, Geomon, Giganut,
Hu12, JamesBWatson, Jncraton, Kiefer.Wolfowitz, Mark viking, Matteo.pelagatti, MaxSem, Mcld, Melcombe, Memming, Michael Hardy, Mishrasknehu, Olaf, R'n'B, Selvik, Shyamal,
SyedAshrafulla, That Guy, From That Show!, Tomi, VSteiger, Volemak, WikiMSL, Yuzhounh, 50 anonymous edits
License
Creative Commons Attribution-Share Alike 3.0
//creativecommons.org/licenses/by-sa/3.0/