Downloaded 138 times
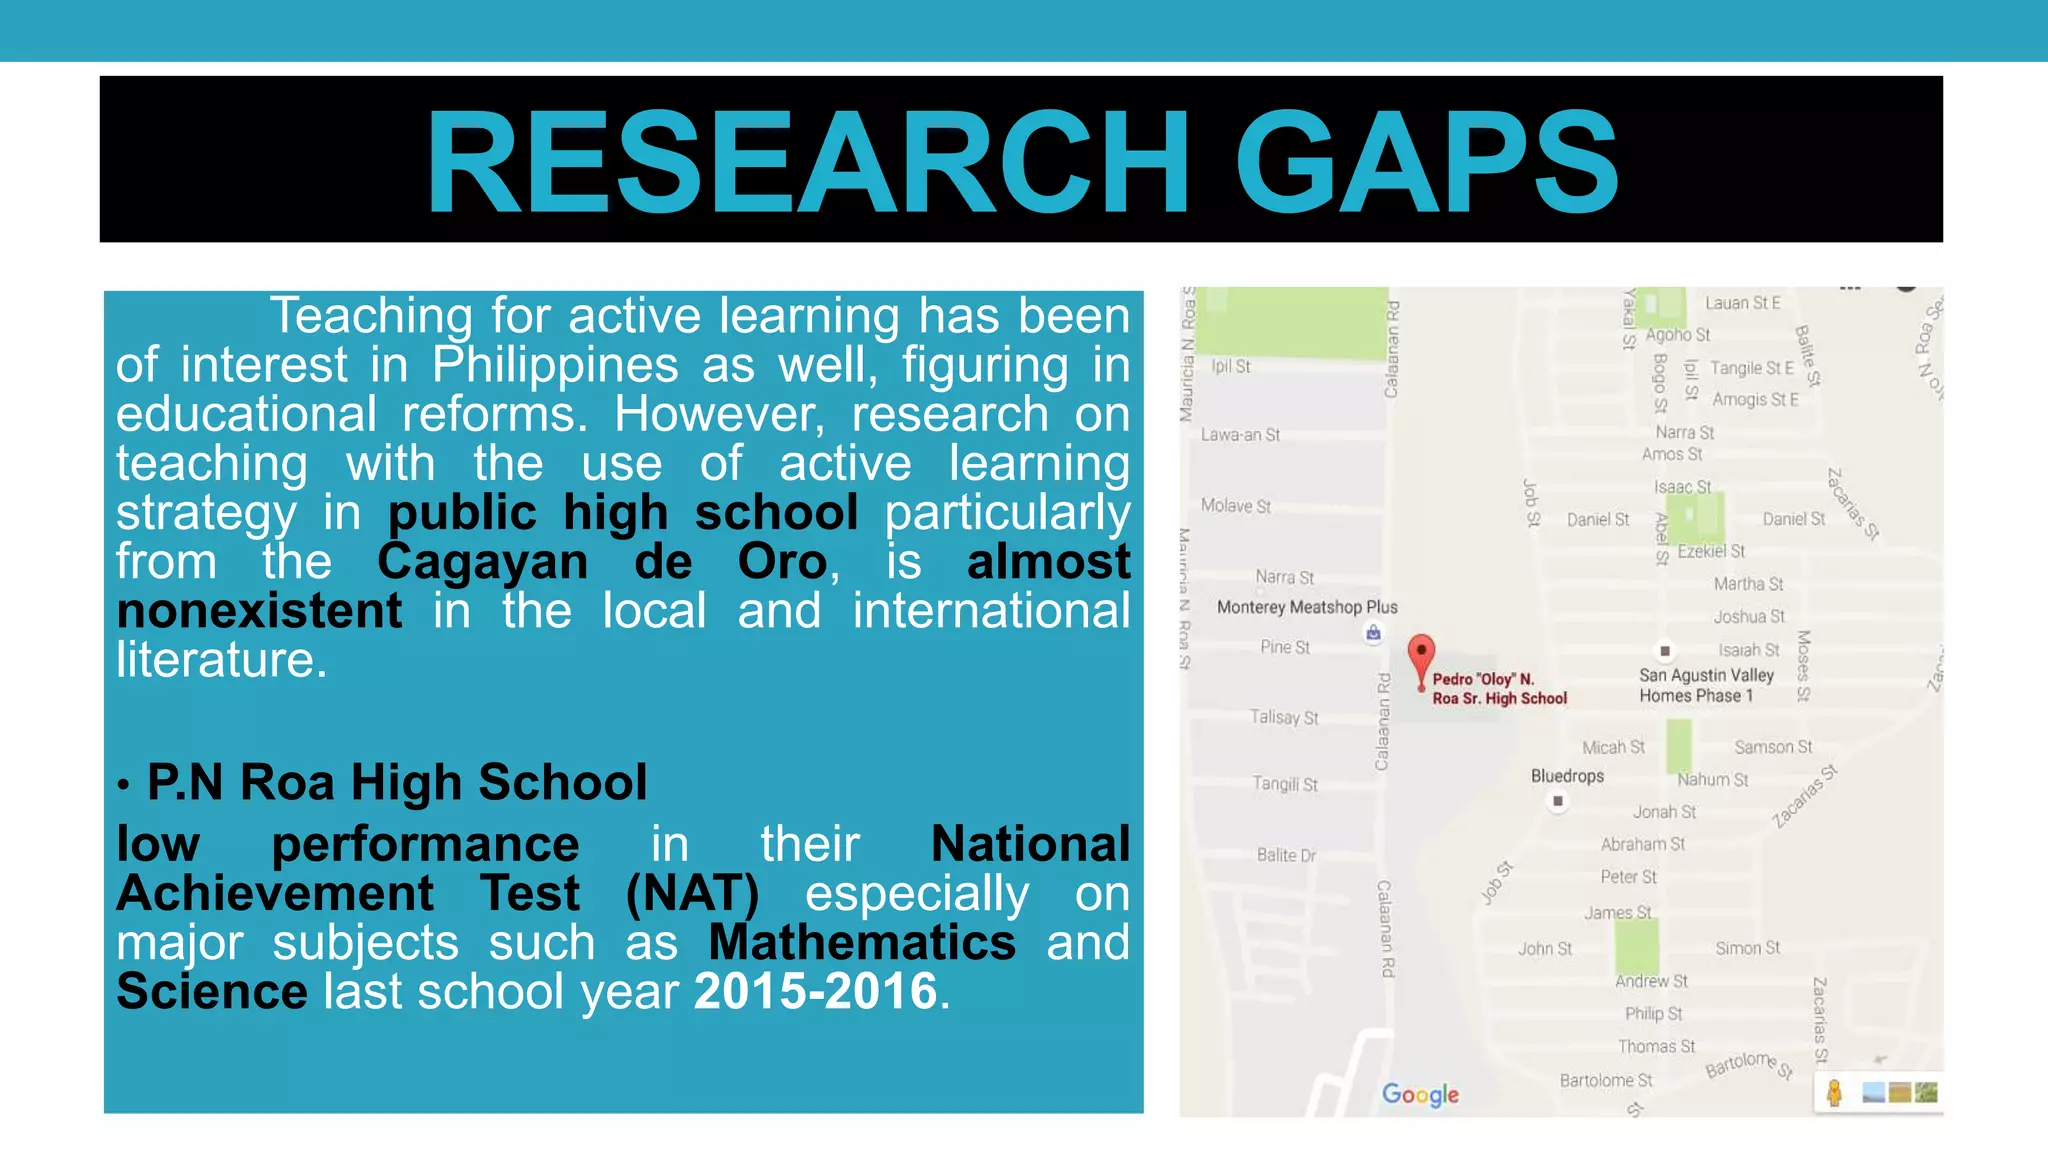
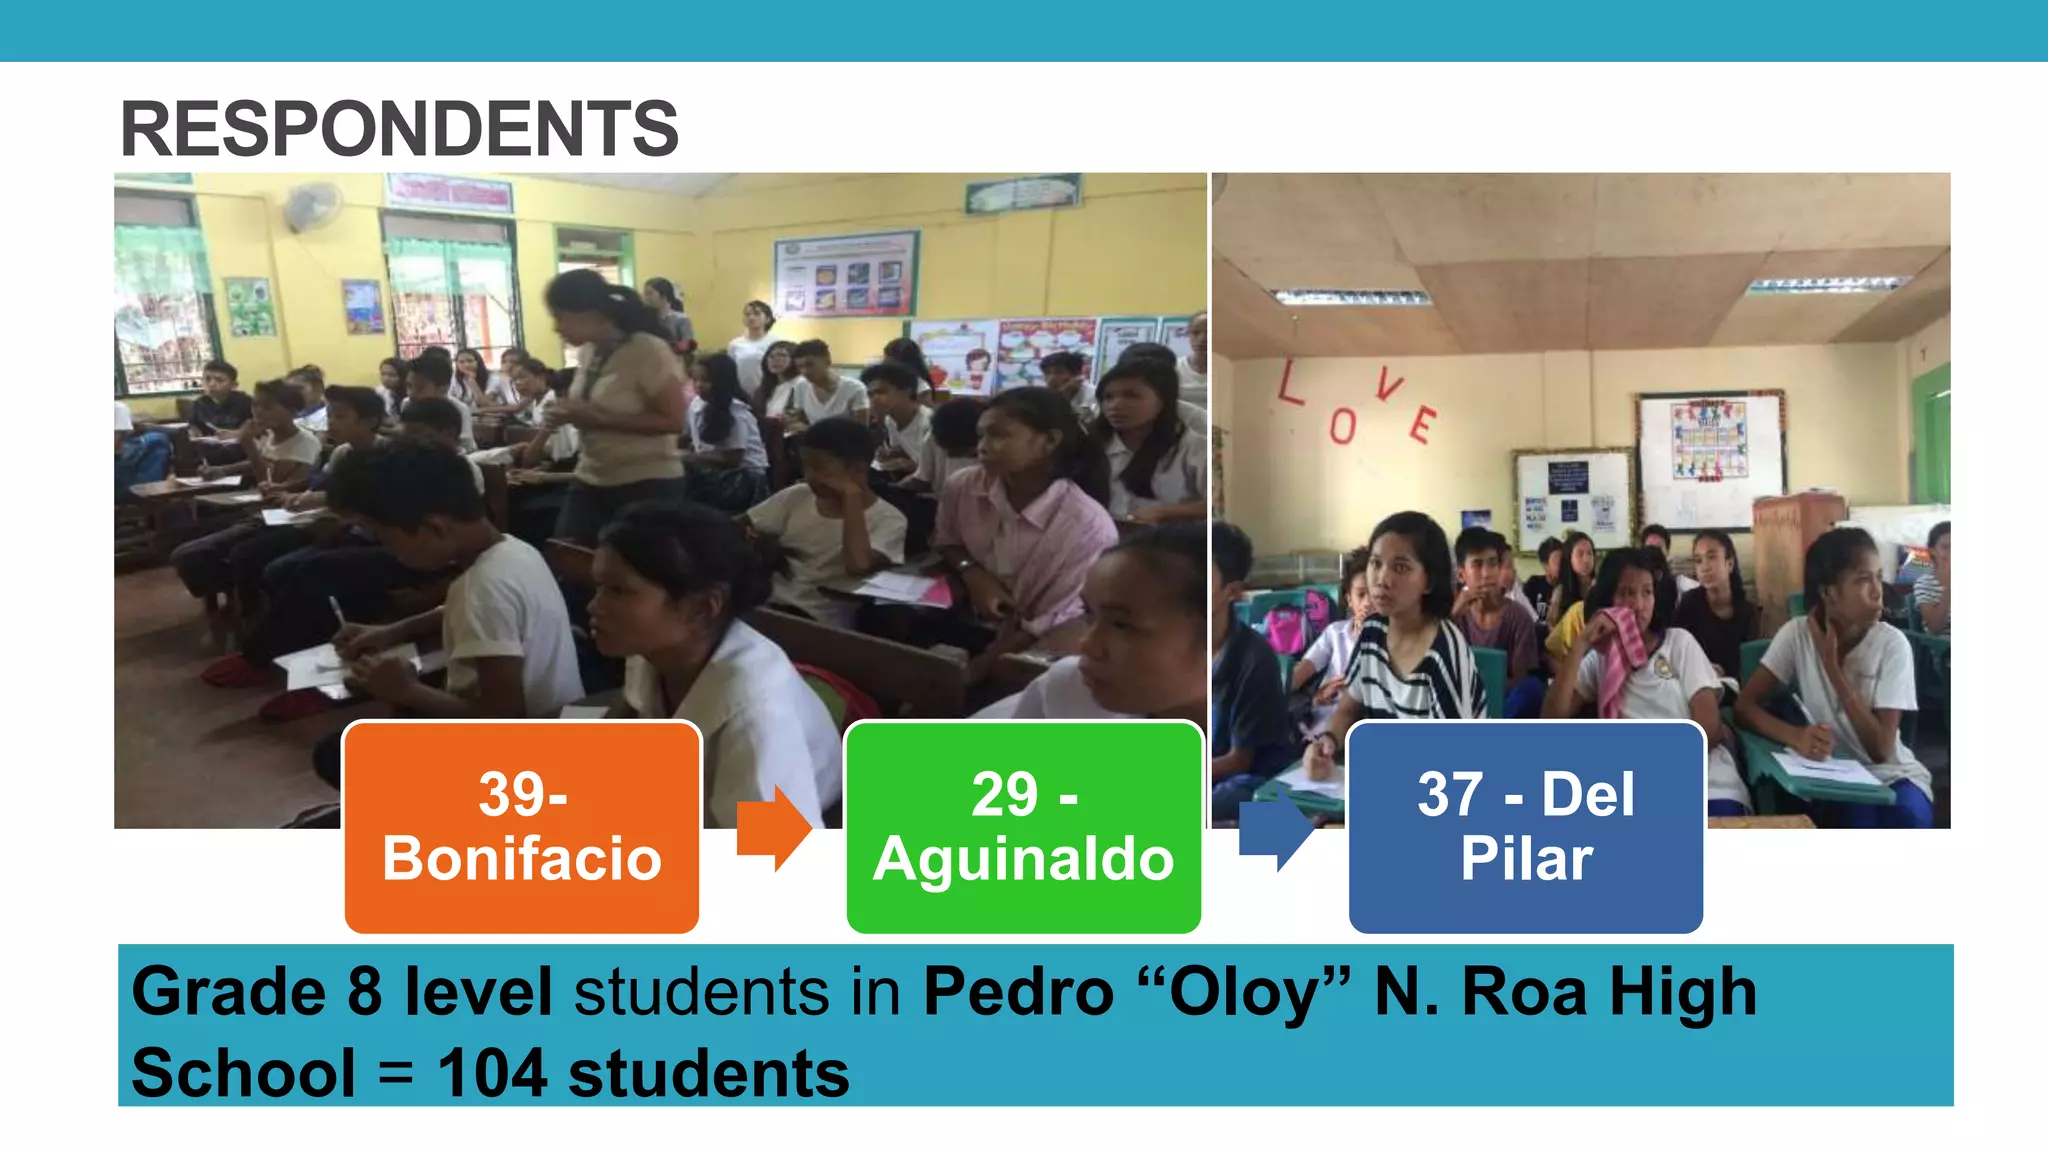
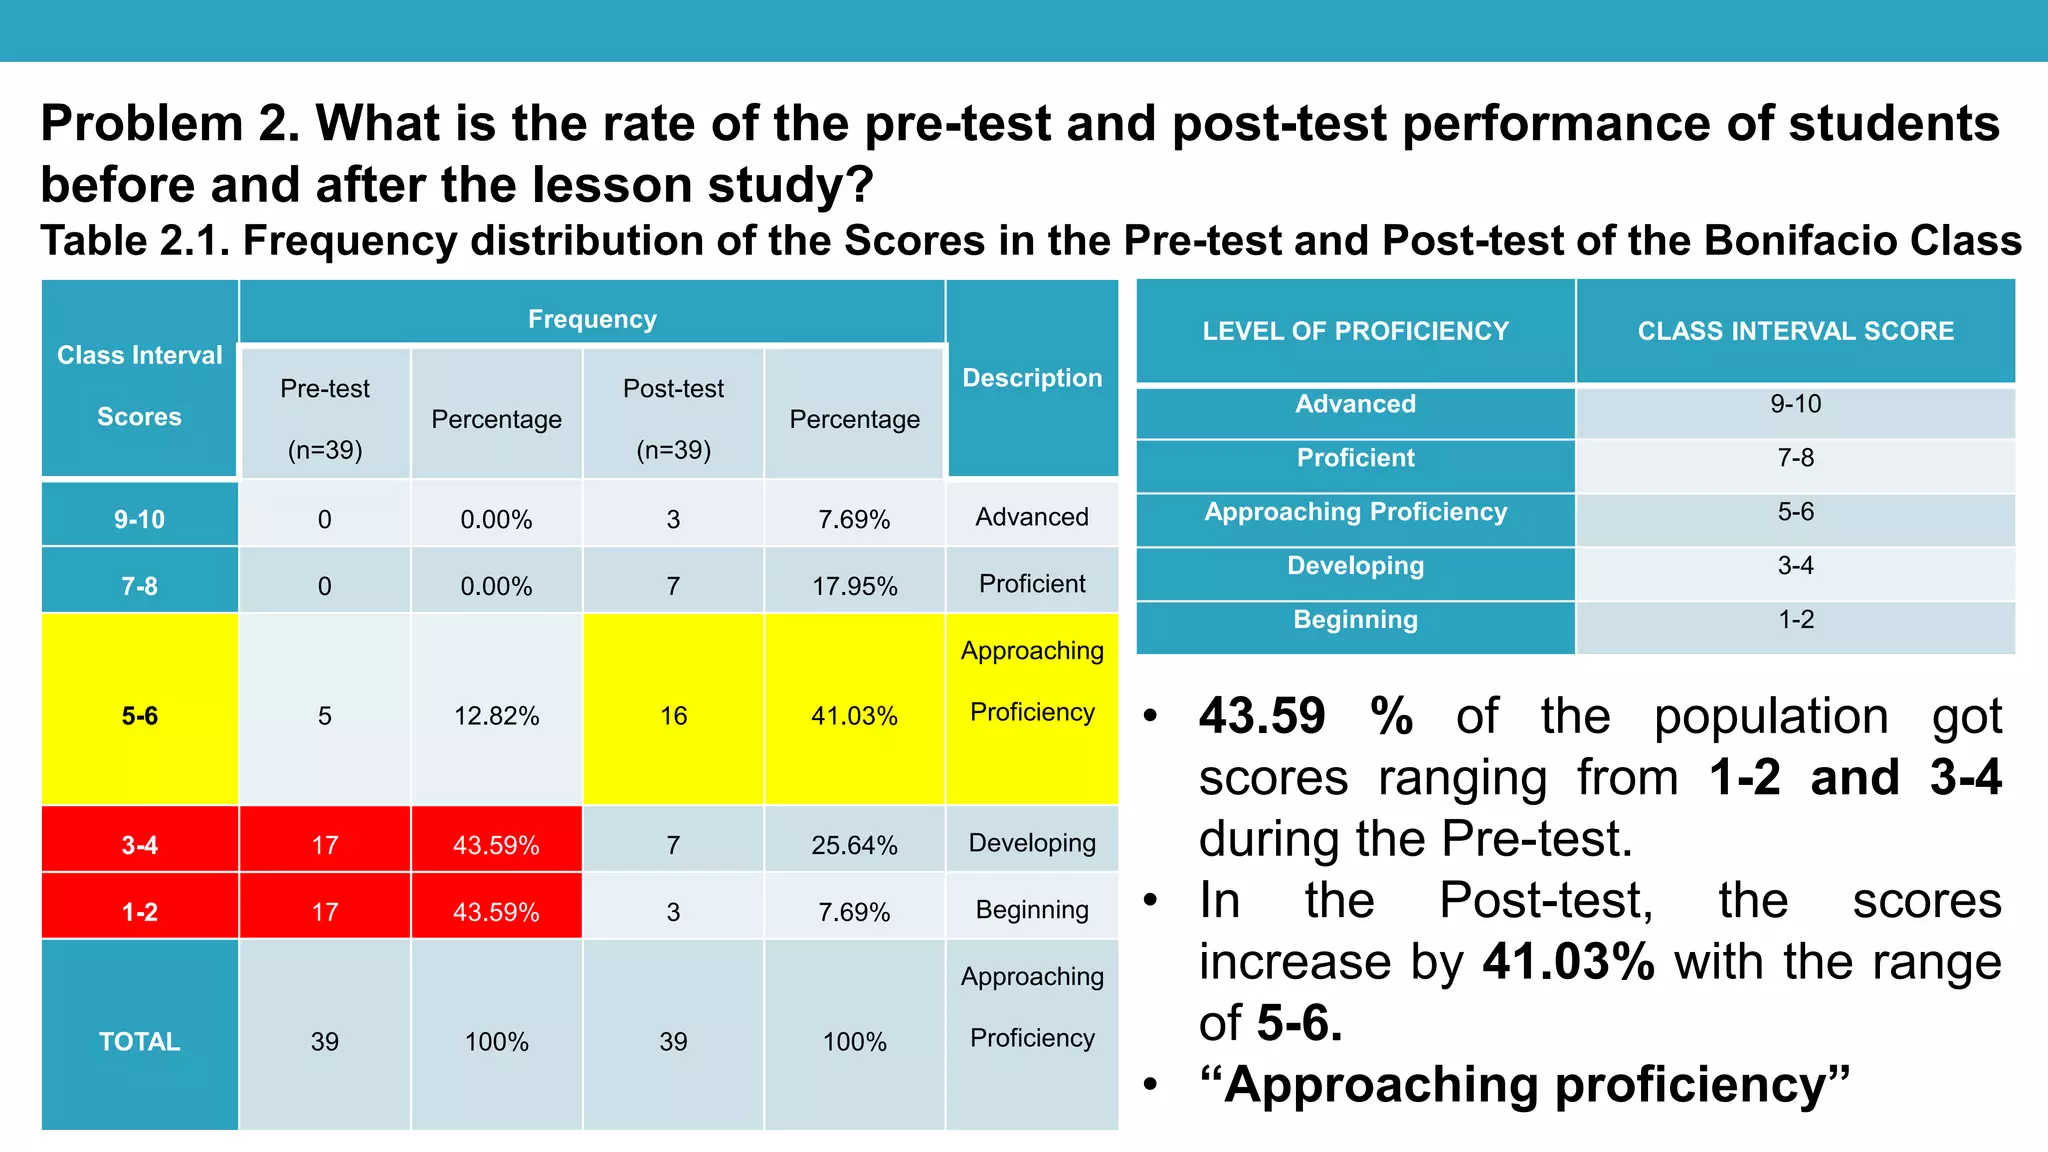
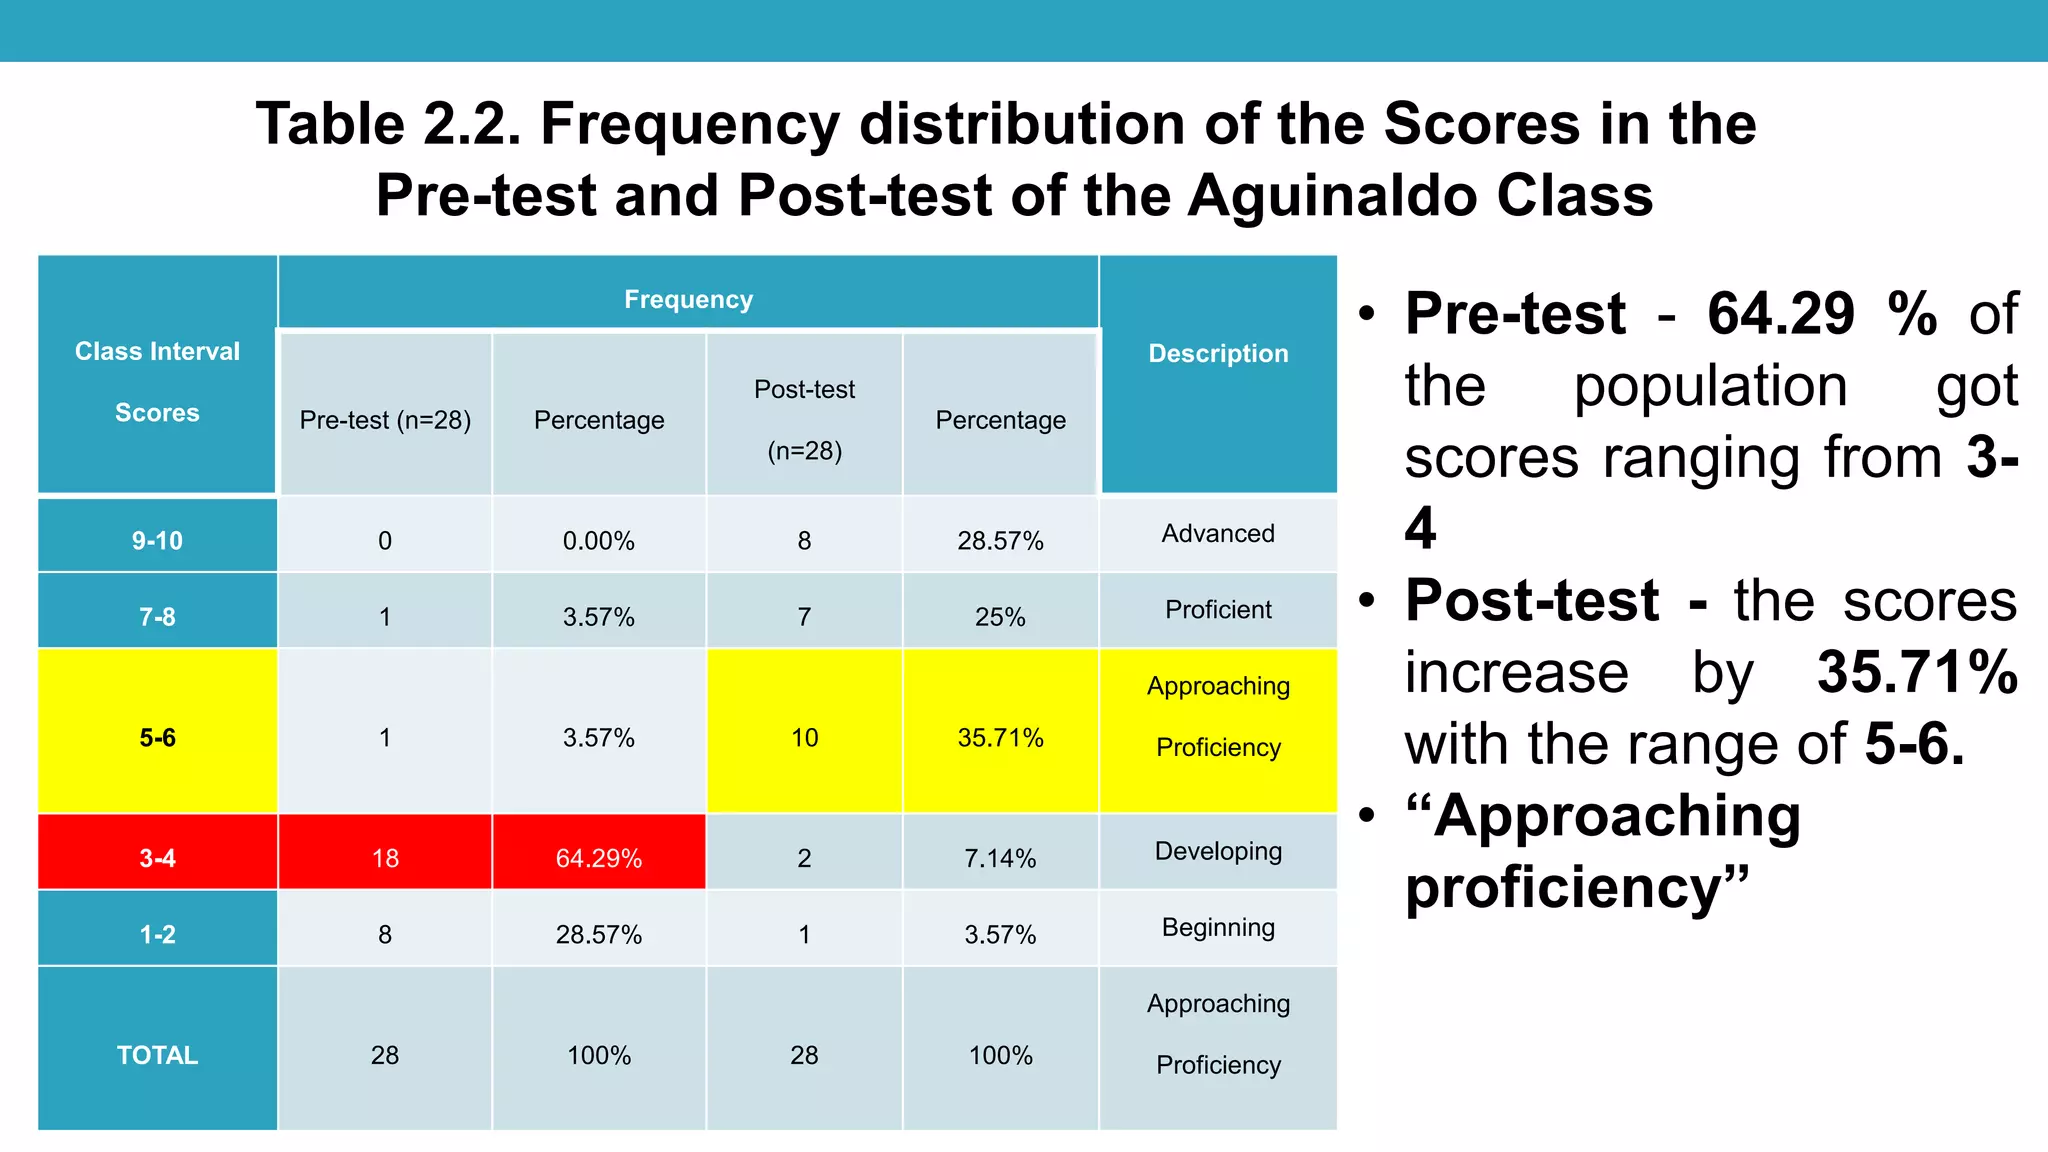
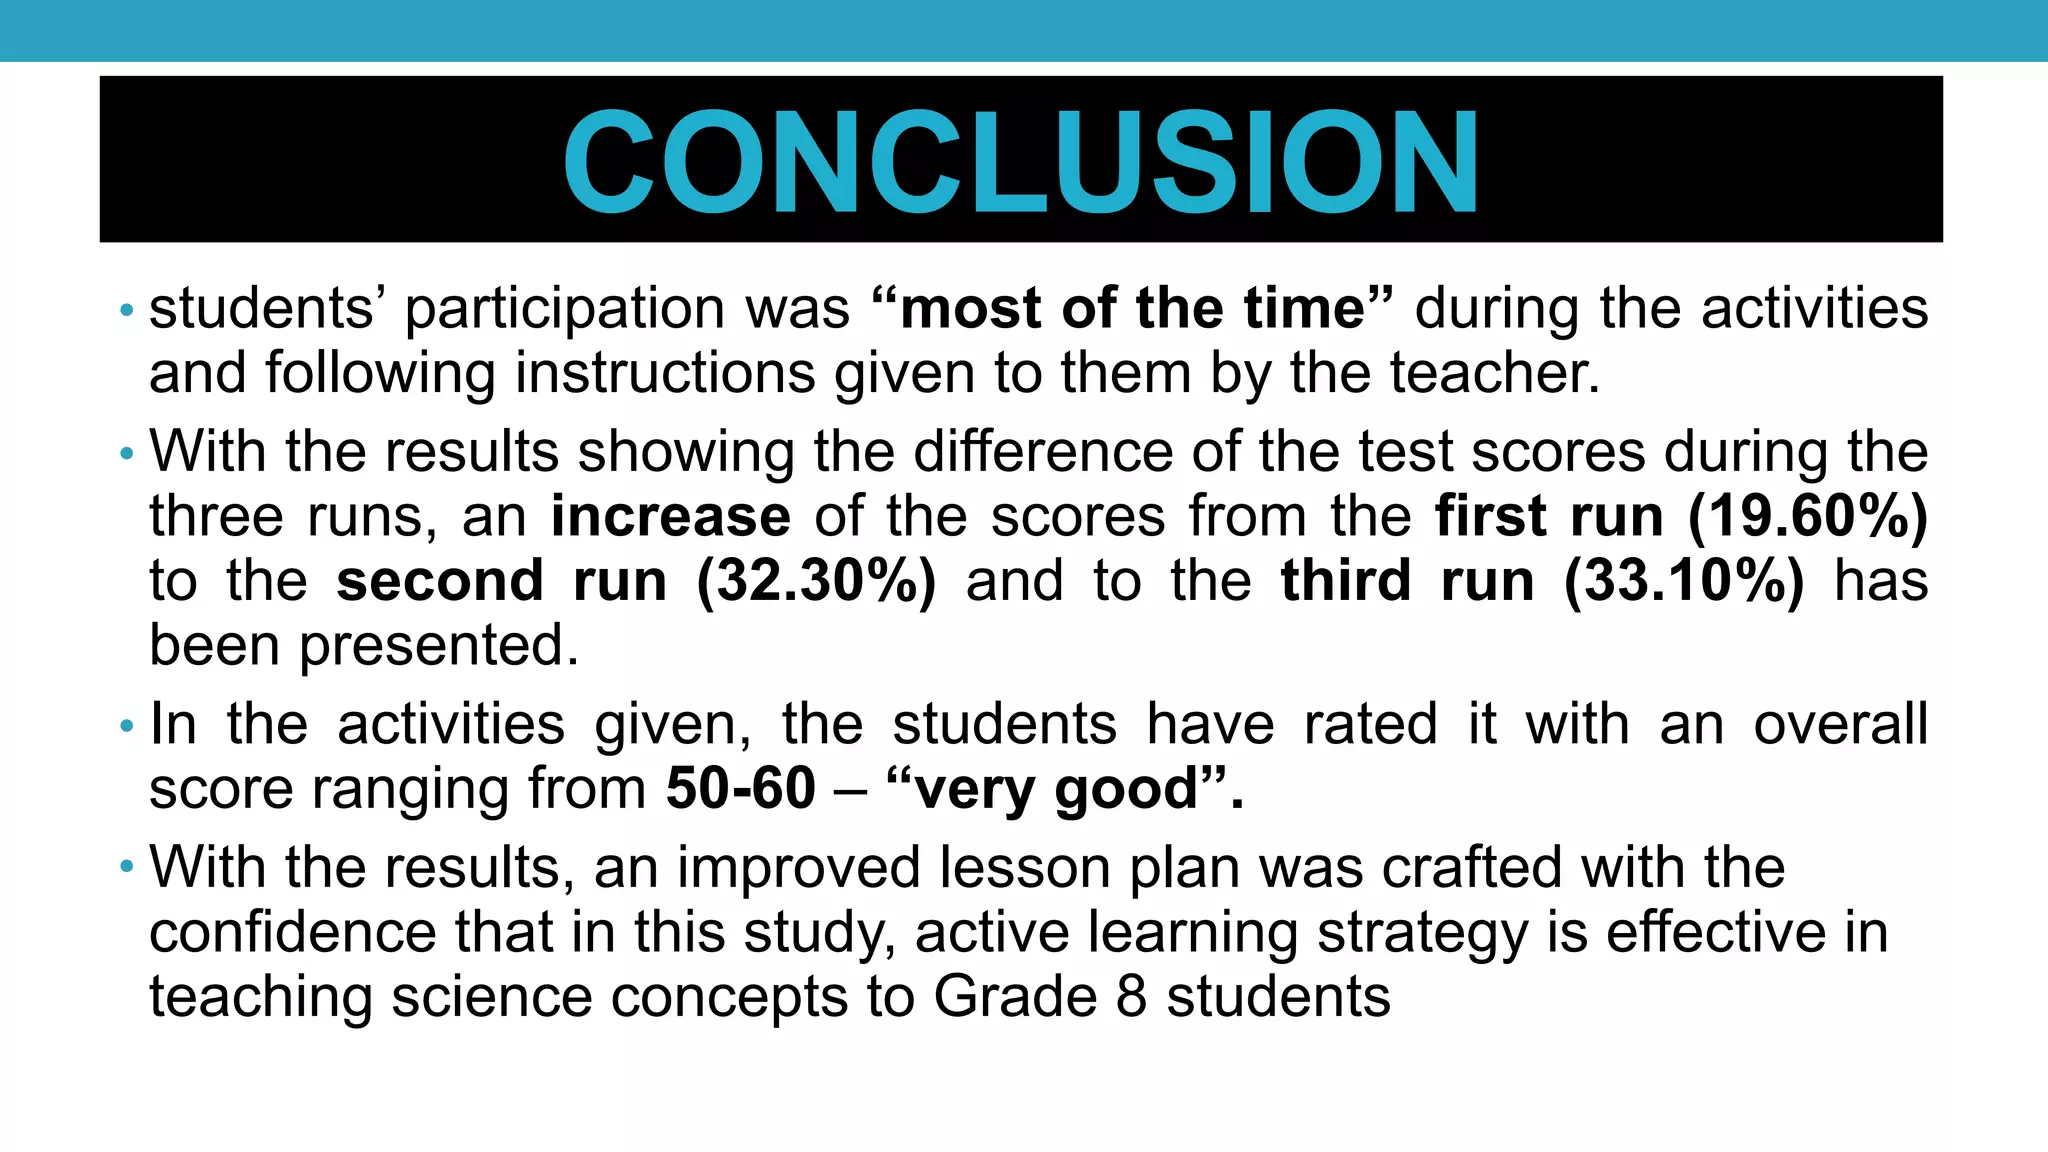
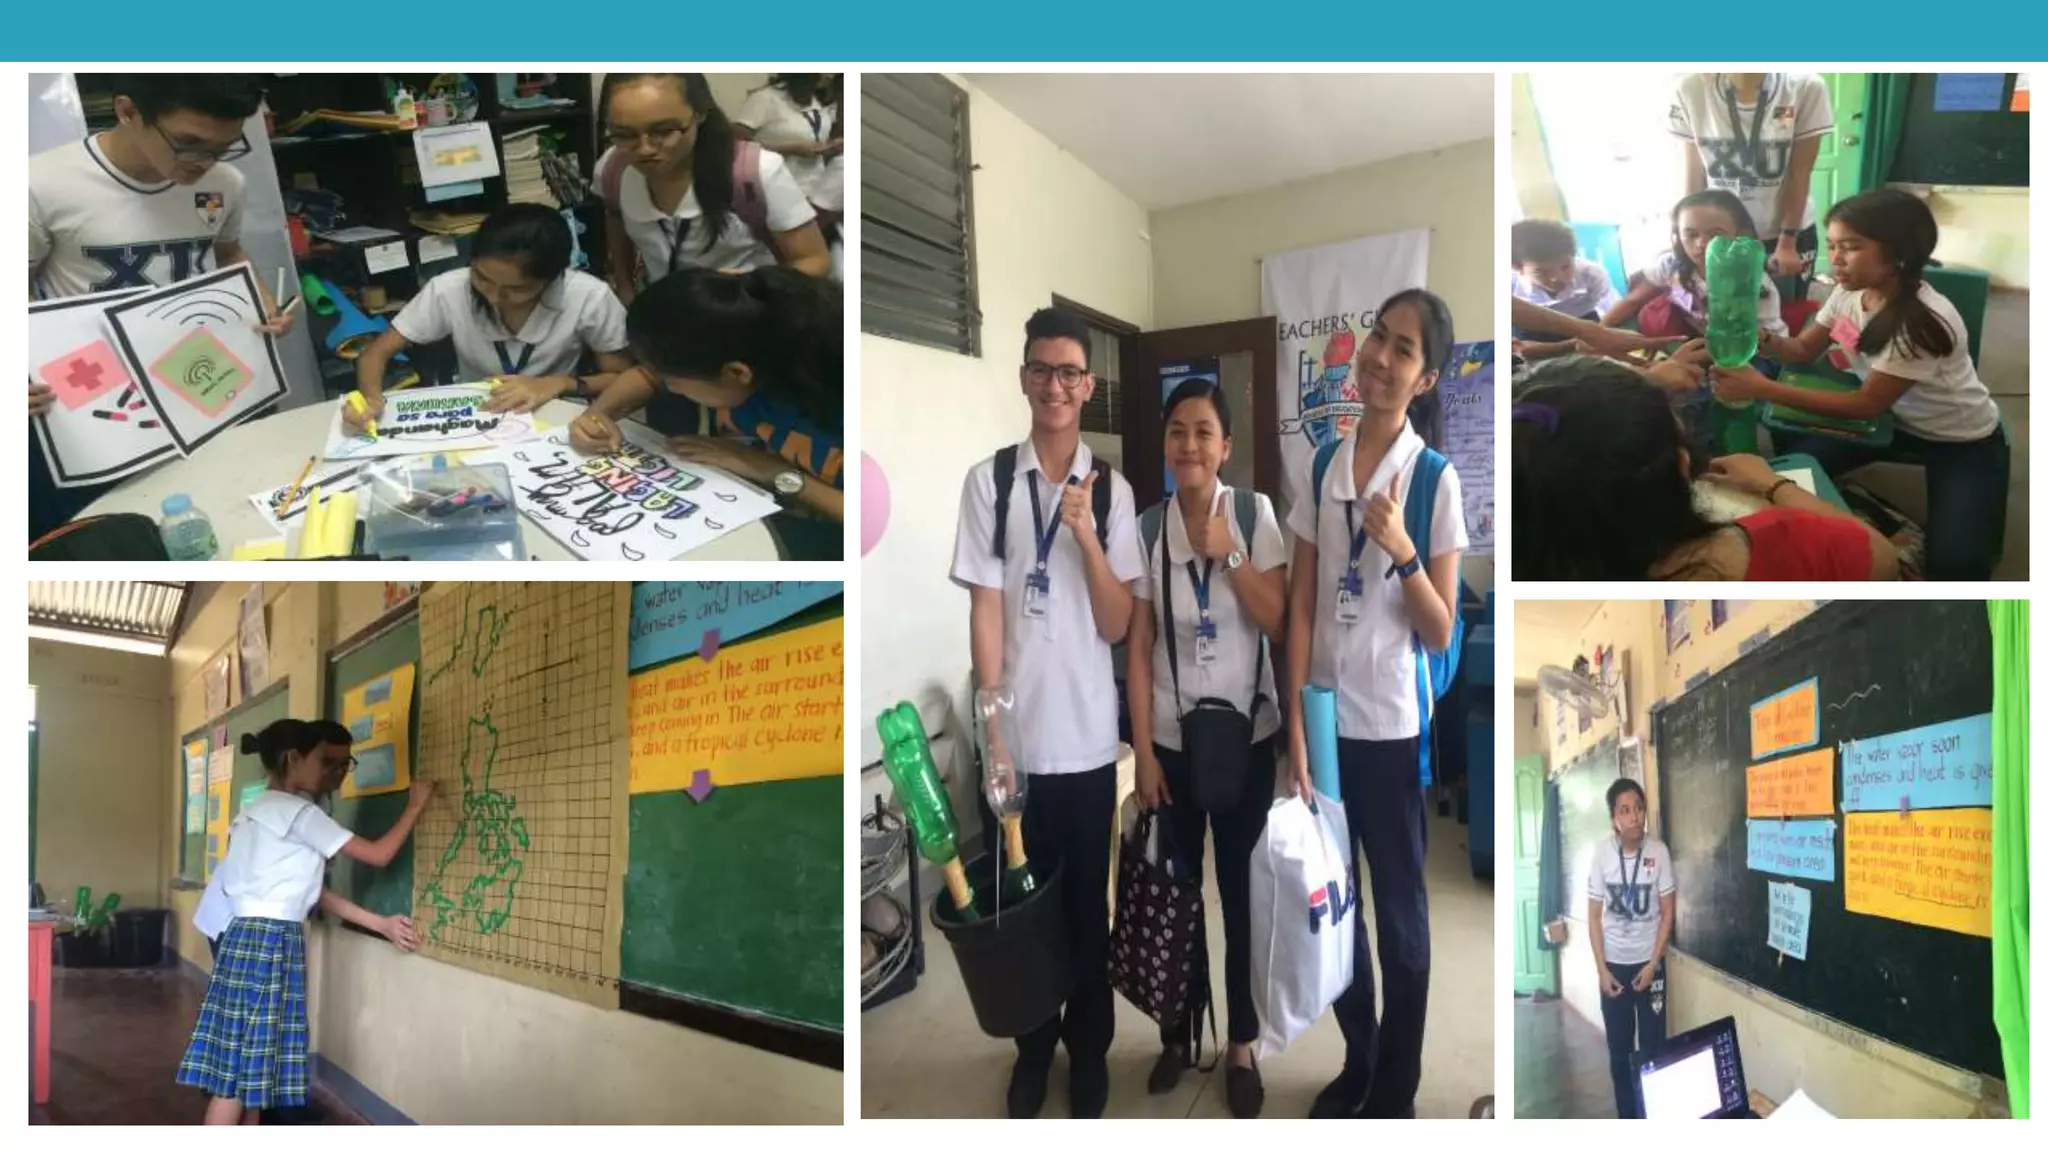
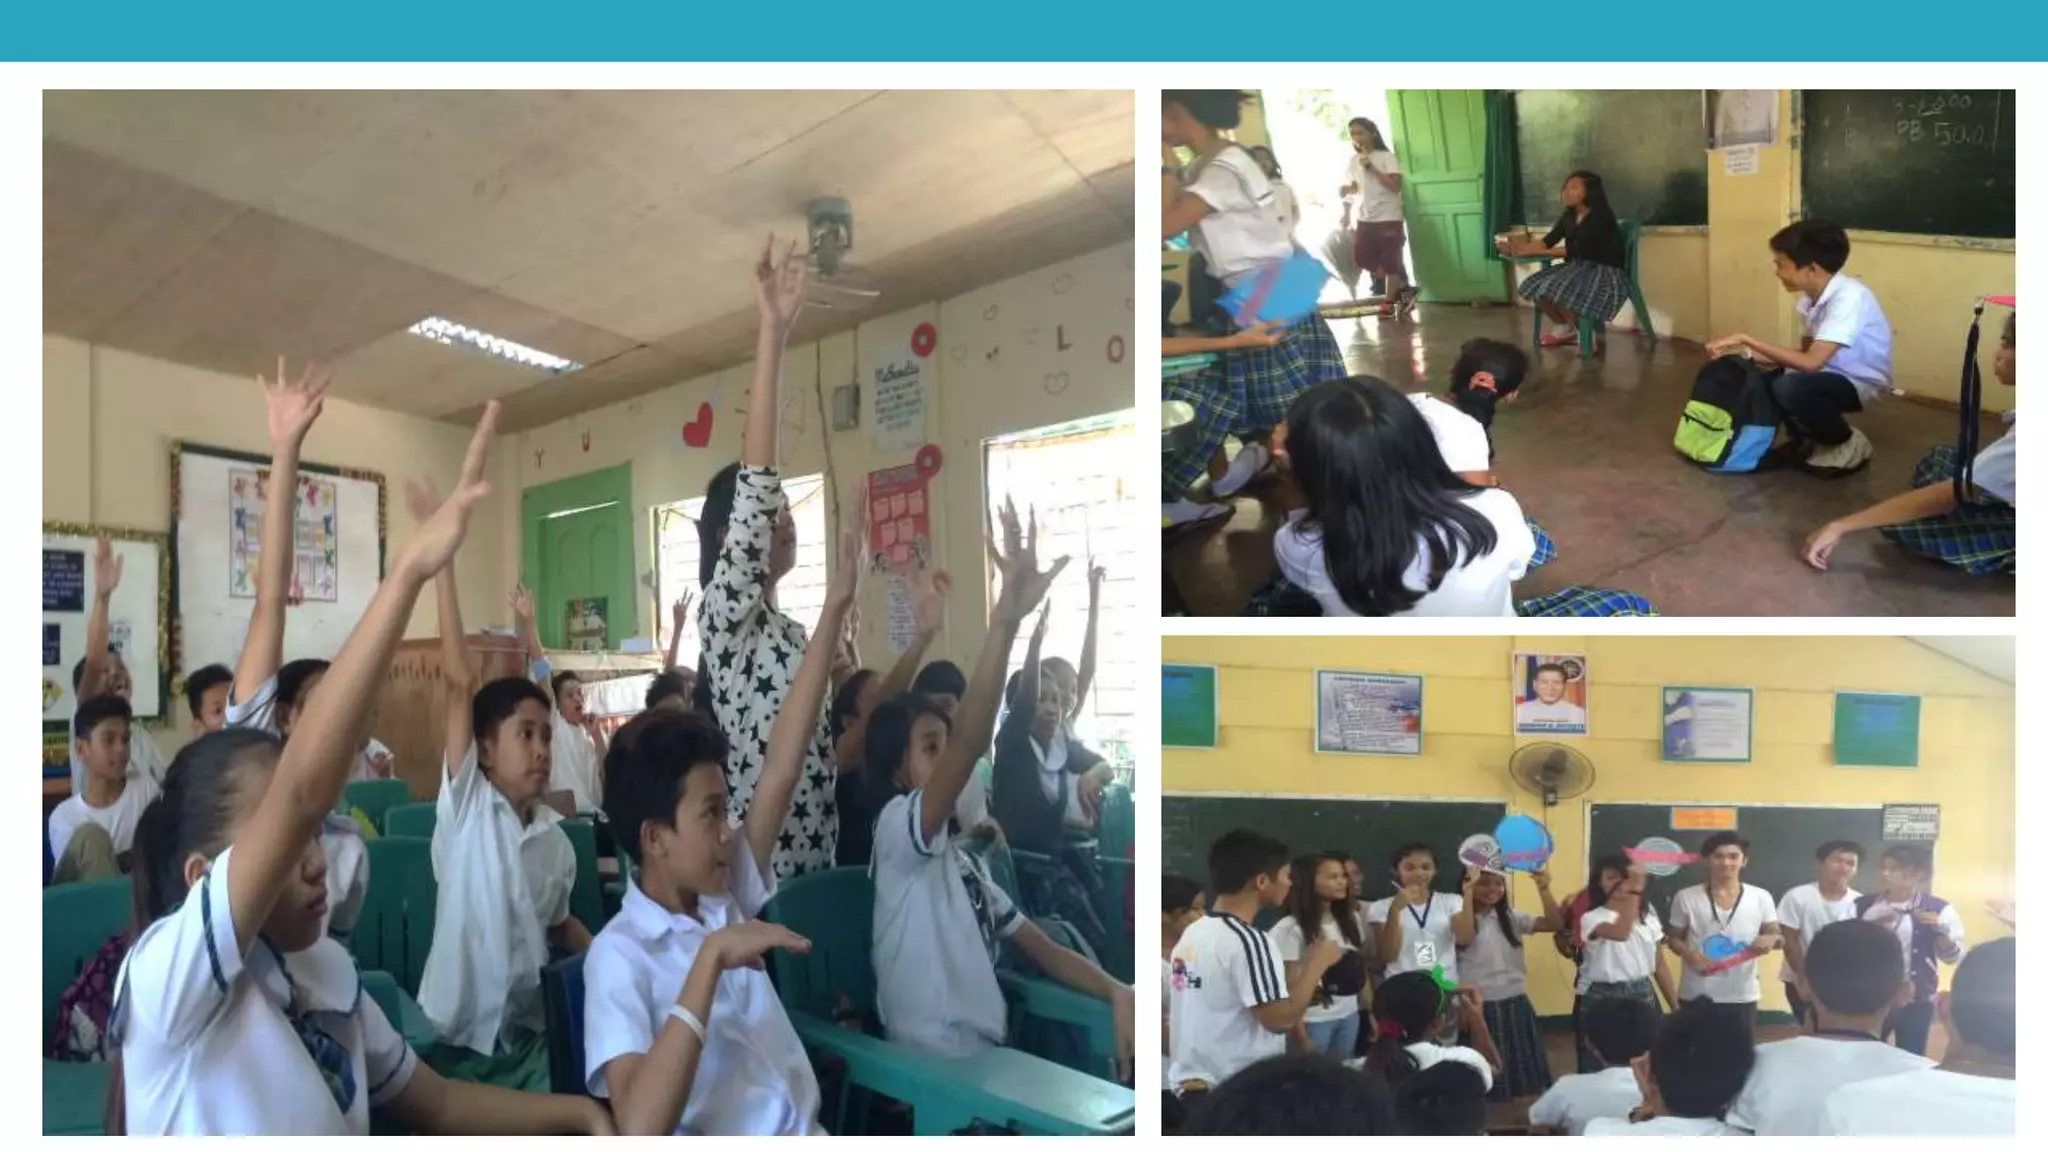

This document discusses the impact of active learning strategies on grade 8 students' performance in science, highlighting the necessity of student engagement in the learning process. It presents findings from various classes at Pedro 'Oloy' N. Roa High School, indicating significant improvements in test scores and student participation following active learning approaches over traditional methods. The researchers emphasize the effectiveness of collaborative lesson study as a means to enhance teaching and learning in science education.


