Downloaded 3,858 times


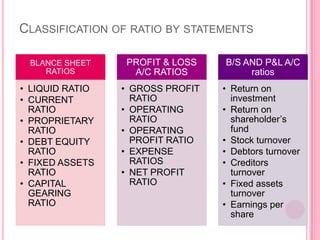
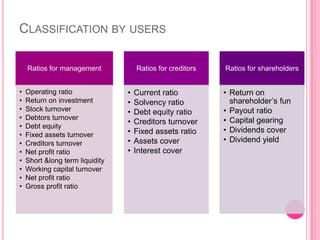
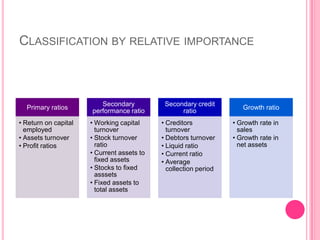
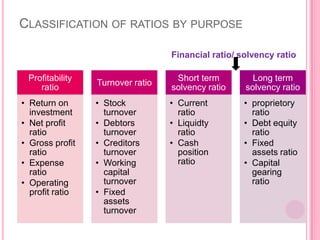


This document defines and discusses various types of ratio analysis used in accounting. It begins by defining a ratio as a mathematical relationship between two quantitative figures. It then outlines the main steps in ratio analysis and some key advantages and limitations. The rest of the document categorizes ratios in several ways: by financial statements, by intended users, by relative importance, and by purpose/function. It provides examples of specific ratios that fall under each of these categories, such as liquidity ratios, profitability ratios, and turnover ratios. The document aims to provide an overview of the different approaches to ratio analysis in accounting.


