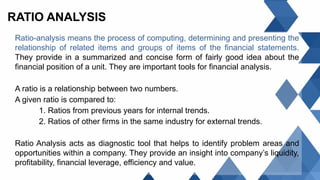
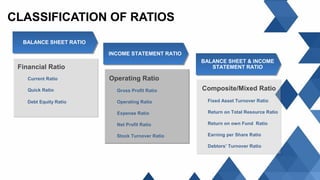
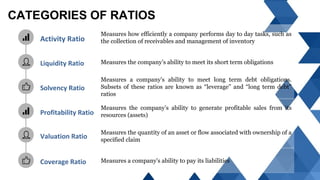
RATIO ANALYSISRATIO ANALYSIS
DHAKA UNIVERSITY
Department Of Banking And Insurance
MPB - 404
Financial Management
Presentation for:
Prof M. Muzahidul Islam
RATIO ANALYSIS
Ratio-analysis means the process of computing, determining and presenting the
relationship of related items and groups of items of the financial statements.
They provide in a summarized and concise form of fairly good idea about the
financial position of a unit. They are important tools for financial analysis.
A ratio is a relationship between two numbers.
A given ratio is compared to:
1. Ratios from previous years for internal trends.
2. Ratios of other firms in the same industry for external trends.
Ratio Analysis acts as diagnostic tool that helps to identify problem areas and
opportunities within a company. They provide an insight into company’s liquidity,
profitability, financial leverage, efficiency and value.
HOW A RATIO IS EXPRESSED
• As Percentage - such as 25% or 50% . For example if net profit is
Rs.25,000/- and the sales is Rs.1,00,000/- then the net profit can be
said to be 25% of the sales.
• As Proportion - The above figures may be expressed in terms of the
relationship between net profit to sales as 1 : 4.
• As Pure Number /Times - The same can also be expressed in an
alternatively way such as the sale is 4 times of the net profit or profit is
1/4th of the sales.
CLASSIFICATION OF RATIOS
BALANCE SHEET RATIOBALANCE SHEET RATIO
Current Ratio
Quick Ratio
Debt Equity Ratio
INCOME STATEMENT RATIOINCOME STATEMENT RATIO
BALANCE SHEET & INCOME
STATEMENT RATIO
BALANCE SHEET & INCOME
STATEMENT RATIOFinancial Ratio
Operating Ratio
Composite/Mixed RatioGross Profit Ratio
Operating Ratio
Expense Ratio
Net Profit Ratio
Stock Turnover Ratio
Fixed Asset Turnover Ratio
Return on Total Resource Ratio
Return on own Fund Ratio
Earning per Share Ratio
Debtors’ Turnover Ratio
Activity Ratio
Measures how efficiently a company performs day to day tasks, such as
the collection of receivables and management of inventory
Liquidity Ratio Measures the company’s ability to meet its short term obligations
Solvency Ratio
Measures a company’s ability to meet long term debt obligations.
Subsets of these ratios are known as “leverage” and “long term debt”
ratios
Profitability Ratio
Measures the company’s ability to generate profitable sales from its
resources (assets)
Valuation Ratio
Measures the quantity of an asset or flow associated with ownership of a
specified claim
Measures a company's ability to pay its liabilities
CATEGORIES OF RATIOS
Coverage Ratio
COMPARISON BETWEEN TWO PROMINENT BANK BYCOMPARISON BETWEEN TWO PROMINENT BANK BY
RATIO ANALYSISRATIO ANALYSIS
AB Bank Limited (the Bank) is one of the first generation
Private Commercial Banks (PCBs) incorporated in
Bangladesh on 31 December 1981 as a public limited
company under the Companies Act 1913, subsequently
replaced by the Companies Act 1994, and is governed by
the Bank Company Act, 1991 (Amendment up to 2013).
The Bank went for public issue of its shares on 28
December 1983 and its shares are listed with Dhaka Stock
Exchange Limited and Chittagong Stock Exchange Limited.
AB Bank Limited has 104 Branches including one (1) Islami
Banking Branch and one (1) Overseas Branch in Mumbai,
India. The Bank has five subsidiary companies namely AB
Investment Limited, AB Securities Limited, Cashlink
Bangladesh Limited, Arab Bangladesh Bank Foundation all
incorporated in Bangladesh and AB International Finance
Limited, incorporated in Hong Kong.
Market Price : Tk. 12.00
Paid Up : Tk. 7,581.30 Million
Reserve : Tk. 16,742.9 Million
Free Float Share : 462.69 Million Shares
Eastern Bank Limited, as a public limited company,
incorporated in Bangladesh on August 08, 1992 to carry
out all kinds of banking businesses in and outside
Bangladesh. Having taken over the businesses, assets,
liabilities and losses of erstwhile Bank of Credit &
Commerce International (Overseas) Limited as per BCCI
Reconstruction Scheme 1992 of Bangladesh Bank, the
bank commenced its operations on August 16, 1992. EBL
serves customers through a network of 82 branches, 13
priority centers, 4 student centers, 202 ATMs and 58
CDMs. The Bank is listed in the Dhaka Stock Exchange
Limited on 20 March 1993 and the Chittagong Stock
Exchange Limited on 11 September 2004 as a listed
company for trading of its shares.
Market Price : Tk. 28.80
Paid Up : Tk. 7,380.00 Million
Reserve : Tk. 13,451.80 Million
Free Float Share : 501.32 Million Shares
Sectorial P/E : 10.52 Times
Company P/E : 9.39 Times
COMPARISON BETWEEN TWO PROMINENT BANK BY RATIO ANALYSISCOMPARISON BETWEEN TWO PROMINENT BANK BY RATIO ANALYSIS
AD ratio:
The advances to deposits ratio measures loans (advances)
as a percentage of deposits. A ratio of 100% or less shows
that the bank is funding all its loans from deposits rather
than relying on wholesale funding (funding from the
capital markets or other banks). Also called LTD ratio
(loans to deposits). AD ratio of AB Banks’ from 2012 to
2016 are showing volatile performance but EBLs’ AD ratio
are growing up devoid of 2016.
NPL ratio:
A nonperforming loan (NPL) is the sum of borrowed
money upon which the debtor has not made his
scheduled payments for at least 90 days. A nonperforming
loan is either in default or close to being in default. Once a
loan is nonperforming, the odds that it will be repaid in
full are considered to be substantially lower. From 2012
NPL of AB Banks’ gradually increasing 5.19% at 2016 but
EBL have healthy performance in reducing NPL.
COMPARISON BETWEEN TWO PROMINENT BANK BY RATIO ANALYSISCOMPARISON BETWEEN TWO PROMINENT BANK BY RATIO ANALYSIS
CRAR:
The capital adequacy ratio (CAR) is a measure of a bank's
capital. It is expressed as a percentage of a bank's risk
weighted credit exposures. Also known as capital-to-risk
weighted assets ratio (CRAR), it is used to protect
depositors and promote the stability and efficiency of
financial systems around the world. From graph Capital
Adequacy ratio of EBL is better than AB Bank.
Cost/income ratio
The cost-to-income ratio is a key financial measure,
particularly important in valuing banks. It shows a
company’s costs in relation to its income. To get the ratio,
divide the operating costs (administrative and fixed costs,
such as salaries and property expenses, but not bad debts
that have been written off) by operating income. Cost
income ratio shows well from AB Bank to EBL.
COMPARISON BETWEEN TWO PROMINENT BANK BY RATIO ANALYSISCOMPARISON BETWEEN TWO PROMINENT BANK BY RATIO ANALYSIS
Return on equity (ROE) is a measure of profitability that
calculates how many dollars of profit a company
generates with each dollar of shareholders' equity. The
formula for ROE is:
ROE = Net Income/Shareholders' Equity
ROE is sometimes called "return on net worth.“
Sometimes abbreviated as ROE, is a company's net
income divided by its average stockholder's equity.
Return on assets (ROA) is an indicator of how profitable a
company is relative to its total assets. ROA gives a
manager, investor, or analyst an idea as to how efficient a
company's management is at using its assets to generate
earnings. Return on assets is displayed as a percentage
and it’s calculated as:
ROA = Net Income / Total Assets
Sometimes, the ROA is referred to as "return on
investment".
COMPARISON BETWEEN TWO PROMINENT BANK BY RATIO ANALYSISCOMPARISON BETWEEN TWO PROMINENT BANK BY RATIO ANALYSIS
Earnings per share (EPS) is the portion of a company's
profit allocated to each outstanding share of common
stock. Earnings per share serves as an indicator of a
company's profitability. EPS is calculated as:
EPS = (Net Income - Dividends on Preferred Stock) /
Average Outstanding Shares
The Book Value per Share formula is used to calculate the
per share value of a company based on its equity available
to common shareholders. The term "book value" is a
company's assets minus its liabilities and is sometimes
referred to as stockholder's equity, owner's equity,
shareholder's equity, or simply equity.
TWO PROMINENT BANK’S COMMON-SIZE ANALYSIS OF FINANCIALTWO PROMINENT BANK’S COMMON-SIZE ANALYSIS OF FINANCIAL
STATEMENTSSTATEMENTS
A common-size financial statement is displays line items as a percentage of one selected or common figure. Creating
common-size financial statements makes it easier to analyze a company over time and compare it with its peers.
Using common-size financial statements helps investors spot trends that a raw financial statement may not uncover.
TWO PROMINENT BANK’S COMMON-SIZE ANALYSIS OF FINANCIALTWO PROMINENT BANK’S COMMON-SIZE ANALYSIS OF FINANCIAL
STATEMENTSSTATEMENTS
Here we Common-size analysis of AB Bank Limited and Eastern Bank Limited on the base of data on 2012. Above
shows ratio analysis and common-size ratio we see increasing of EBLs’ operating income, total asset, total liability and
share holders’ equity are much better than AB Bank in 2016.
Thank you
01
Md. Mahmudul Hasan
ID: 51612037
02
Md. Abu Taher
ID: 51742049
03
Mohammad Shafiqul Alam Khan
ID: 5162030
04
Md. Zubaer Rahnan
ID: 51732016

Financial ratio analysis

  • 1.
    RATIO ANALYSISRATIO ANALYSIS DHAKAUNIVERSITY Department Of Banking And Insurance MPB - 404 Financial Management Presentation for: Prof M. Muzahidul Islam
  • 2.
    RATIO ANALYSIS Ratio-analysis meansthe process of computing, determining and presenting the relationship of related items and groups of items of the financial statements. They provide in a summarized and concise form of fairly good idea about the financial position of a unit. They are important tools for financial analysis. A ratio is a relationship between two numbers. A given ratio is compared to: 1. Ratios from previous years for internal trends. 2. Ratios of other firms in the same industry for external trends. Ratio Analysis acts as diagnostic tool that helps to identify problem areas and opportunities within a company. They provide an insight into company’s liquidity, profitability, financial leverage, efficiency and value.
  • 3.
    HOW A RATIOIS EXPRESSED • As Percentage - such as 25% or 50% . For example if net profit is Rs.25,000/- and the sales is Rs.1,00,000/- then the net profit can be said to be 25% of the sales. • As Proportion - The above figures may be expressed in terms of the relationship between net profit to sales as 1 : 4. • As Pure Number /Times - The same can also be expressed in an alternatively way such as the sale is 4 times of the net profit or profit is 1/4th of the sales.
  • 4.
    CLASSIFICATION OF RATIOS BALANCESHEET RATIOBALANCE SHEET RATIO Current Ratio Quick Ratio Debt Equity Ratio INCOME STATEMENT RATIOINCOME STATEMENT RATIO BALANCE SHEET & INCOME STATEMENT RATIO BALANCE SHEET & INCOME STATEMENT RATIOFinancial Ratio Operating Ratio Composite/Mixed RatioGross Profit Ratio Operating Ratio Expense Ratio Net Profit Ratio Stock Turnover Ratio Fixed Asset Turnover Ratio Return on Total Resource Ratio Return on own Fund Ratio Earning per Share Ratio Debtors’ Turnover Ratio
  • 5.
    Activity Ratio Measures howefficiently a company performs day to day tasks, such as the collection of receivables and management of inventory Liquidity Ratio Measures the company’s ability to meet its short term obligations Solvency Ratio Measures a company’s ability to meet long term debt obligations. Subsets of these ratios are known as “leverage” and “long term debt” ratios Profitability Ratio Measures the company’s ability to generate profitable sales from its resources (assets) Valuation Ratio Measures the quantity of an asset or flow associated with ownership of a specified claim Measures a company's ability to pay its liabilities CATEGORIES OF RATIOS Coverage Ratio
  • 6.
    COMPARISON BETWEEN TWOPROMINENT BANK BYCOMPARISON BETWEEN TWO PROMINENT BANK BY RATIO ANALYSISRATIO ANALYSIS AB Bank Limited (the Bank) is one of the first generation Private Commercial Banks (PCBs) incorporated in Bangladesh on 31 December 1981 as a public limited company under the Companies Act 1913, subsequently replaced by the Companies Act 1994, and is governed by the Bank Company Act, 1991 (Amendment up to 2013). The Bank went for public issue of its shares on 28 December 1983 and its shares are listed with Dhaka Stock Exchange Limited and Chittagong Stock Exchange Limited. AB Bank Limited has 104 Branches including one (1) Islami Banking Branch and one (1) Overseas Branch in Mumbai, India. The Bank has five subsidiary companies namely AB Investment Limited, AB Securities Limited, Cashlink Bangladesh Limited, Arab Bangladesh Bank Foundation all incorporated in Bangladesh and AB International Finance Limited, incorporated in Hong Kong. Market Price : Tk. 12.00 Paid Up : Tk. 7,581.30 Million Reserve : Tk. 16,742.9 Million Free Float Share : 462.69 Million Shares Eastern Bank Limited, as a public limited company, incorporated in Bangladesh on August 08, 1992 to carry out all kinds of banking businesses in and outside Bangladesh. Having taken over the businesses, assets, liabilities and losses of erstwhile Bank of Credit & Commerce International (Overseas) Limited as per BCCI Reconstruction Scheme 1992 of Bangladesh Bank, the bank commenced its operations on August 16, 1992. EBL serves customers through a network of 82 branches, 13 priority centers, 4 student centers, 202 ATMs and 58 CDMs. The Bank is listed in the Dhaka Stock Exchange Limited on 20 March 1993 and the Chittagong Stock Exchange Limited on 11 September 2004 as a listed company for trading of its shares. Market Price : Tk. 28.80 Paid Up : Tk. 7,380.00 Million Reserve : Tk. 13,451.80 Million Free Float Share : 501.32 Million Shares Sectorial P/E : 10.52 Times Company P/E : 9.39 Times
  • 7.
    COMPARISON BETWEEN TWOPROMINENT BANK BY RATIO ANALYSISCOMPARISON BETWEEN TWO PROMINENT BANK BY RATIO ANALYSIS AD ratio: The advances to deposits ratio measures loans (advances) as a percentage of deposits. A ratio of 100% or less shows that the bank is funding all its loans from deposits rather than relying on wholesale funding (funding from the capital markets or other banks). Also called LTD ratio (loans to deposits). AD ratio of AB Banks’ from 2012 to 2016 are showing volatile performance but EBLs’ AD ratio are growing up devoid of 2016. NPL ratio: A nonperforming loan (NPL) is the sum of borrowed money upon which the debtor has not made his scheduled payments for at least 90 days. A nonperforming loan is either in default or close to being in default. Once a loan is nonperforming, the odds that it will be repaid in full are considered to be substantially lower. From 2012 NPL of AB Banks’ gradually increasing 5.19% at 2016 but EBL have healthy performance in reducing NPL.
  • 8.
    COMPARISON BETWEEN TWOPROMINENT BANK BY RATIO ANALYSISCOMPARISON BETWEEN TWO PROMINENT BANK BY RATIO ANALYSIS CRAR: The capital adequacy ratio (CAR) is a measure of a bank's capital. It is expressed as a percentage of a bank's risk weighted credit exposures. Also known as capital-to-risk weighted assets ratio (CRAR), it is used to protect depositors and promote the stability and efficiency of financial systems around the world. From graph Capital Adequacy ratio of EBL is better than AB Bank. Cost/income ratio The cost-to-income ratio is a key financial measure, particularly important in valuing banks. It shows a company’s costs in relation to its income. To get the ratio, divide the operating costs (administrative and fixed costs, such as salaries and property expenses, but not bad debts that have been written off) by operating income. Cost income ratio shows well from AB Bank to EBL.
  • 9.
    COMPARISON BETWEEN TWOPROMINENT BANK BY RATIO ANALYSISCOMPARISON BETWEEN TWO PROMINENT BANK BY RATIO ANALYSIS Return on equity (ROE) is a measure of profitability that calculates how many dollars of profit a company generates with each dollar of shareholders' equity. The formula for ROE is: ROE = Net Income/Shareholders' Equity ROE is sometimes called "return on net worth.“ Sometimes abbreviated as ROE, is a company's net income divided by its average stockholder's equity. Return on assets (ROA) is an indicator of how profitable a company is relative to its total assets. ROA gives a manager, investor, or analyst an idea as to how efficient a company's management is at using its assets to generate earnings. Return on assets is displayed as a percentage and it’s calculated as: ROA = Net Income / Total Assets Sometimes, the ROA is referred to as "return on investment".
  • 10.
    COMPARISON BETWEEN TWOPROMINENT BANK BY RATIO ANALYSISCOMPARISON BETWEEN TWO PROMINENT BANK BY RATIO ANALYSIS Earnings per share (EPS) is the portion of a company's profit allocated to each outstanding share of common stock. Earnings per share serves as an indicator of a company's profitability. EPS is calculated as: EPS = (Net Income - Dividends on Preferred Stock) / Average Outstanding Shares The Book Value per Share formula is used to calculate the per share value of a company based on its equity available to common shareholders. The term "book value" is a company's assets minus its liabilities and is sometimes referred to as stockholder's equity, owner's equity, shareholder's equity, or simply equity.
  • 11.
    TWO PROMINENT BANK’SCOMMON-SIZE ANALYSIS OF FINANCIALTWO PROMINENT BANK’S COMMON-SIZE ANALYSIS OF FINANCIAL STATEMENTSSTATEMENTS A common-size financial statement is displays line items as a percentage of one selected or common figure. Creating common-size financial statements makes it easier to analyze a company over time and compare it with its peers. Using common-size financial statements helps investors spot trends that a raw financial statement may not uncover.
  • 12.
    TWO PROMINENT BANK’SCOMMON-SIZE ANALYSIS OF FINANCIALTWO PROMINENT BANK’S COMMON-SIZE ANALYSIS OF FINANCIAL STATEMENTSSTATEMENTS Here we Common-size analysis of AB Bank Limited and Eastern Bank Limited on the base of data on 2012. Above shows ratio analysis and common-size ratio we see increasing of EBLs’ operating income, total asset, total liability and share holders’ equity are much better than AB Bank in 2016.
  • 13.
    Thank you 01 Md. MahmudulHasan ID: 51612037 02 Md. Abu Taher ID: 51742049 03 Mohammad Shafiqul Alam Khan ID: 5162030 04 Md. Zubaer Rahnan ID: 51732016