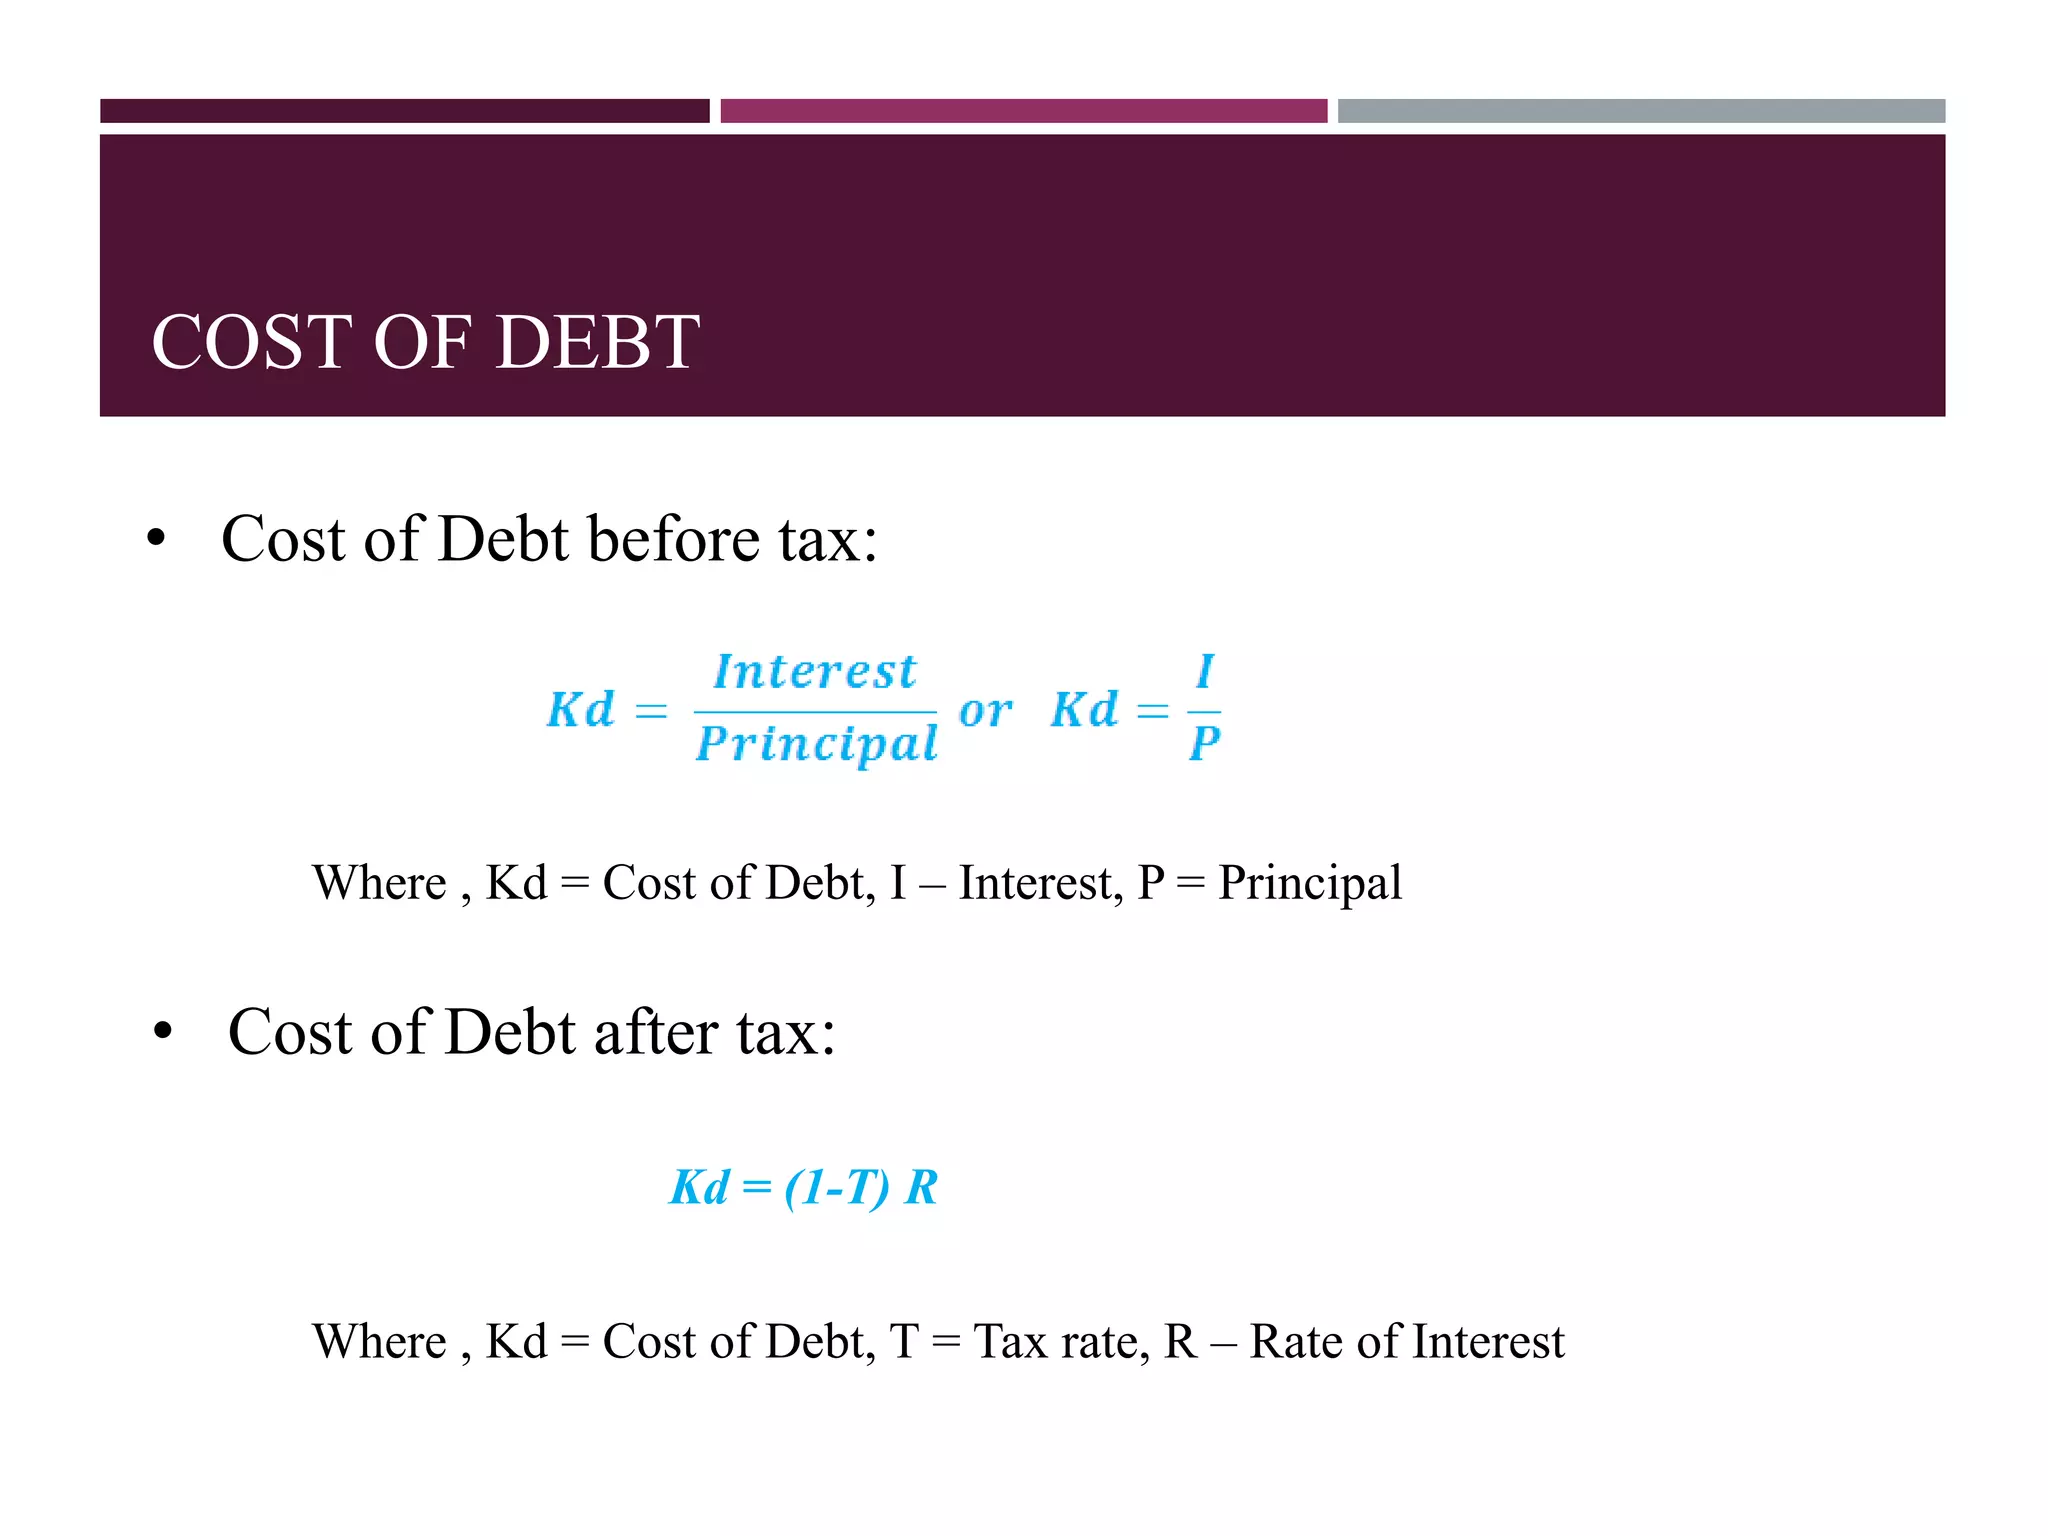
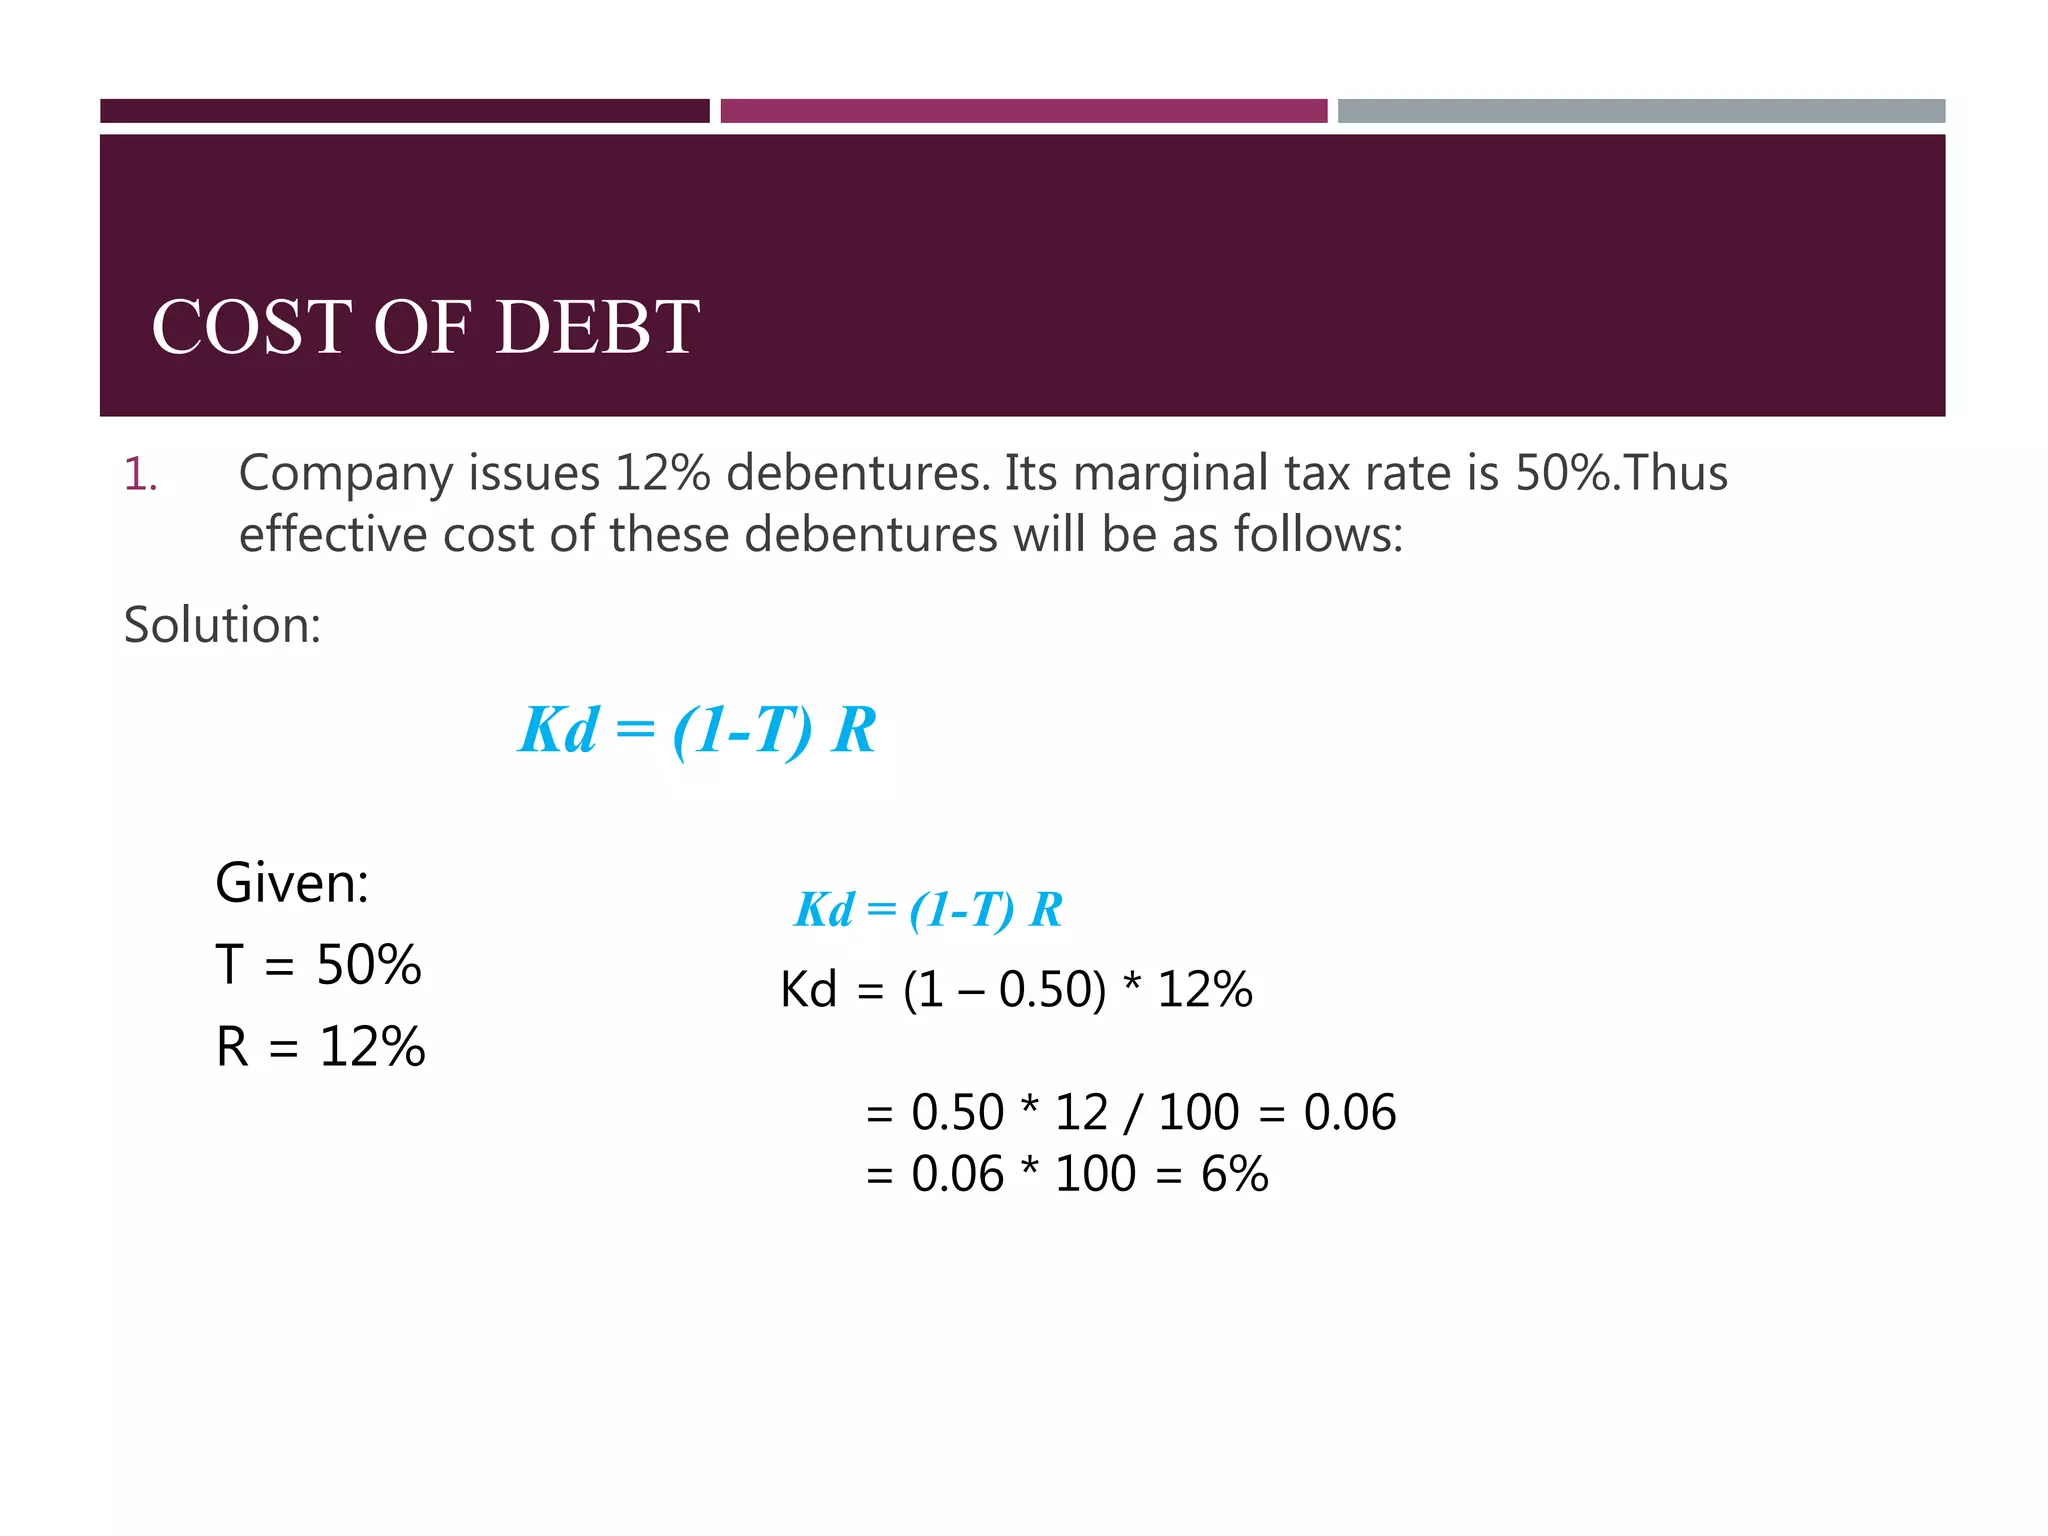
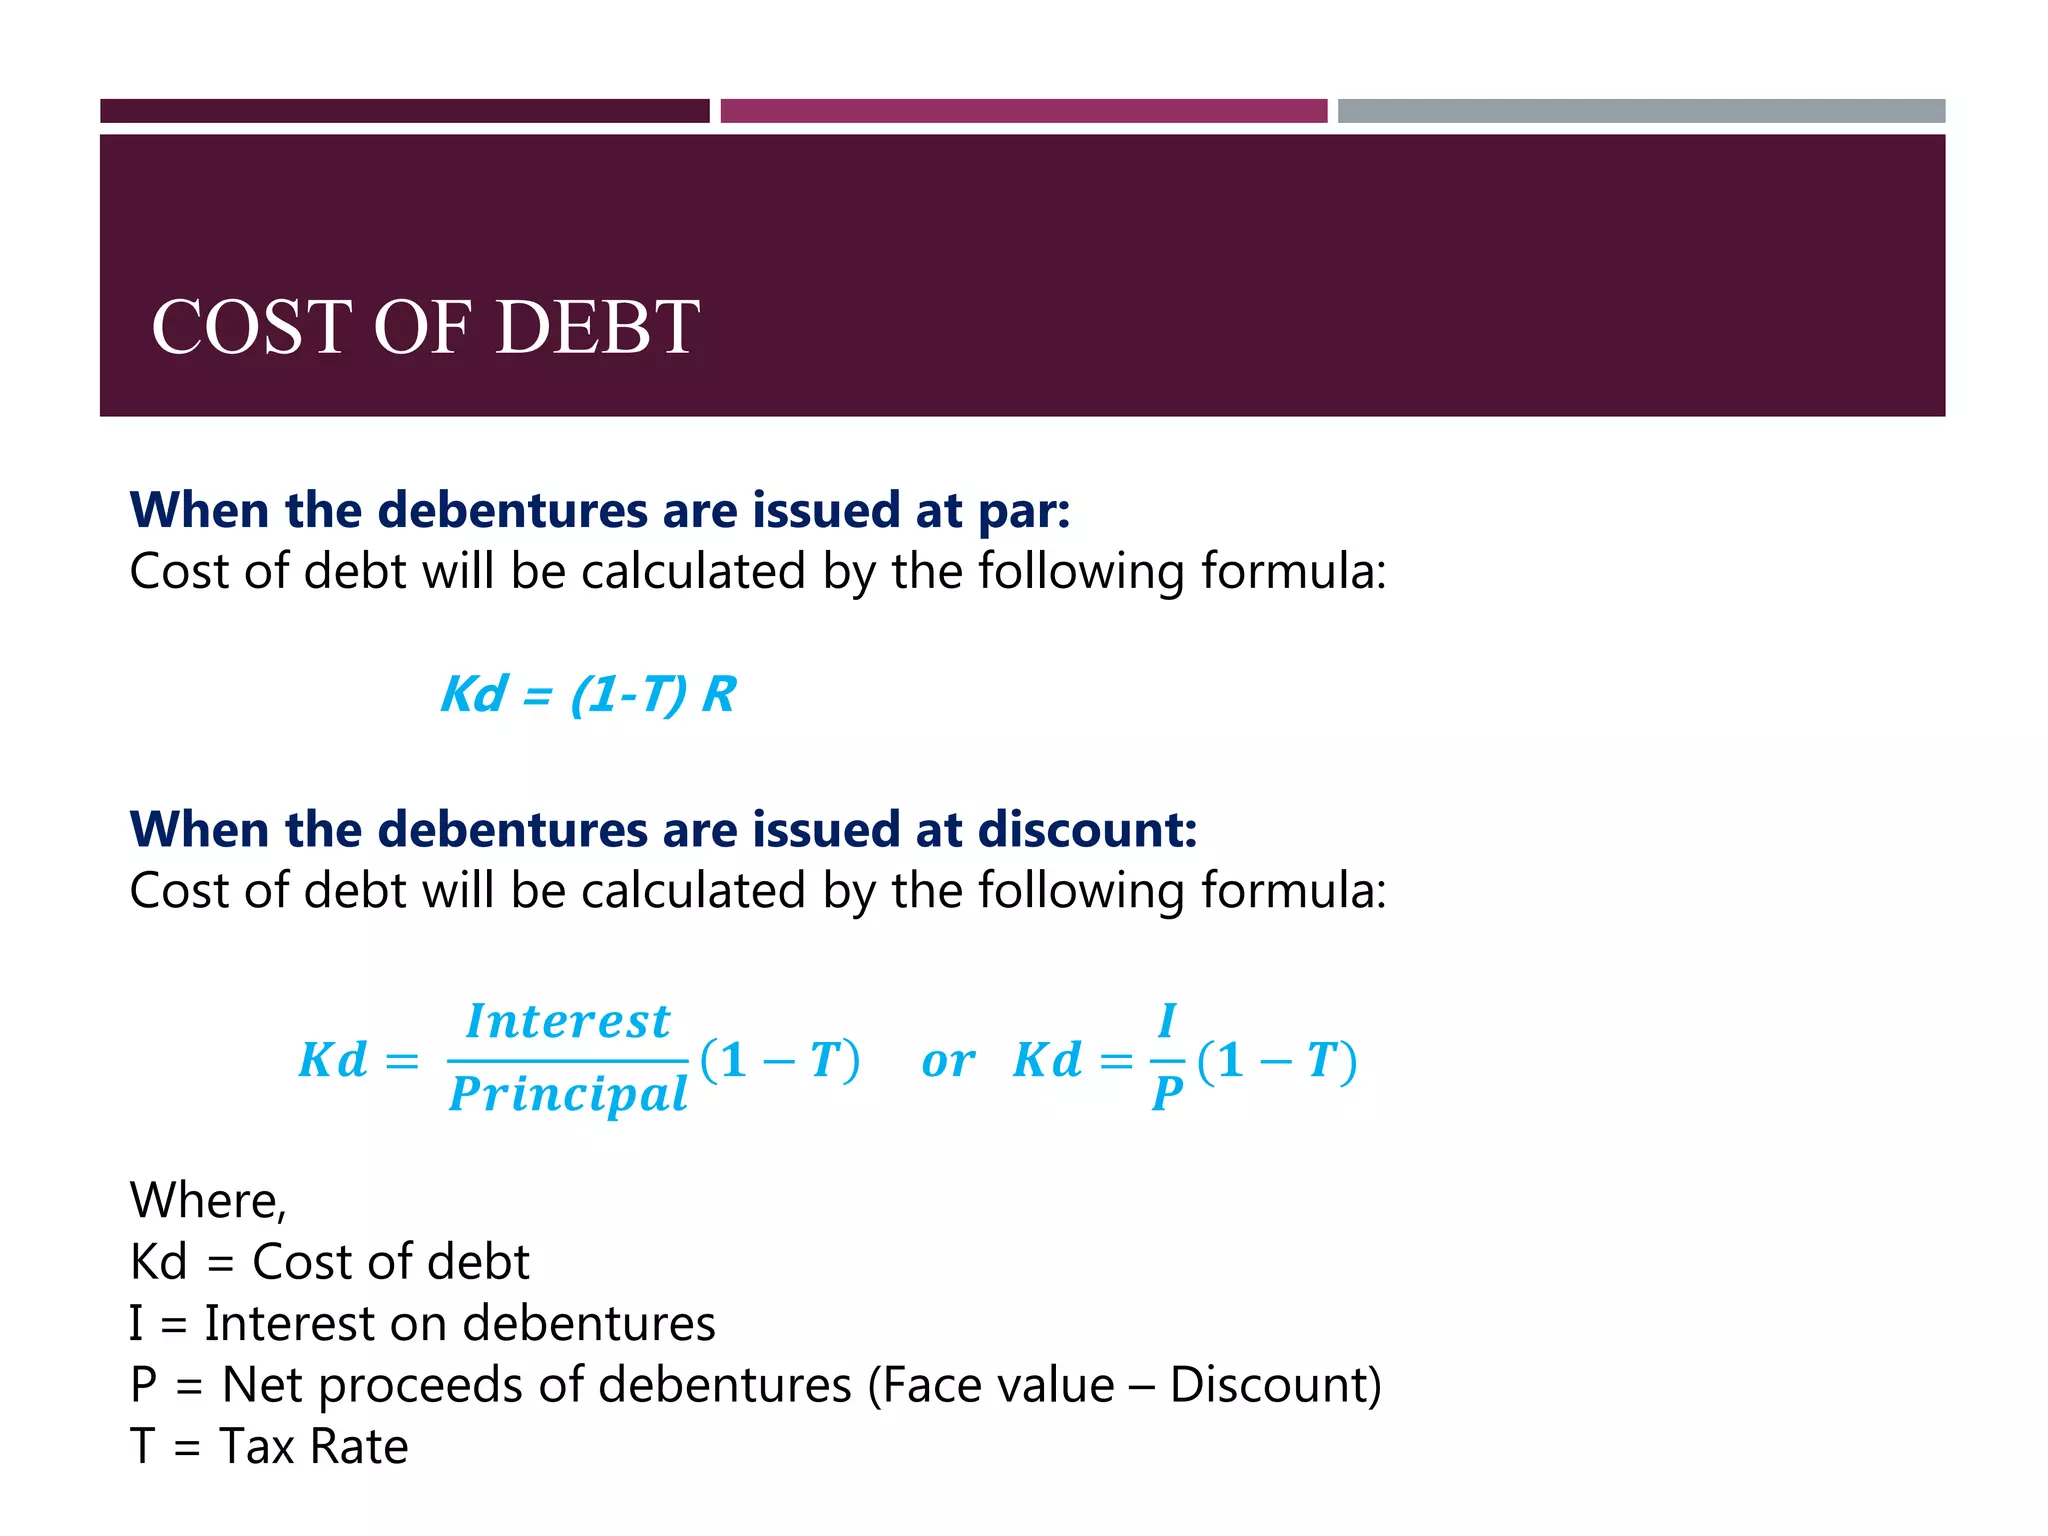
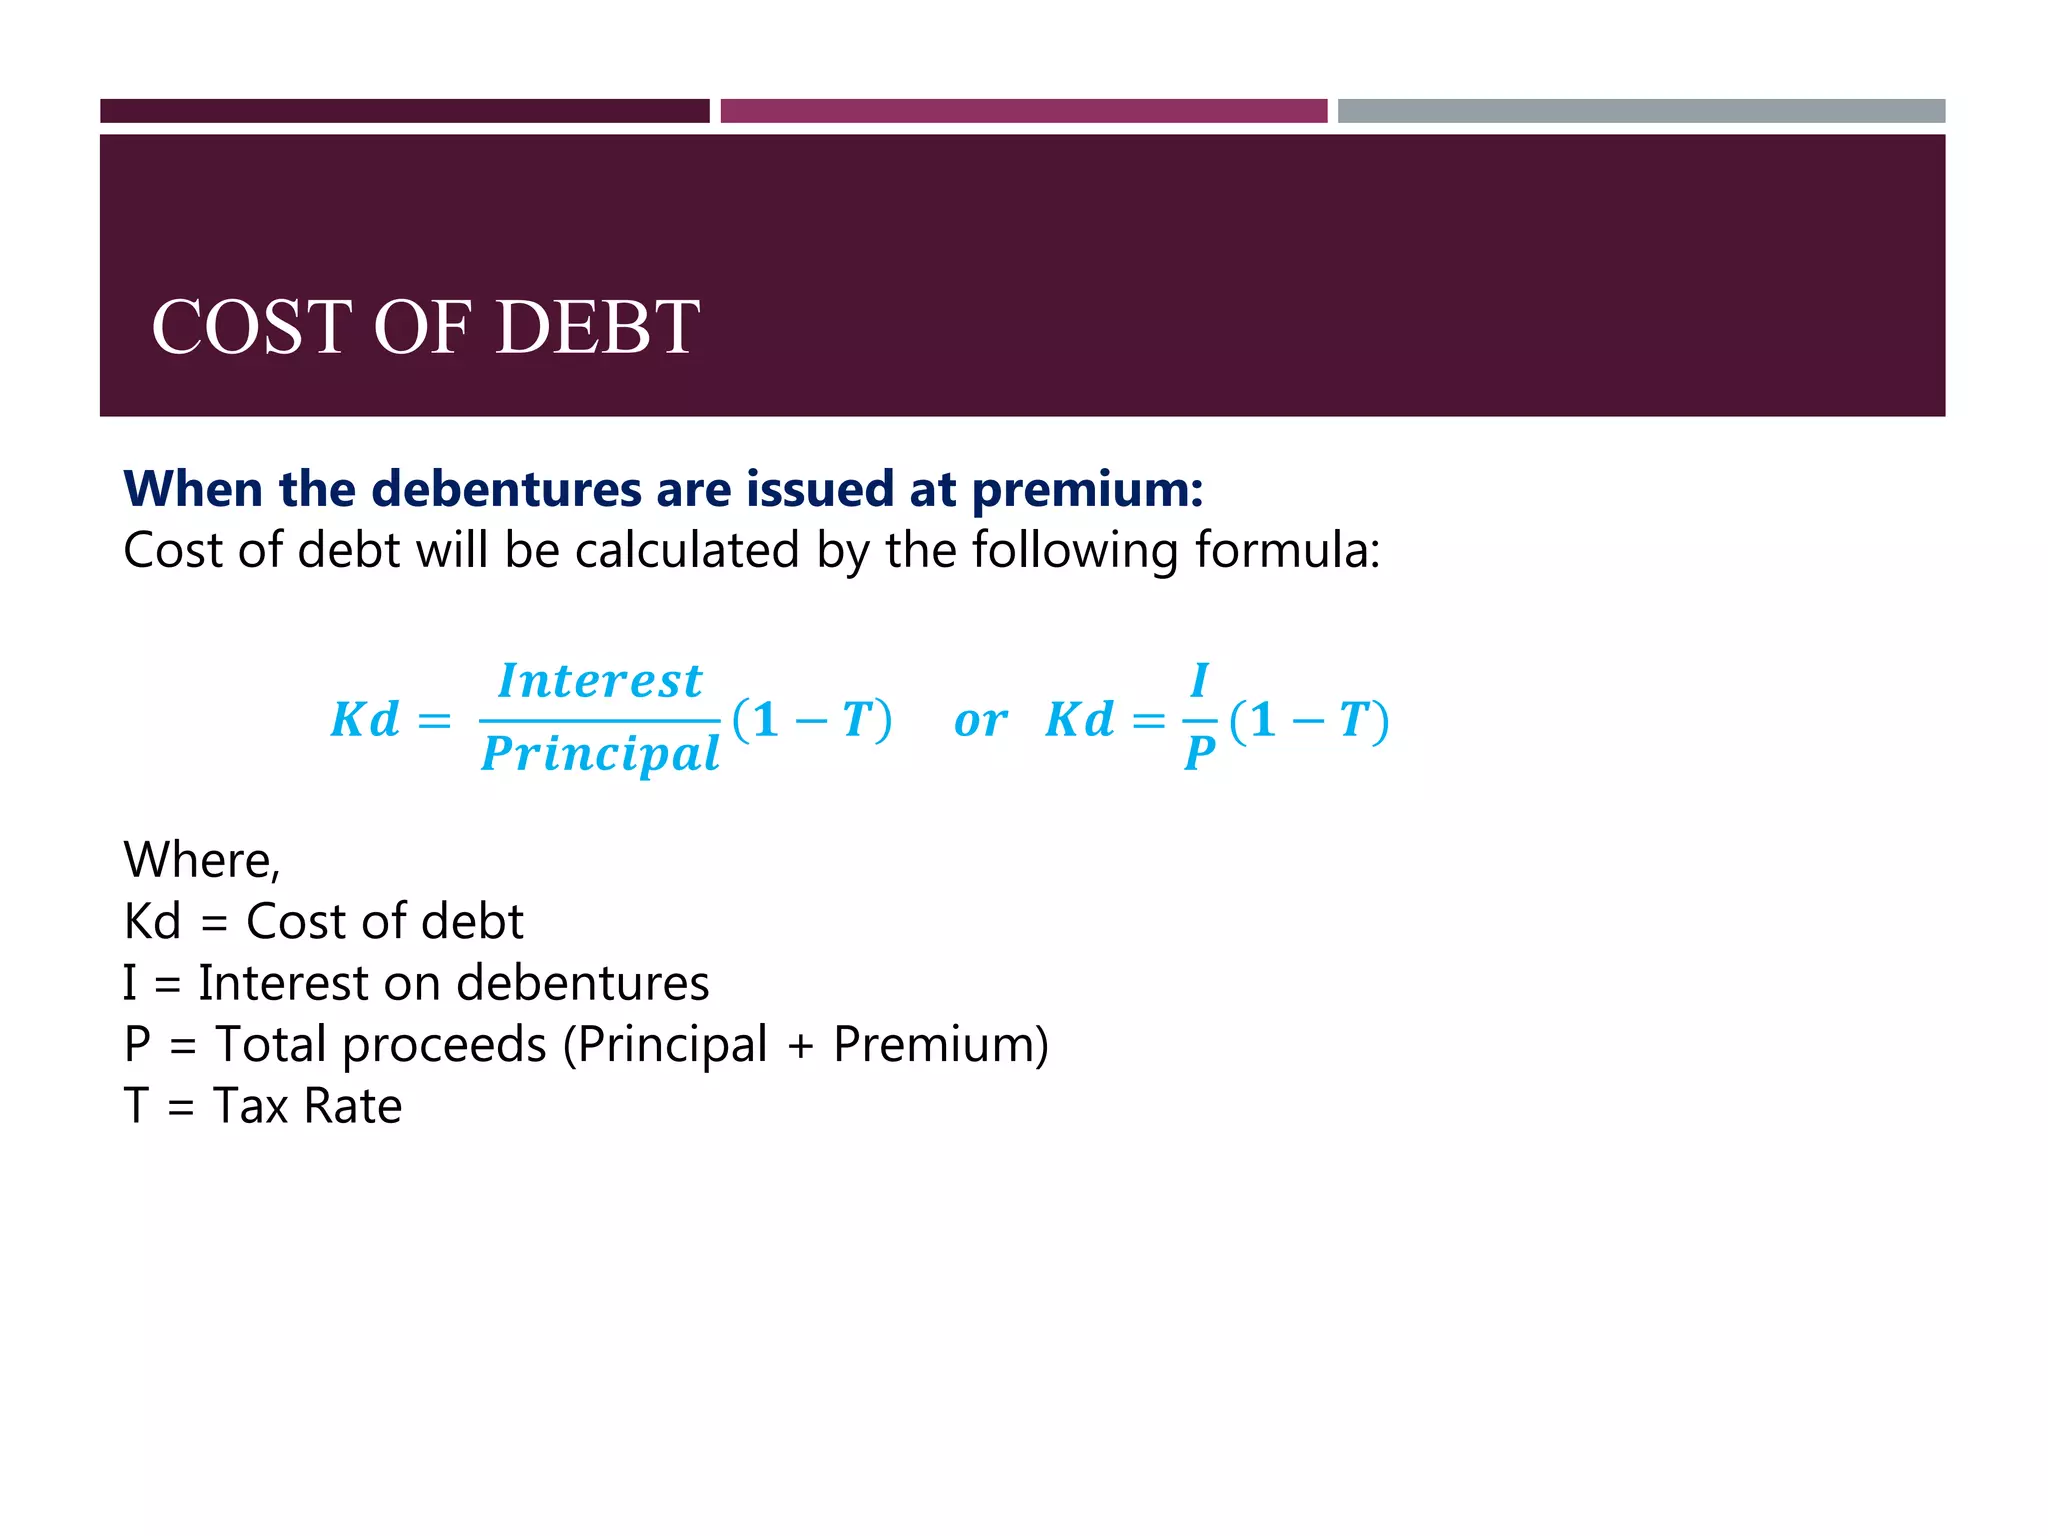
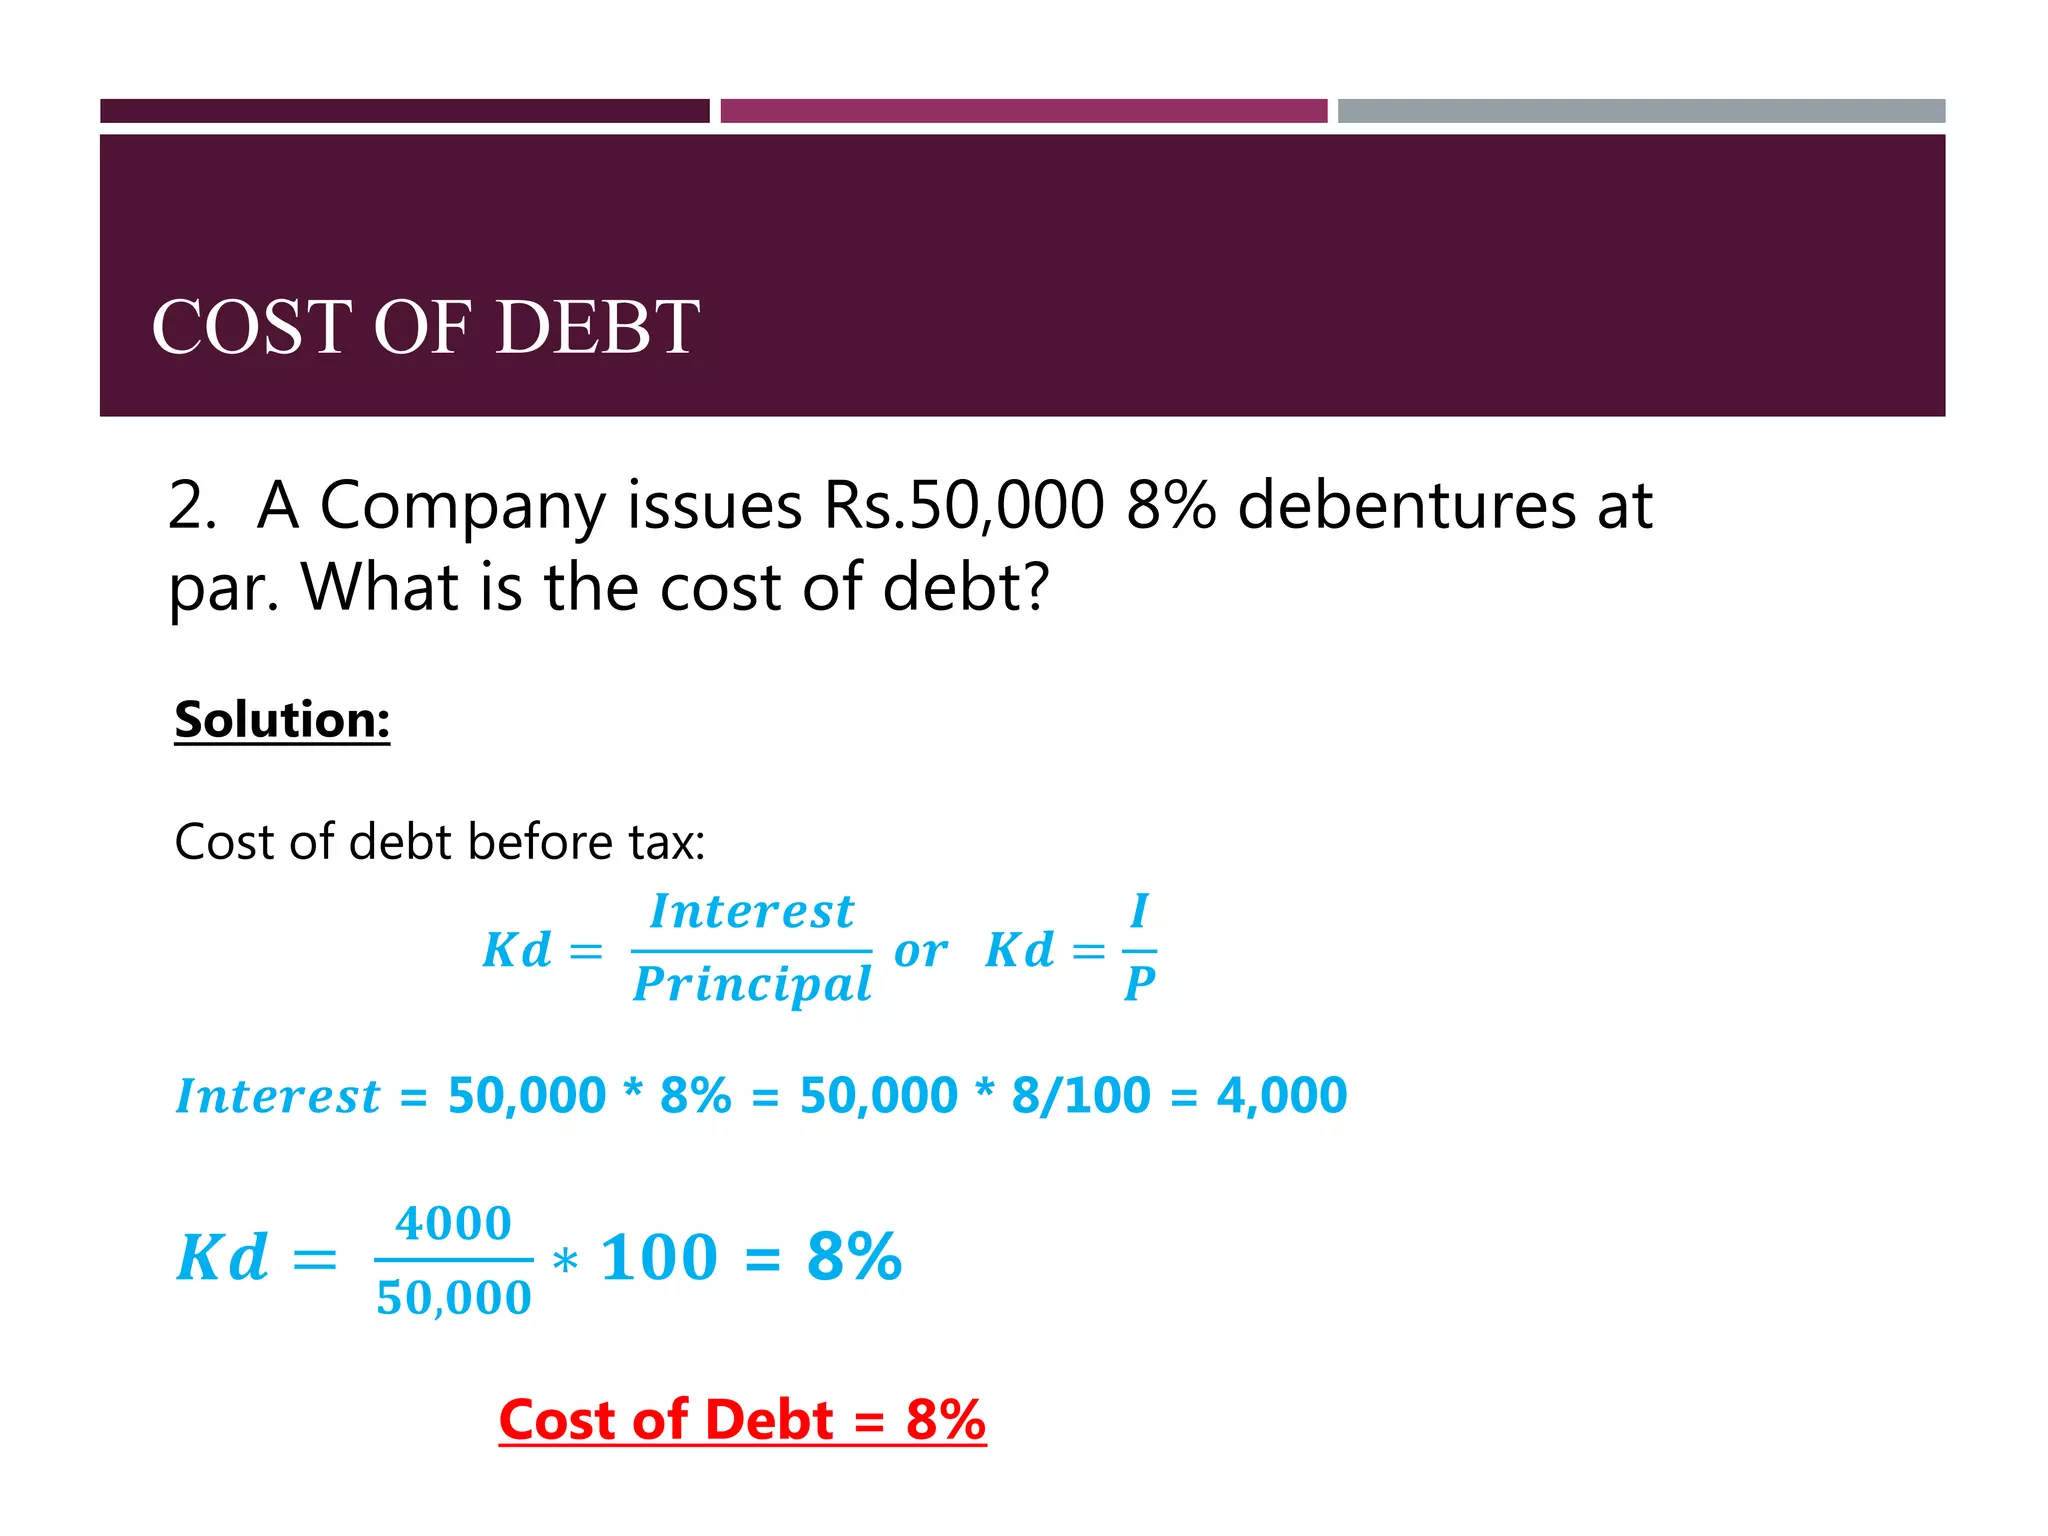
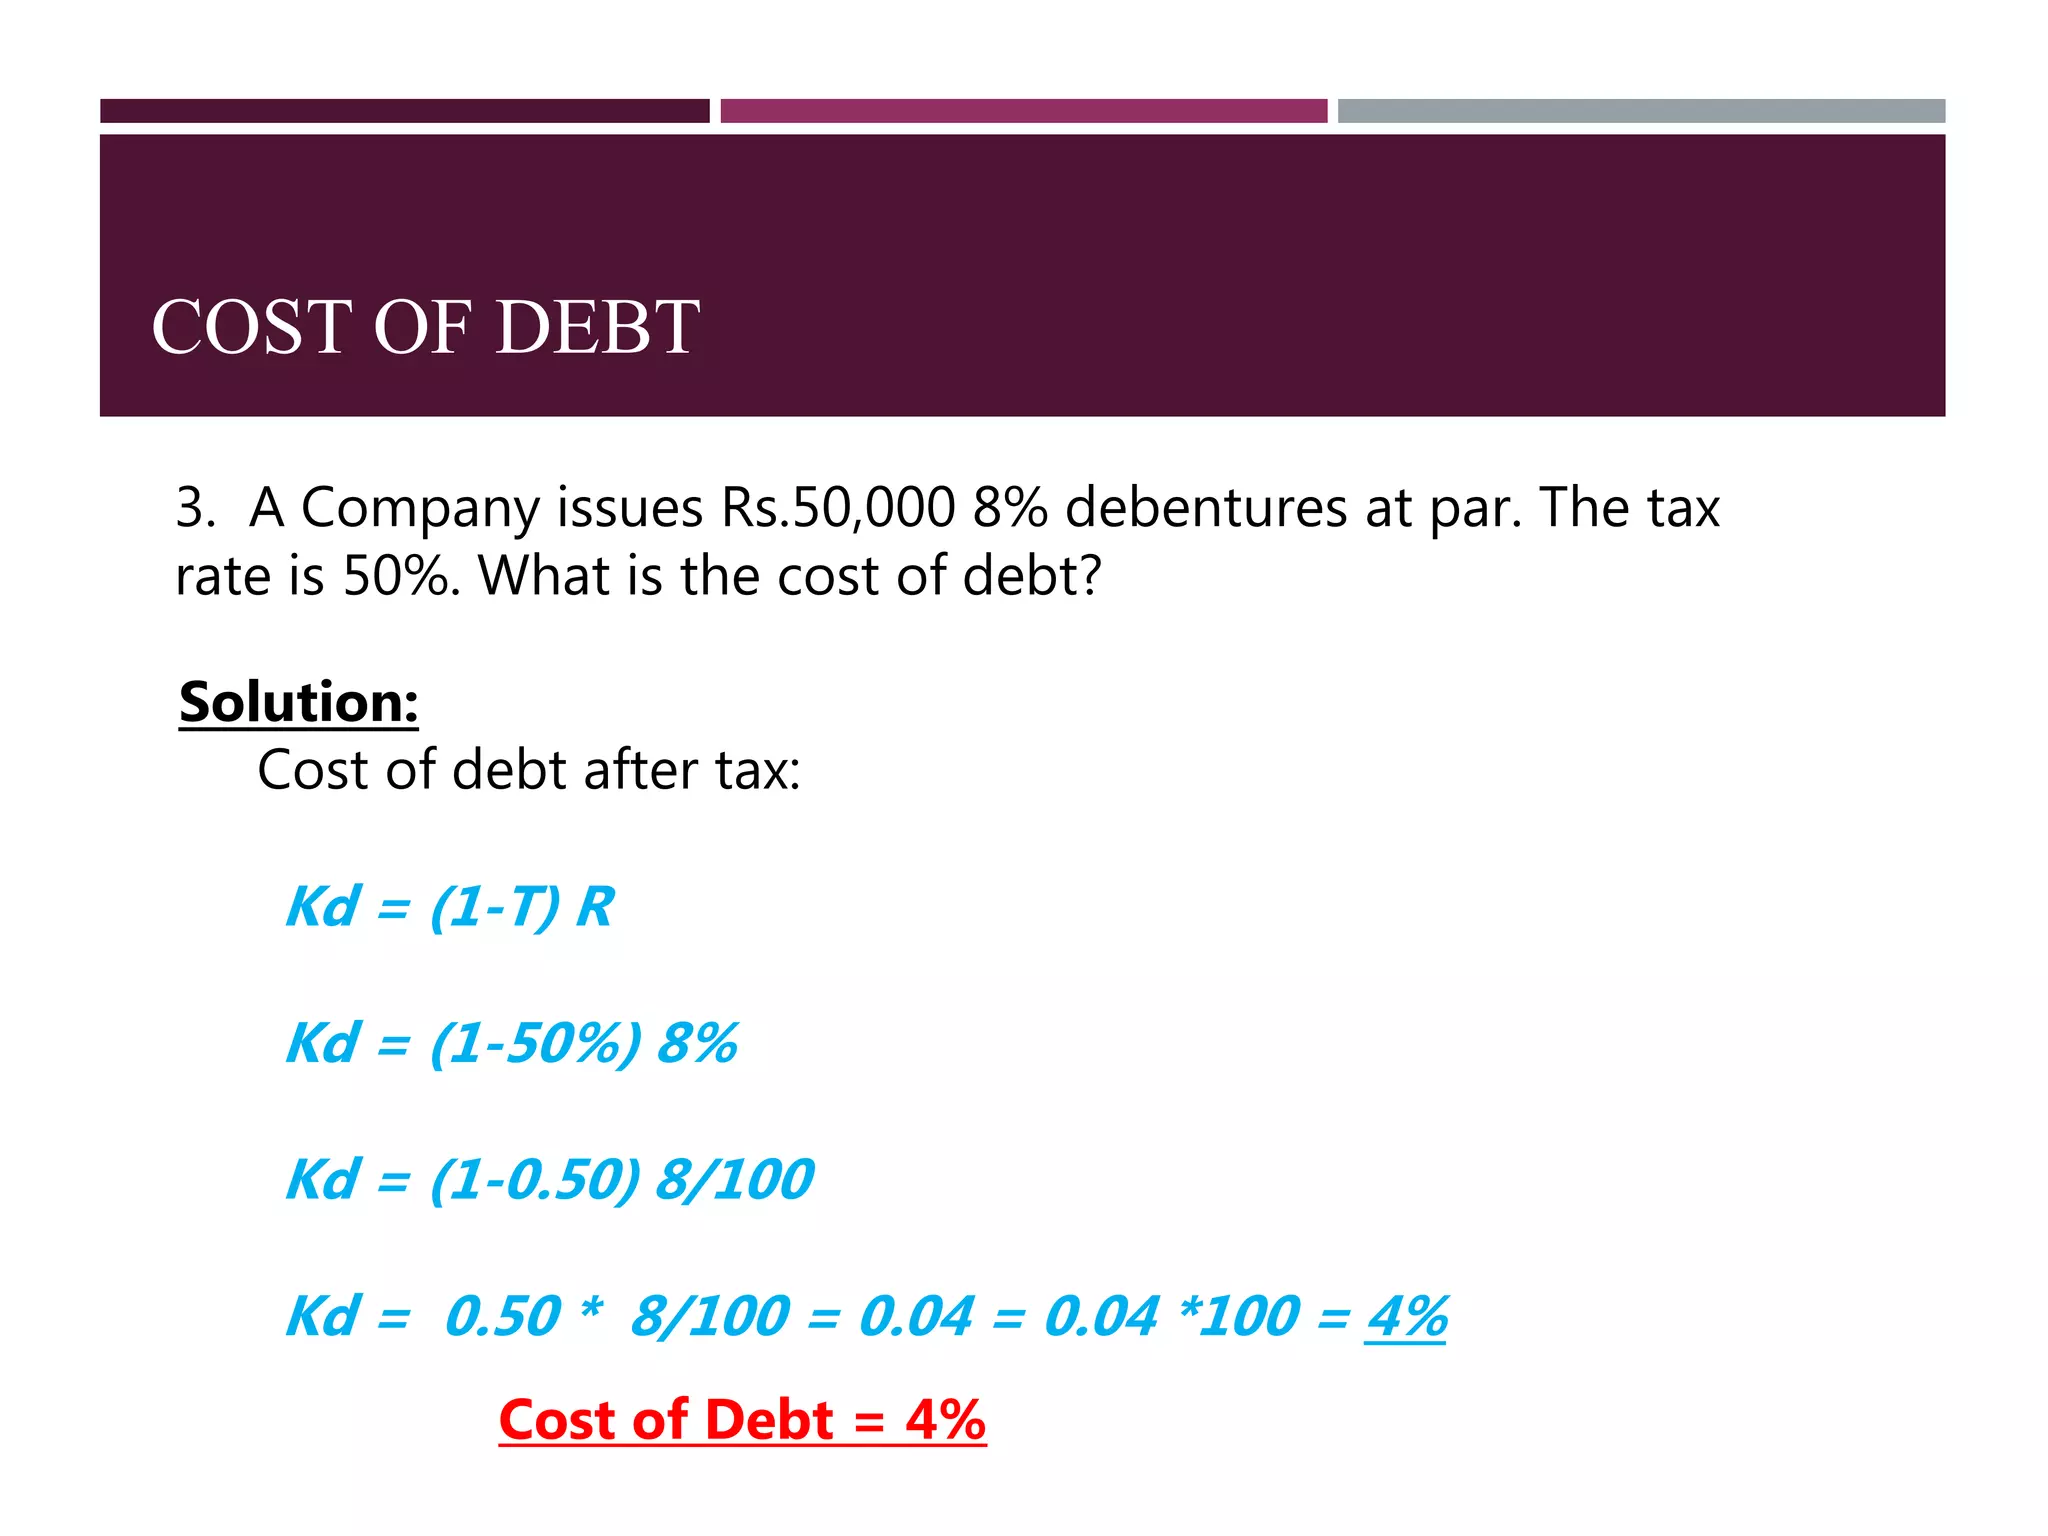
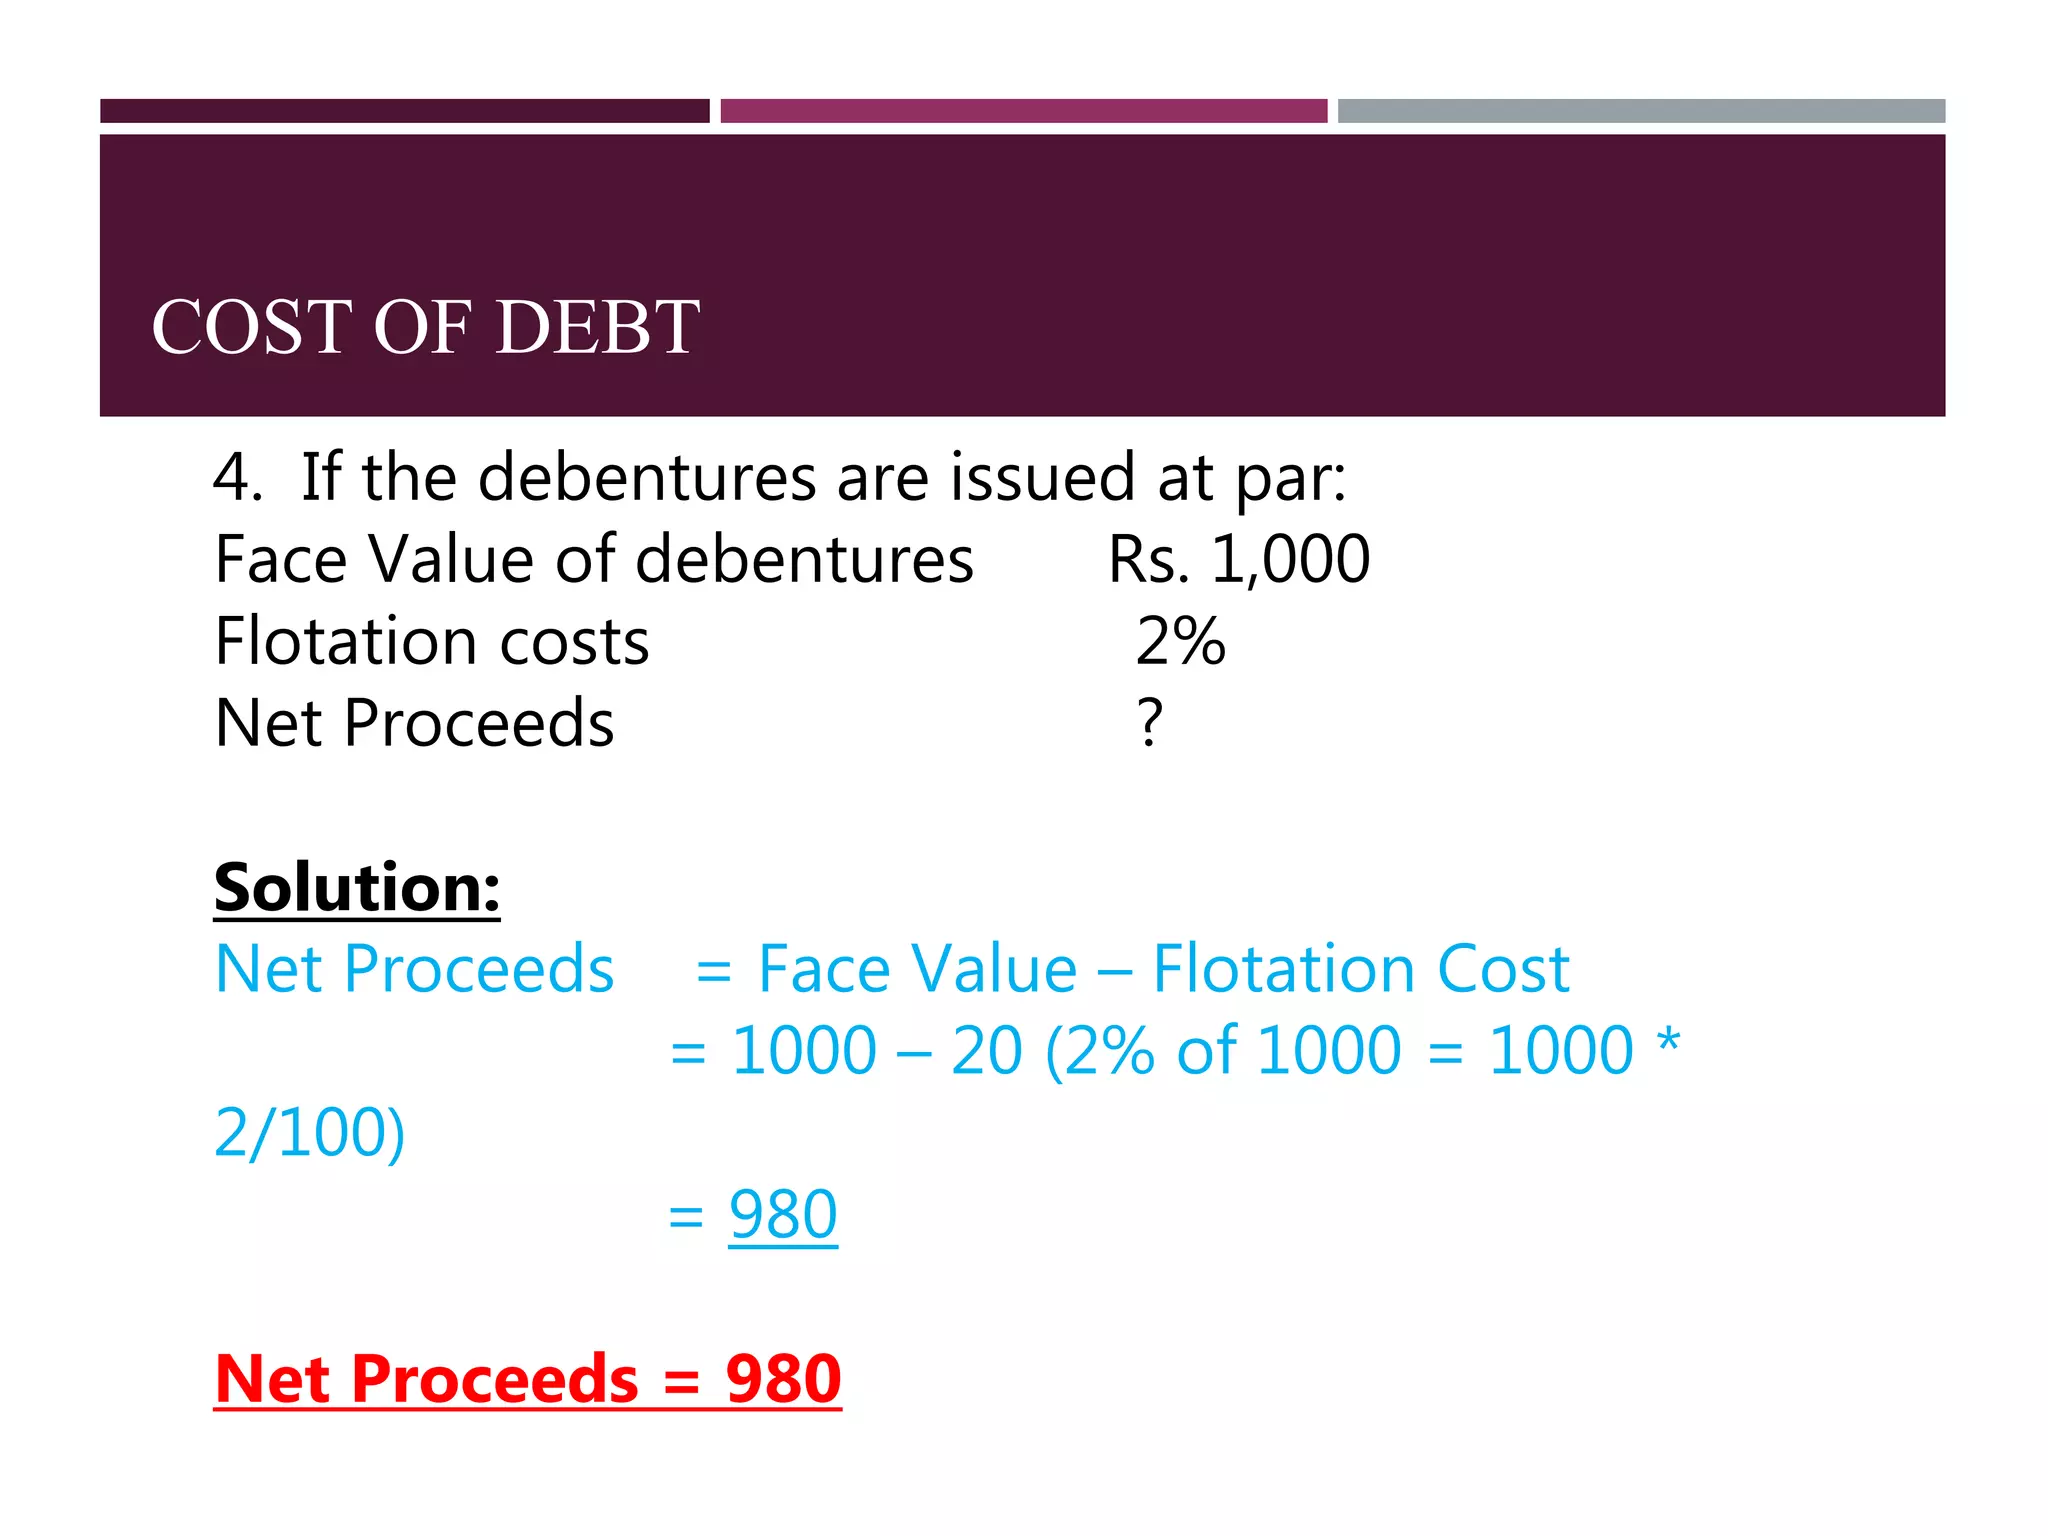
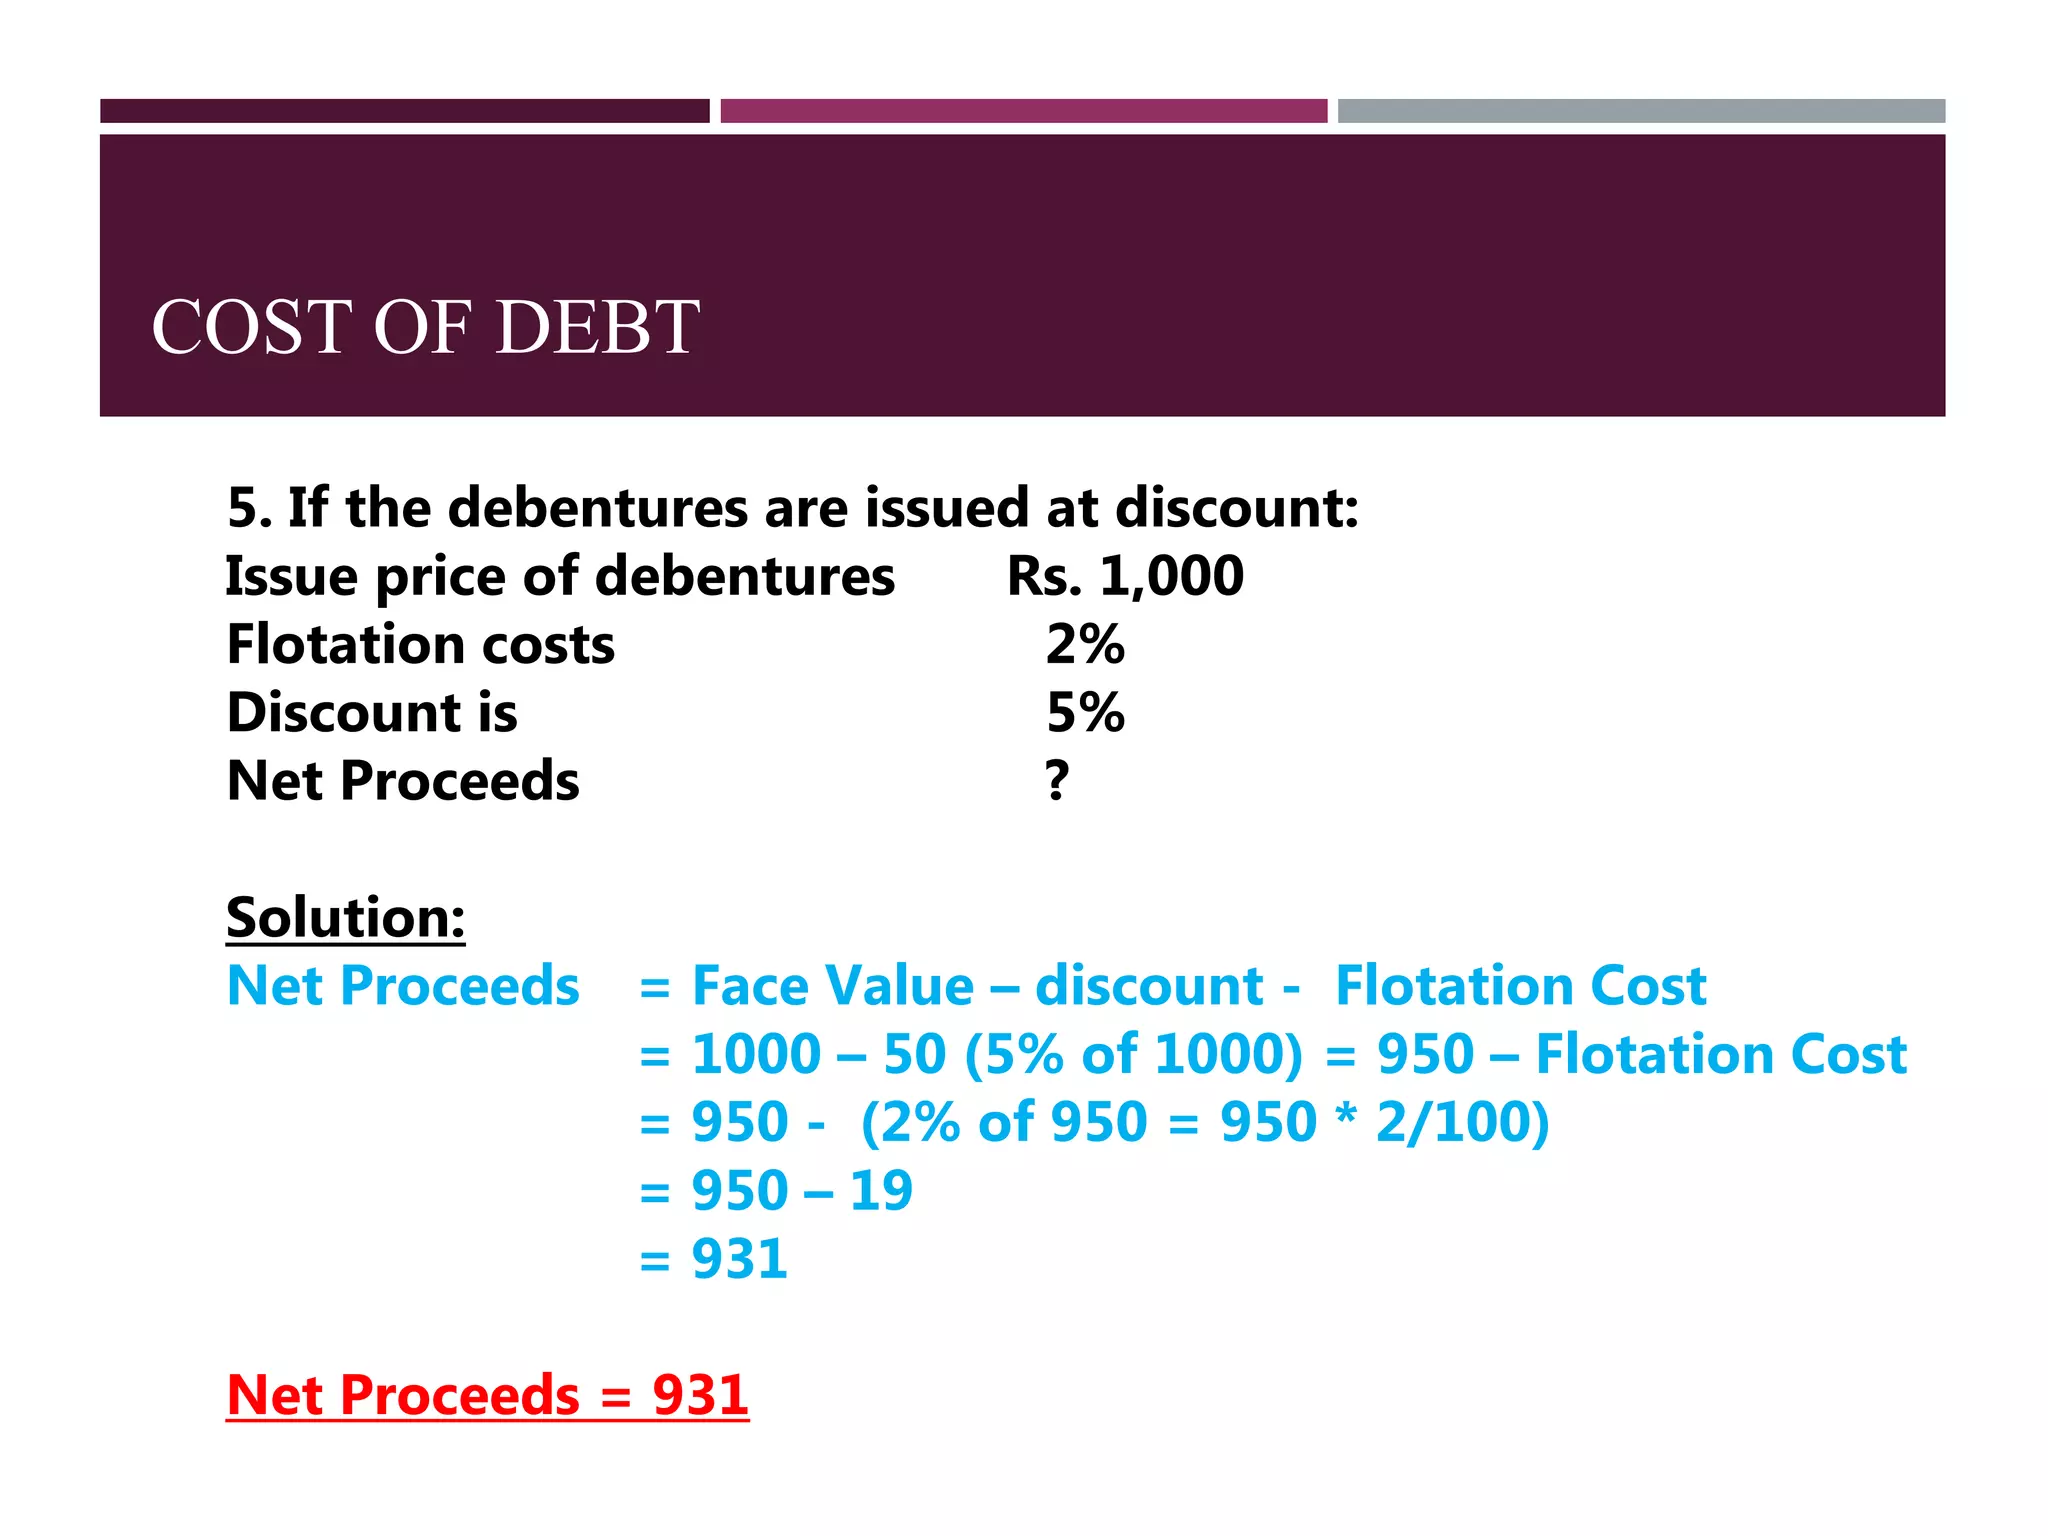
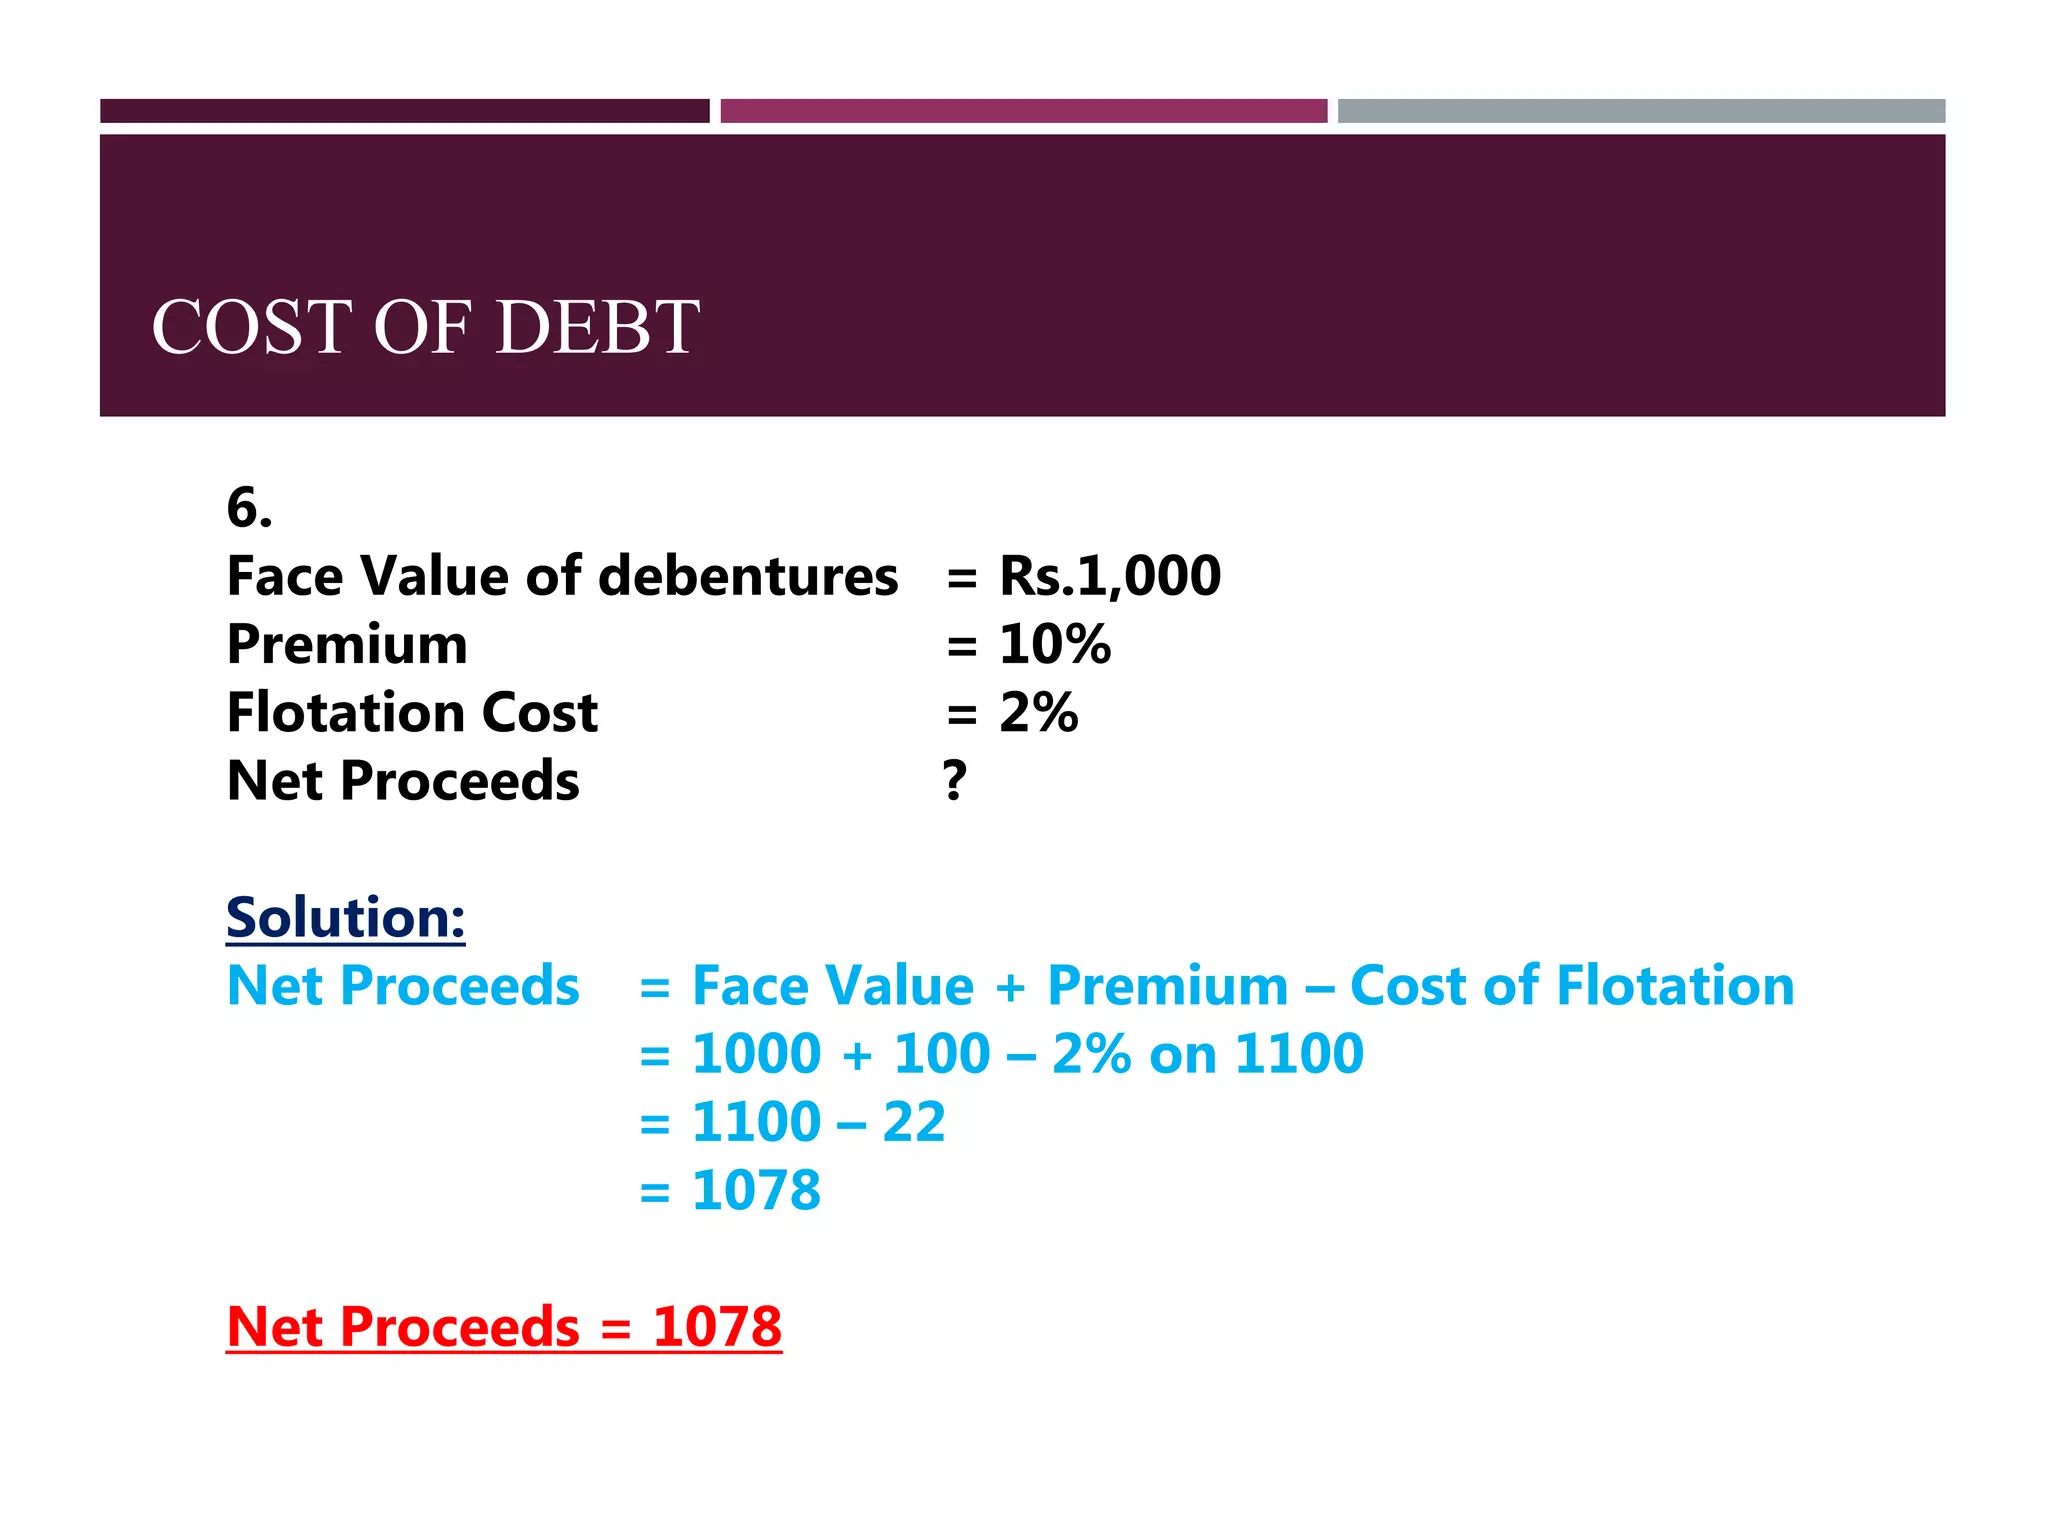
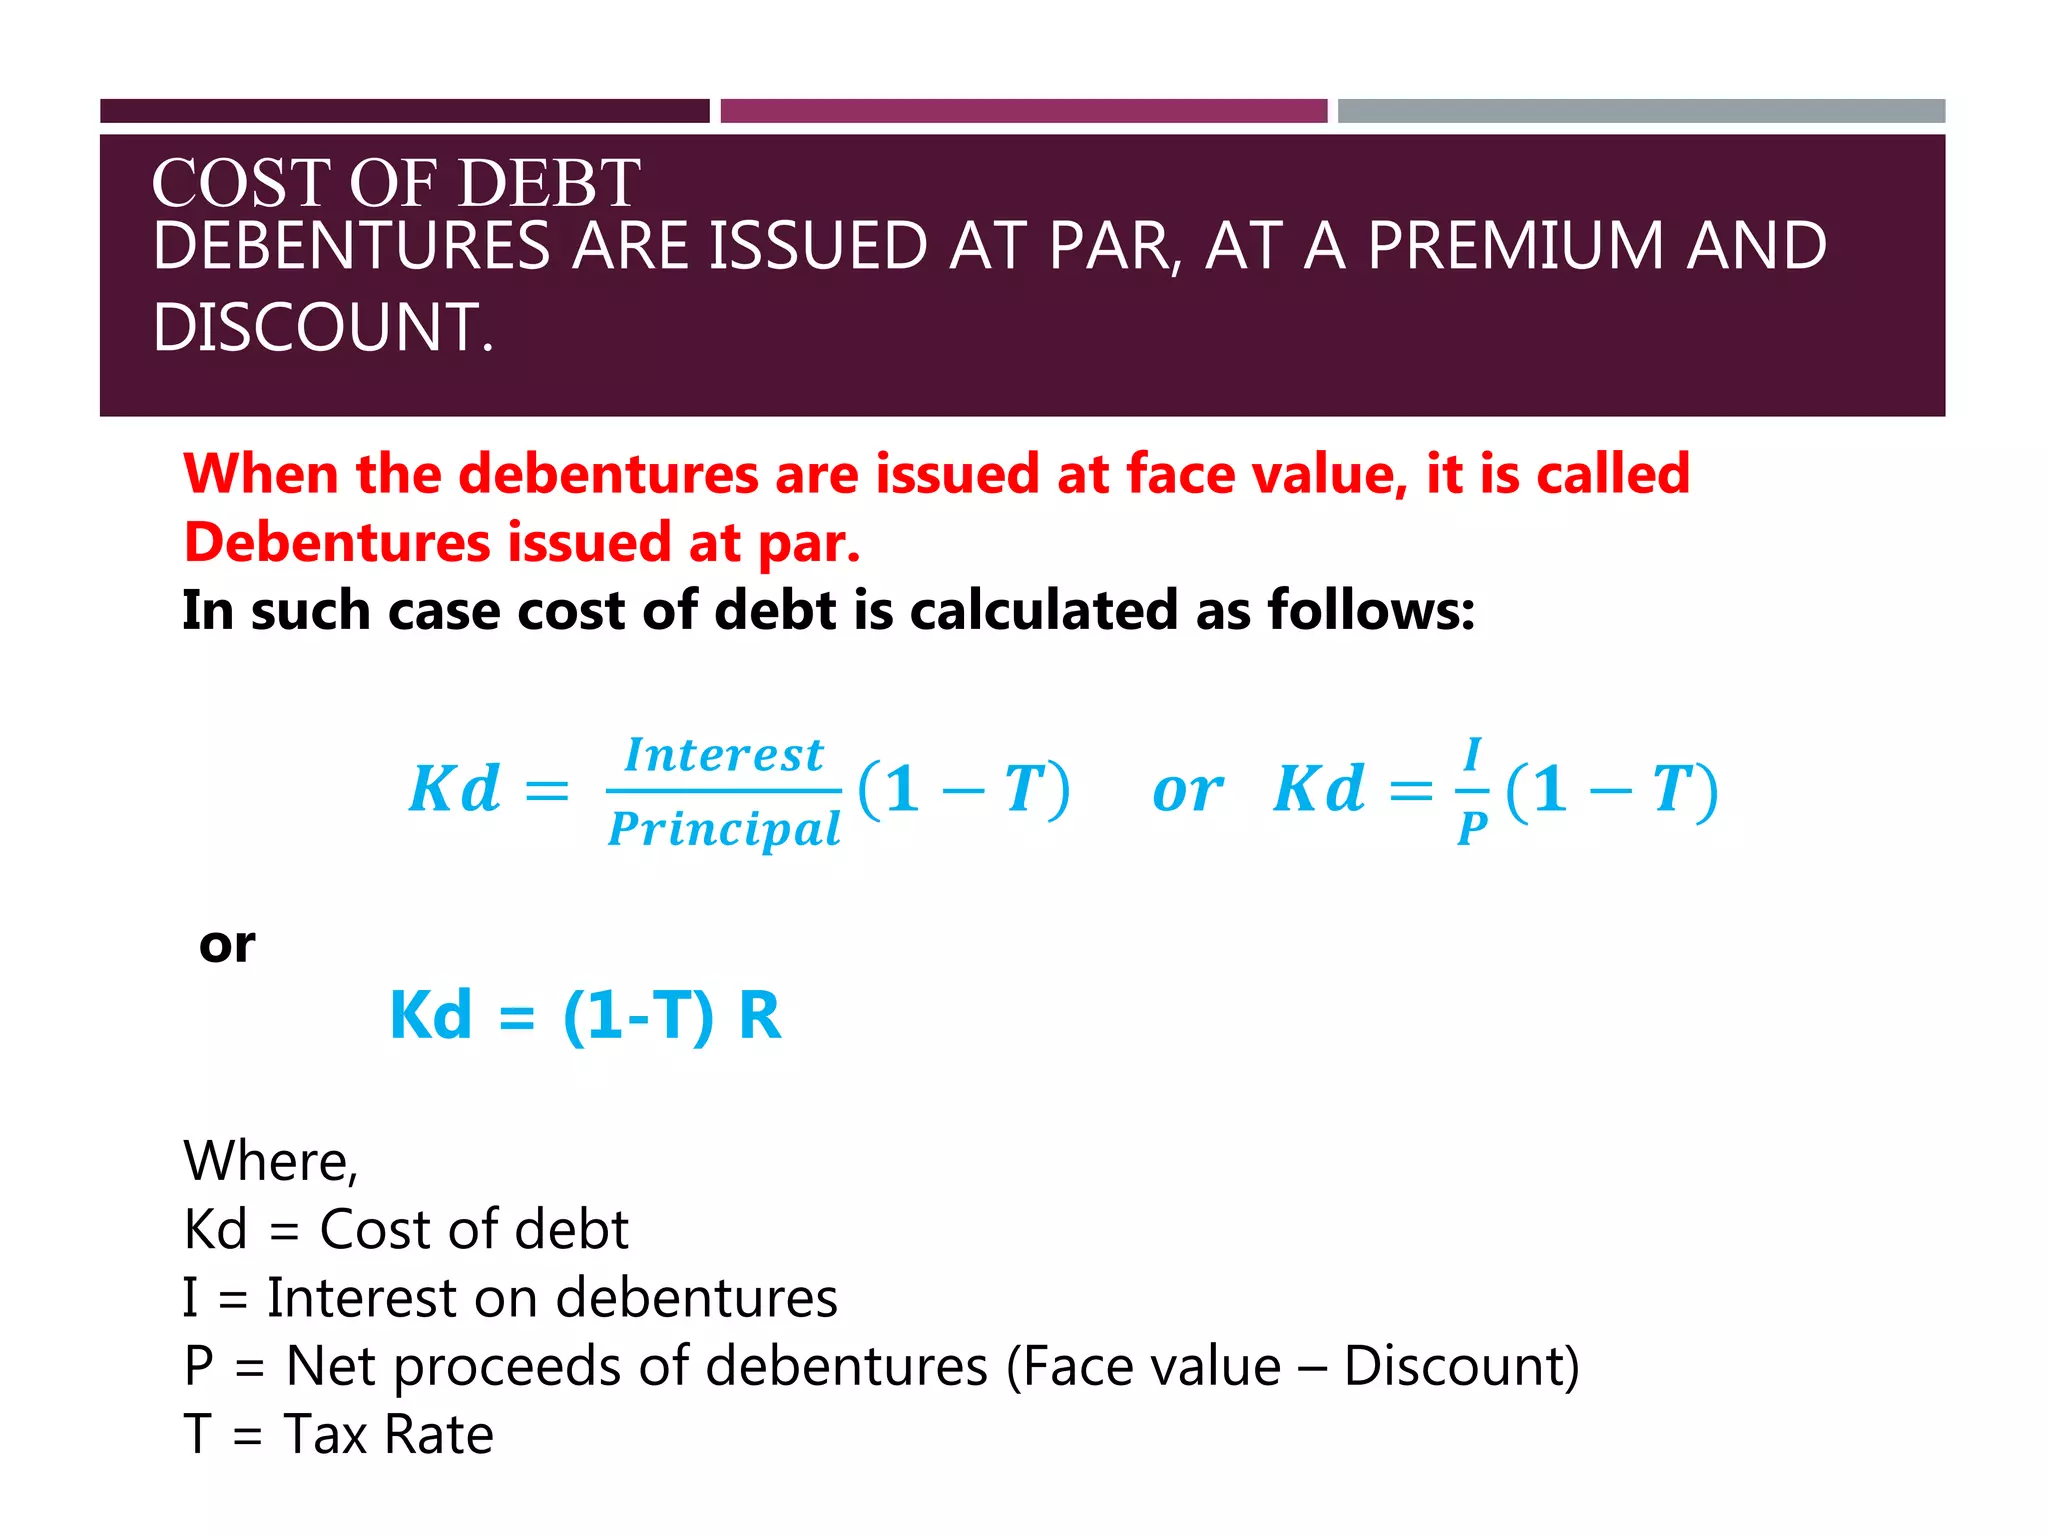
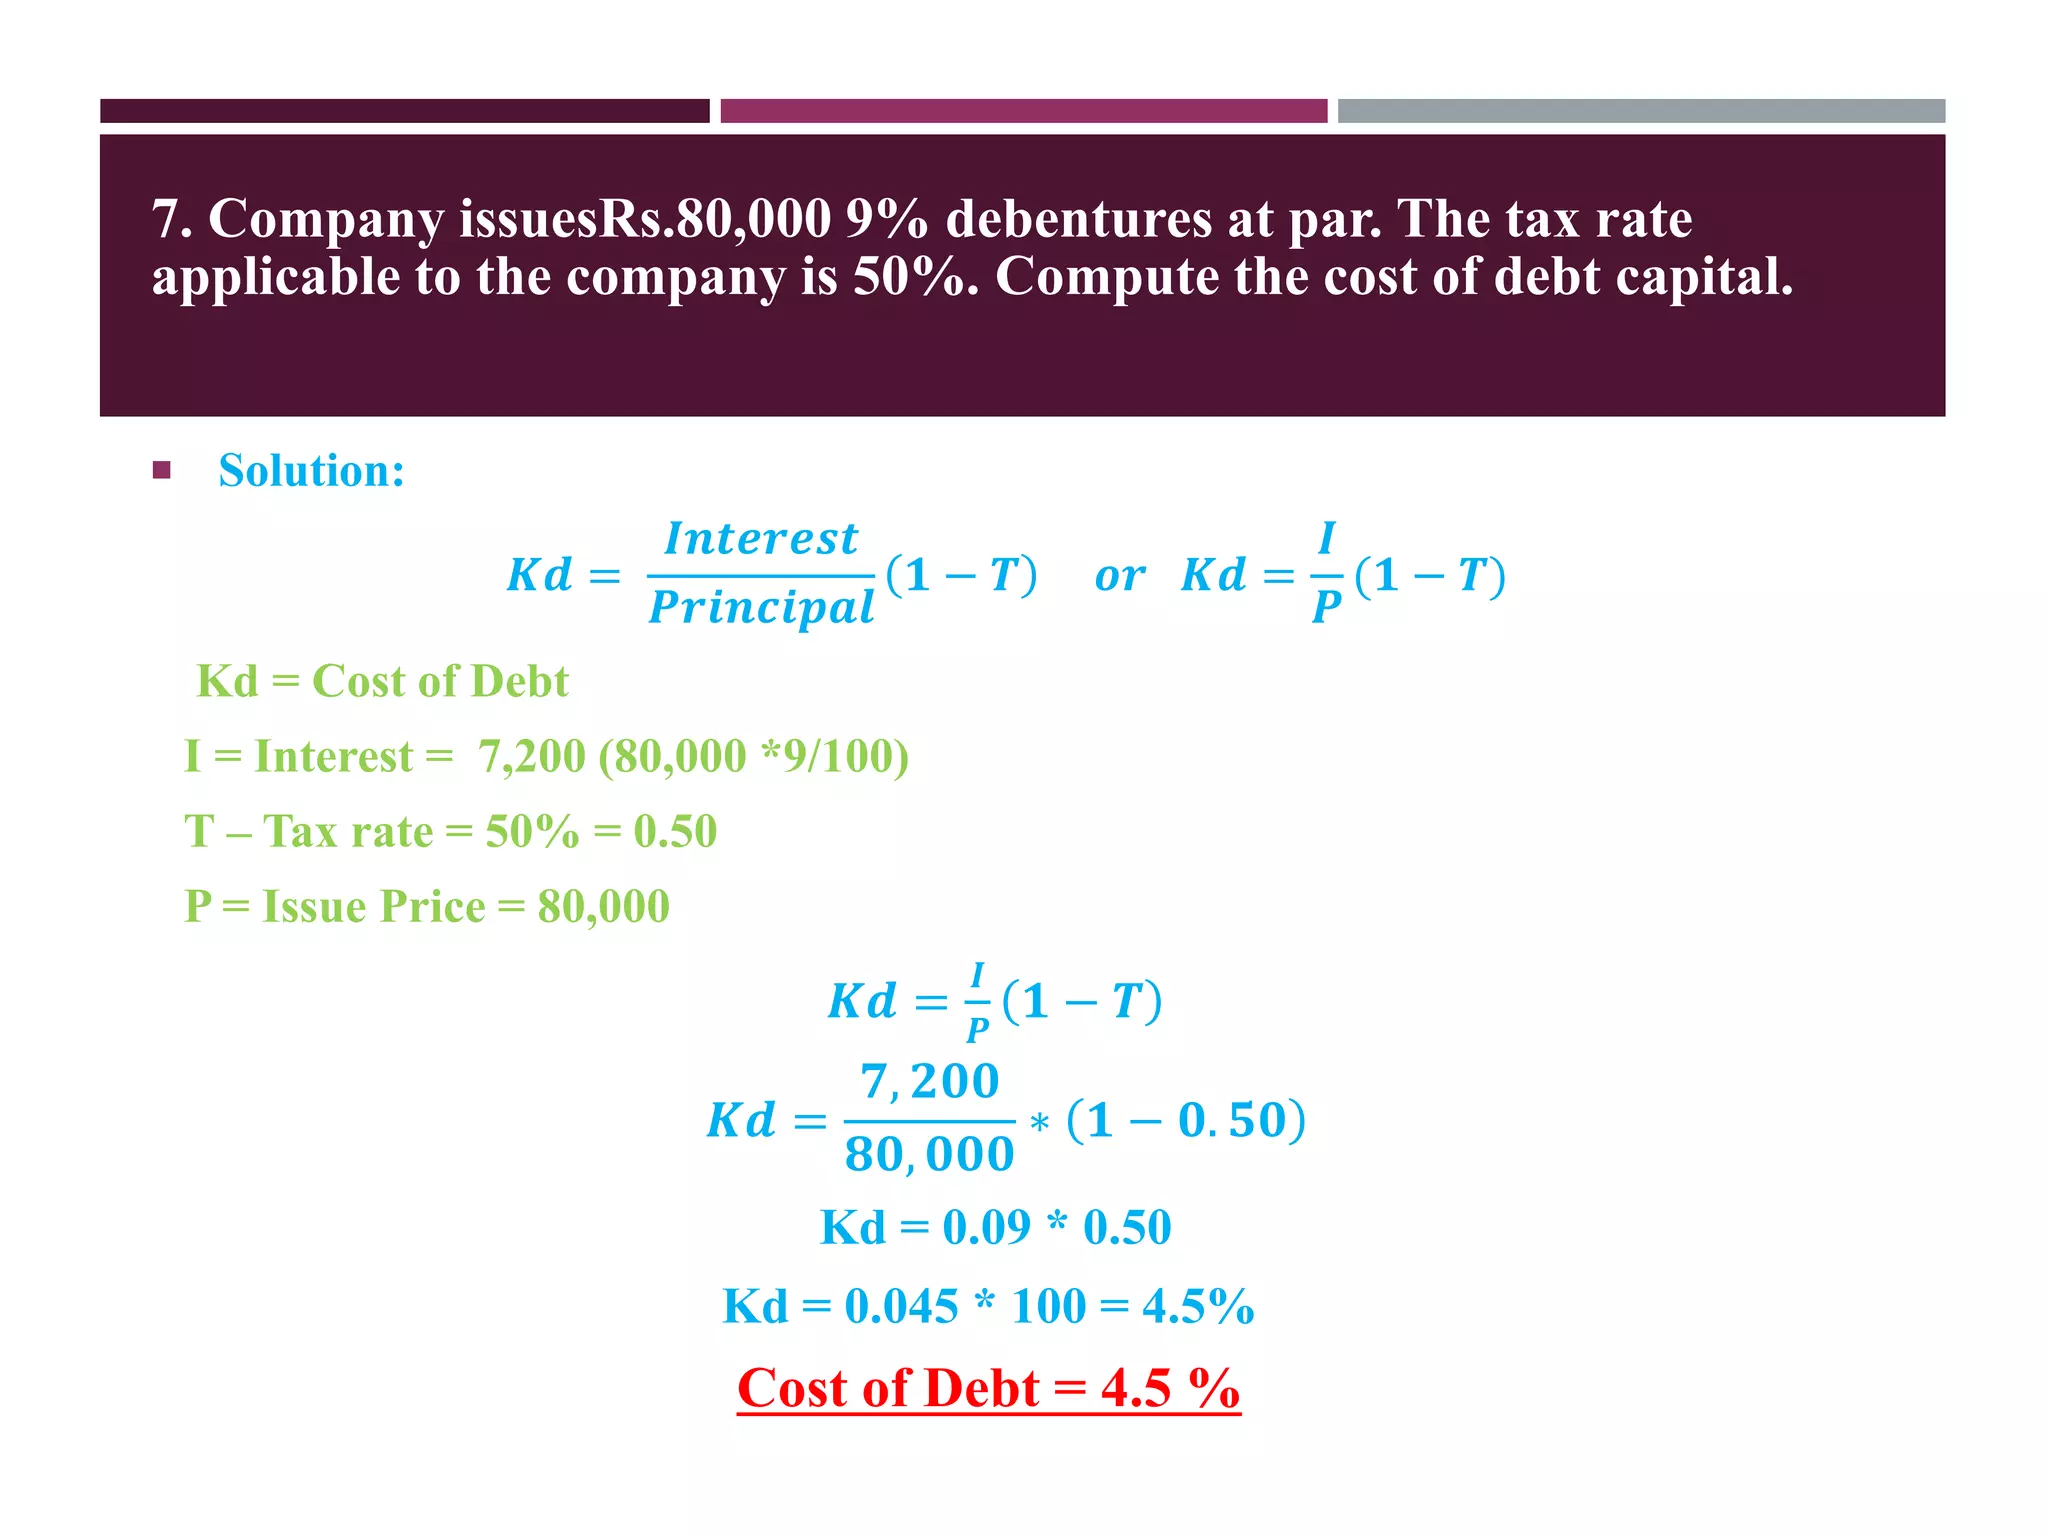
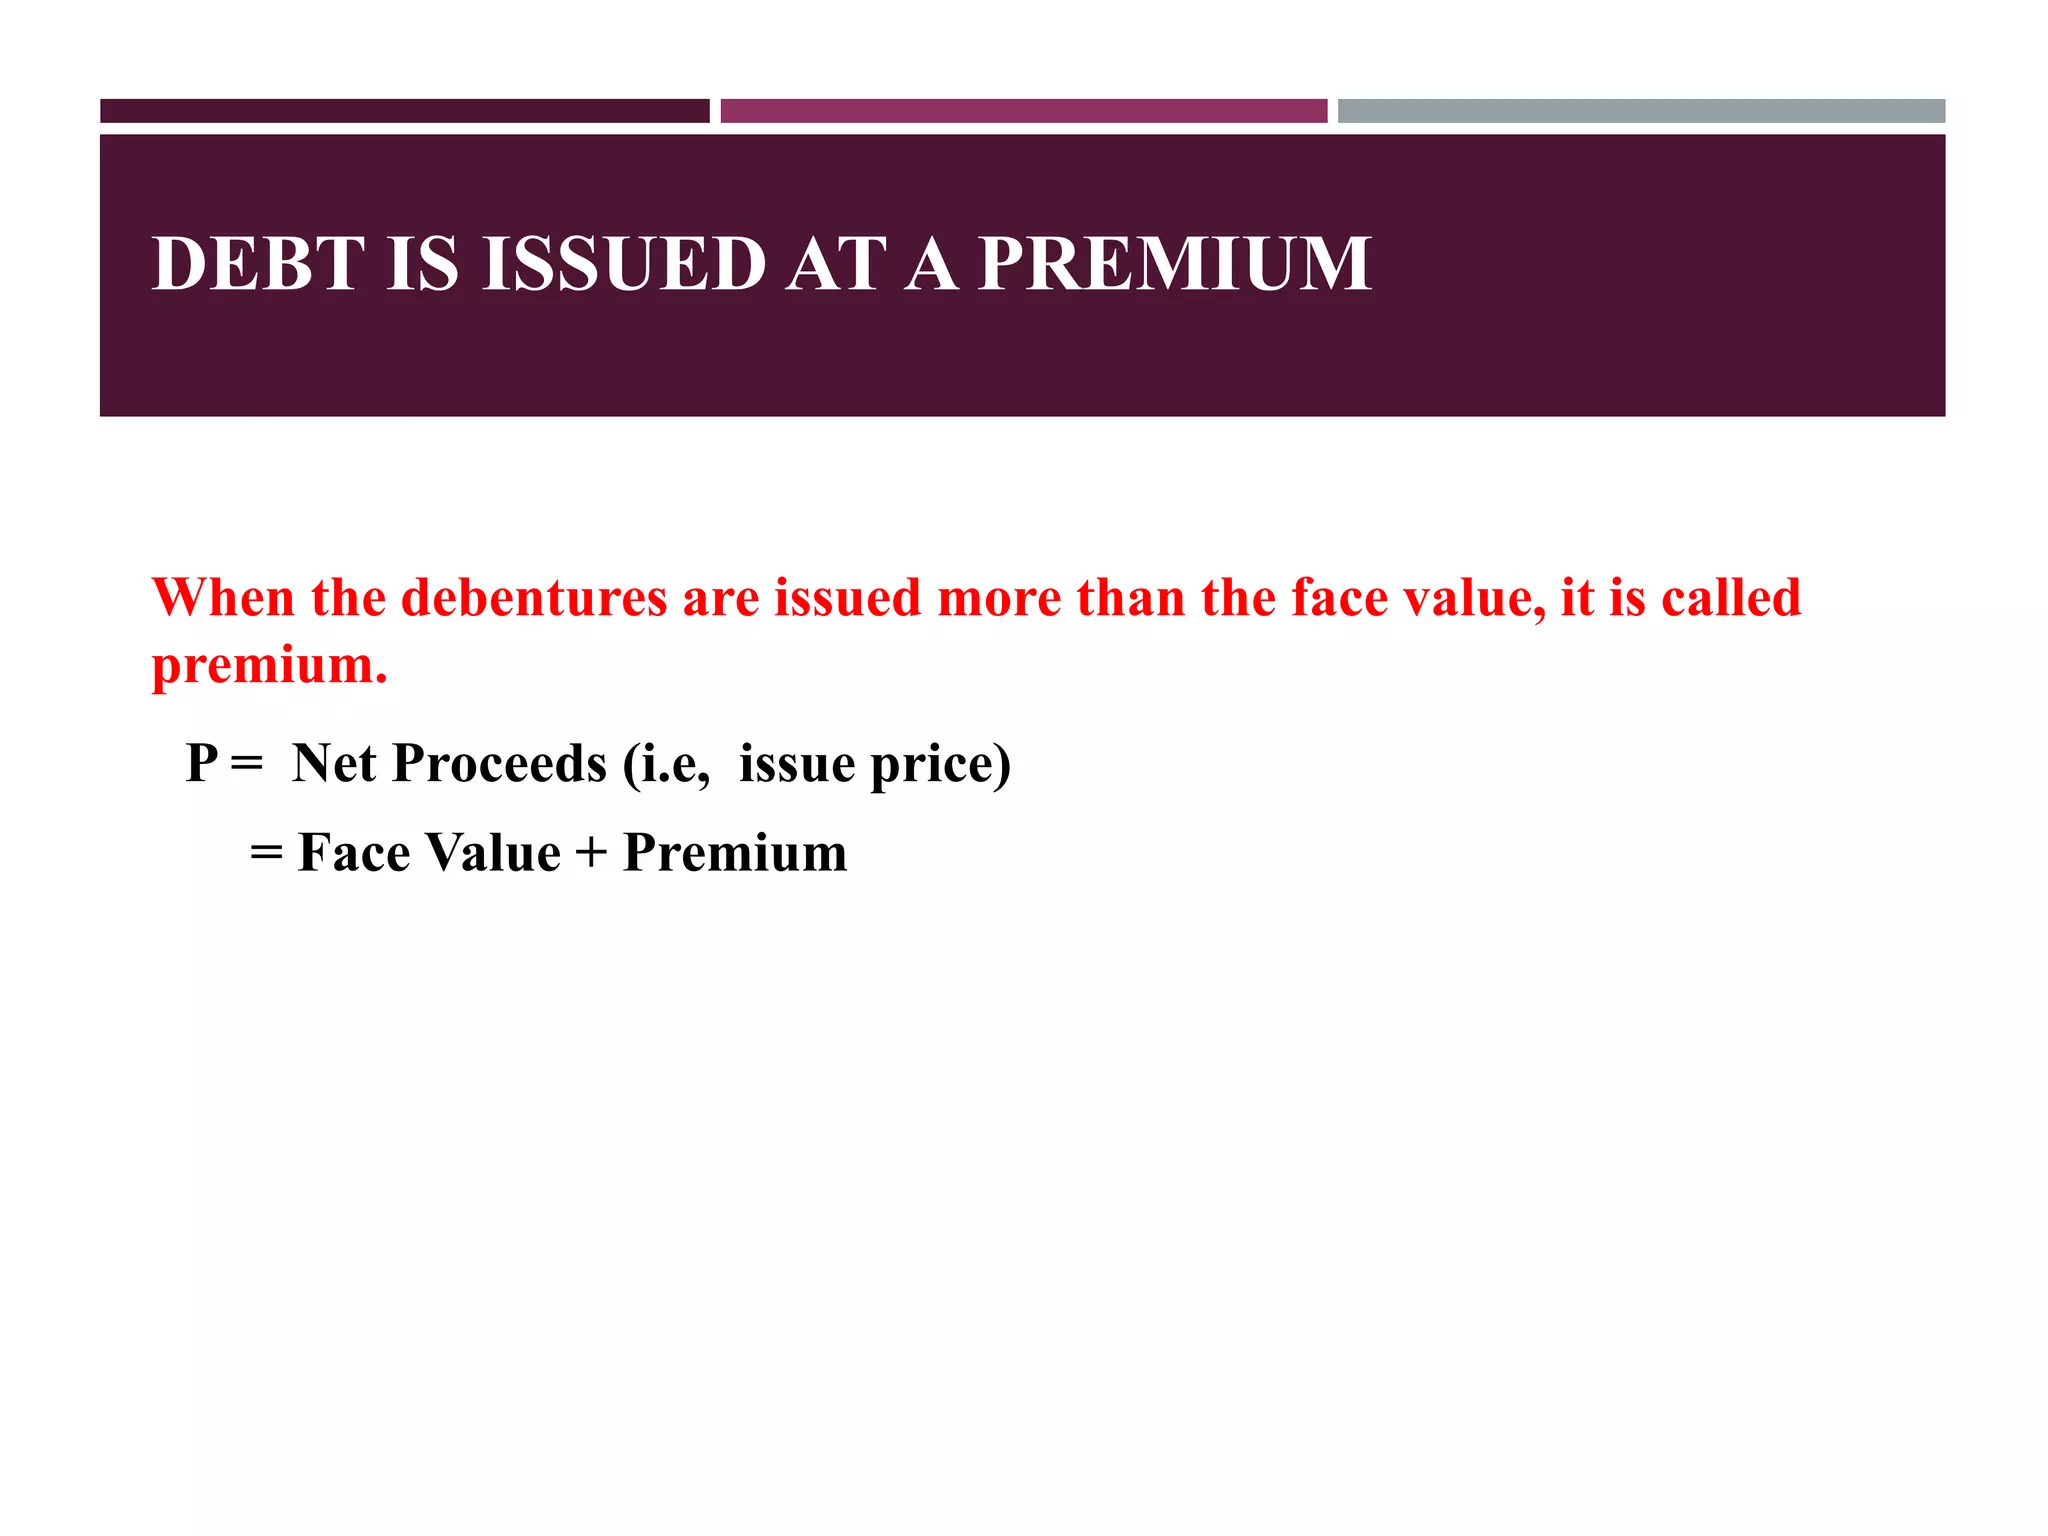
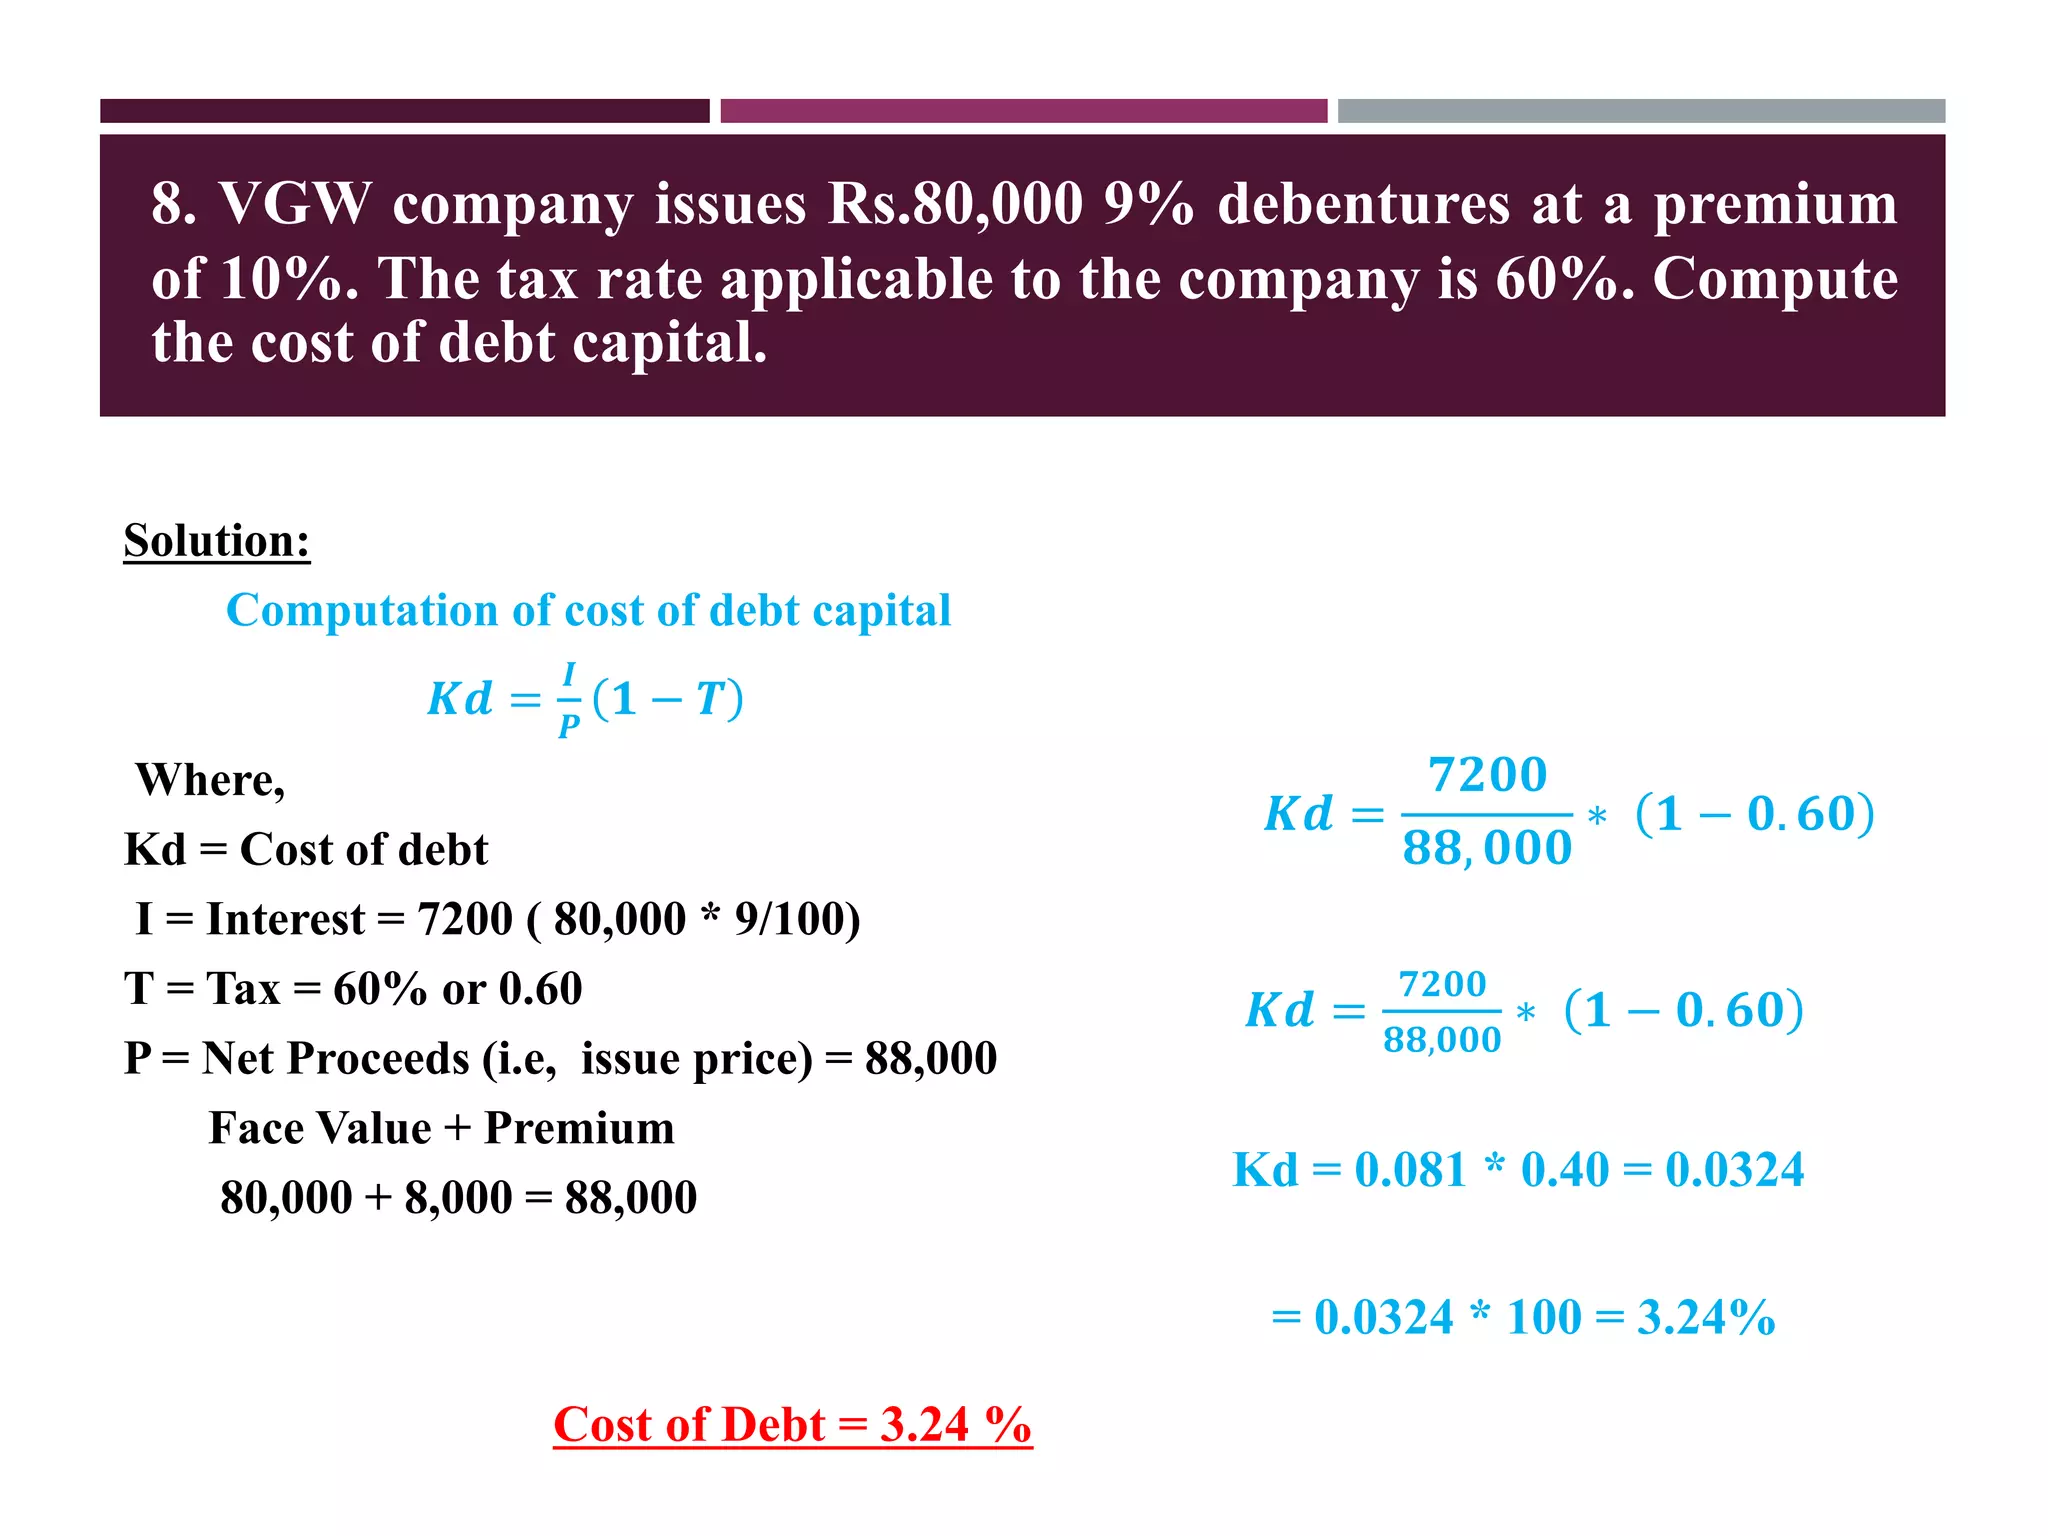
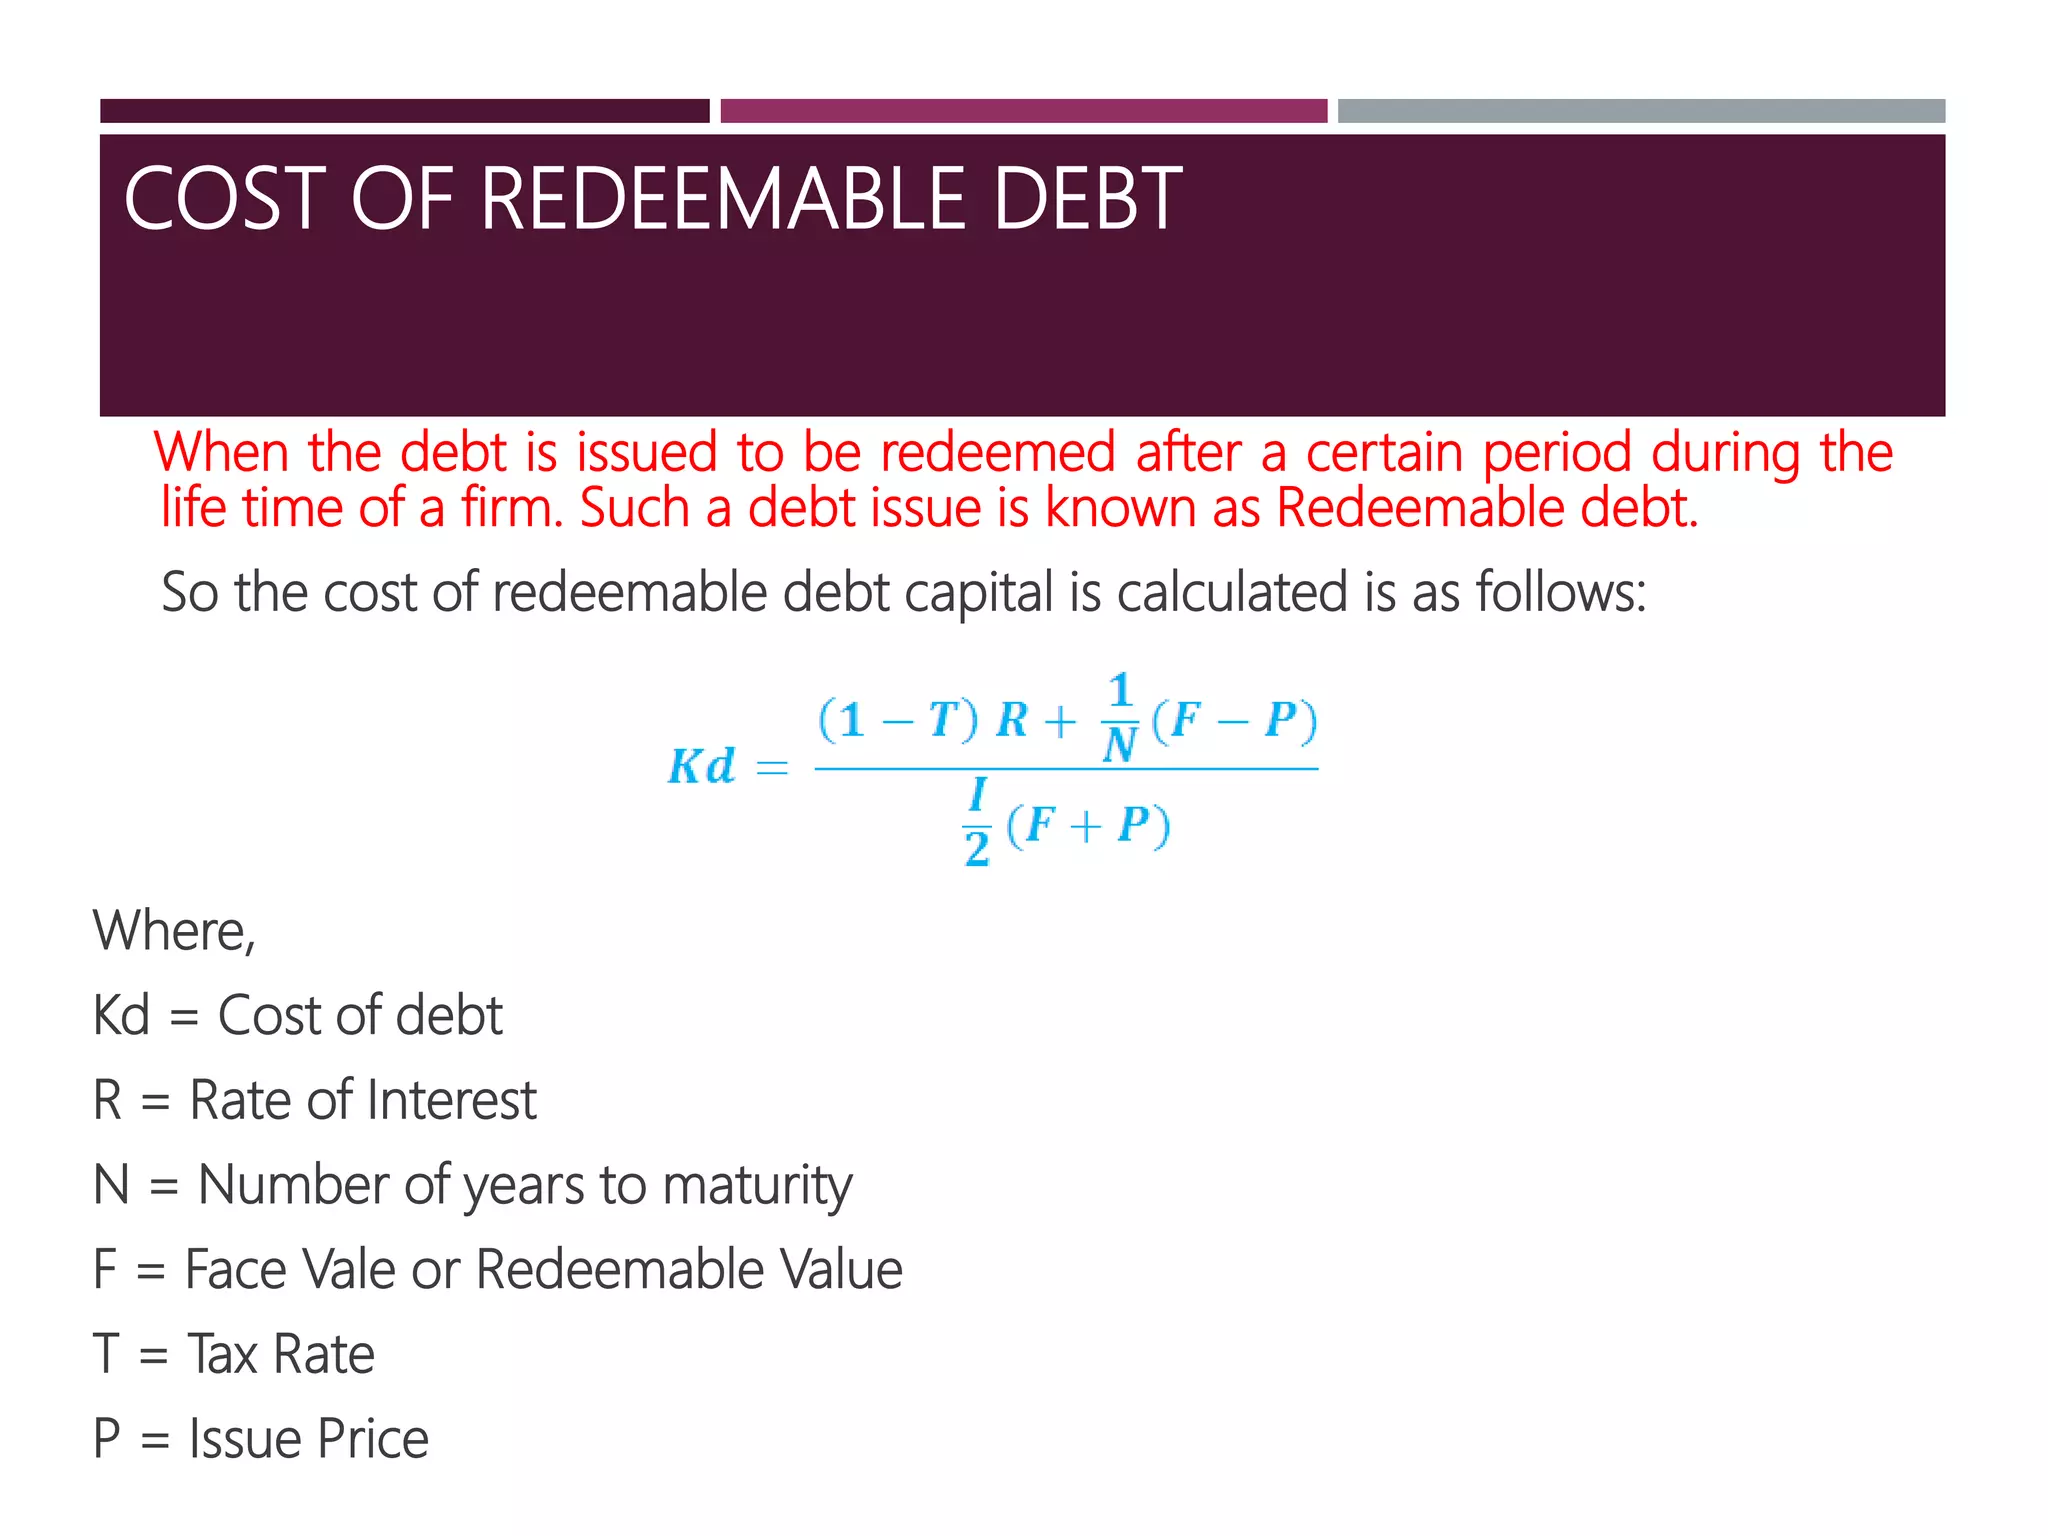
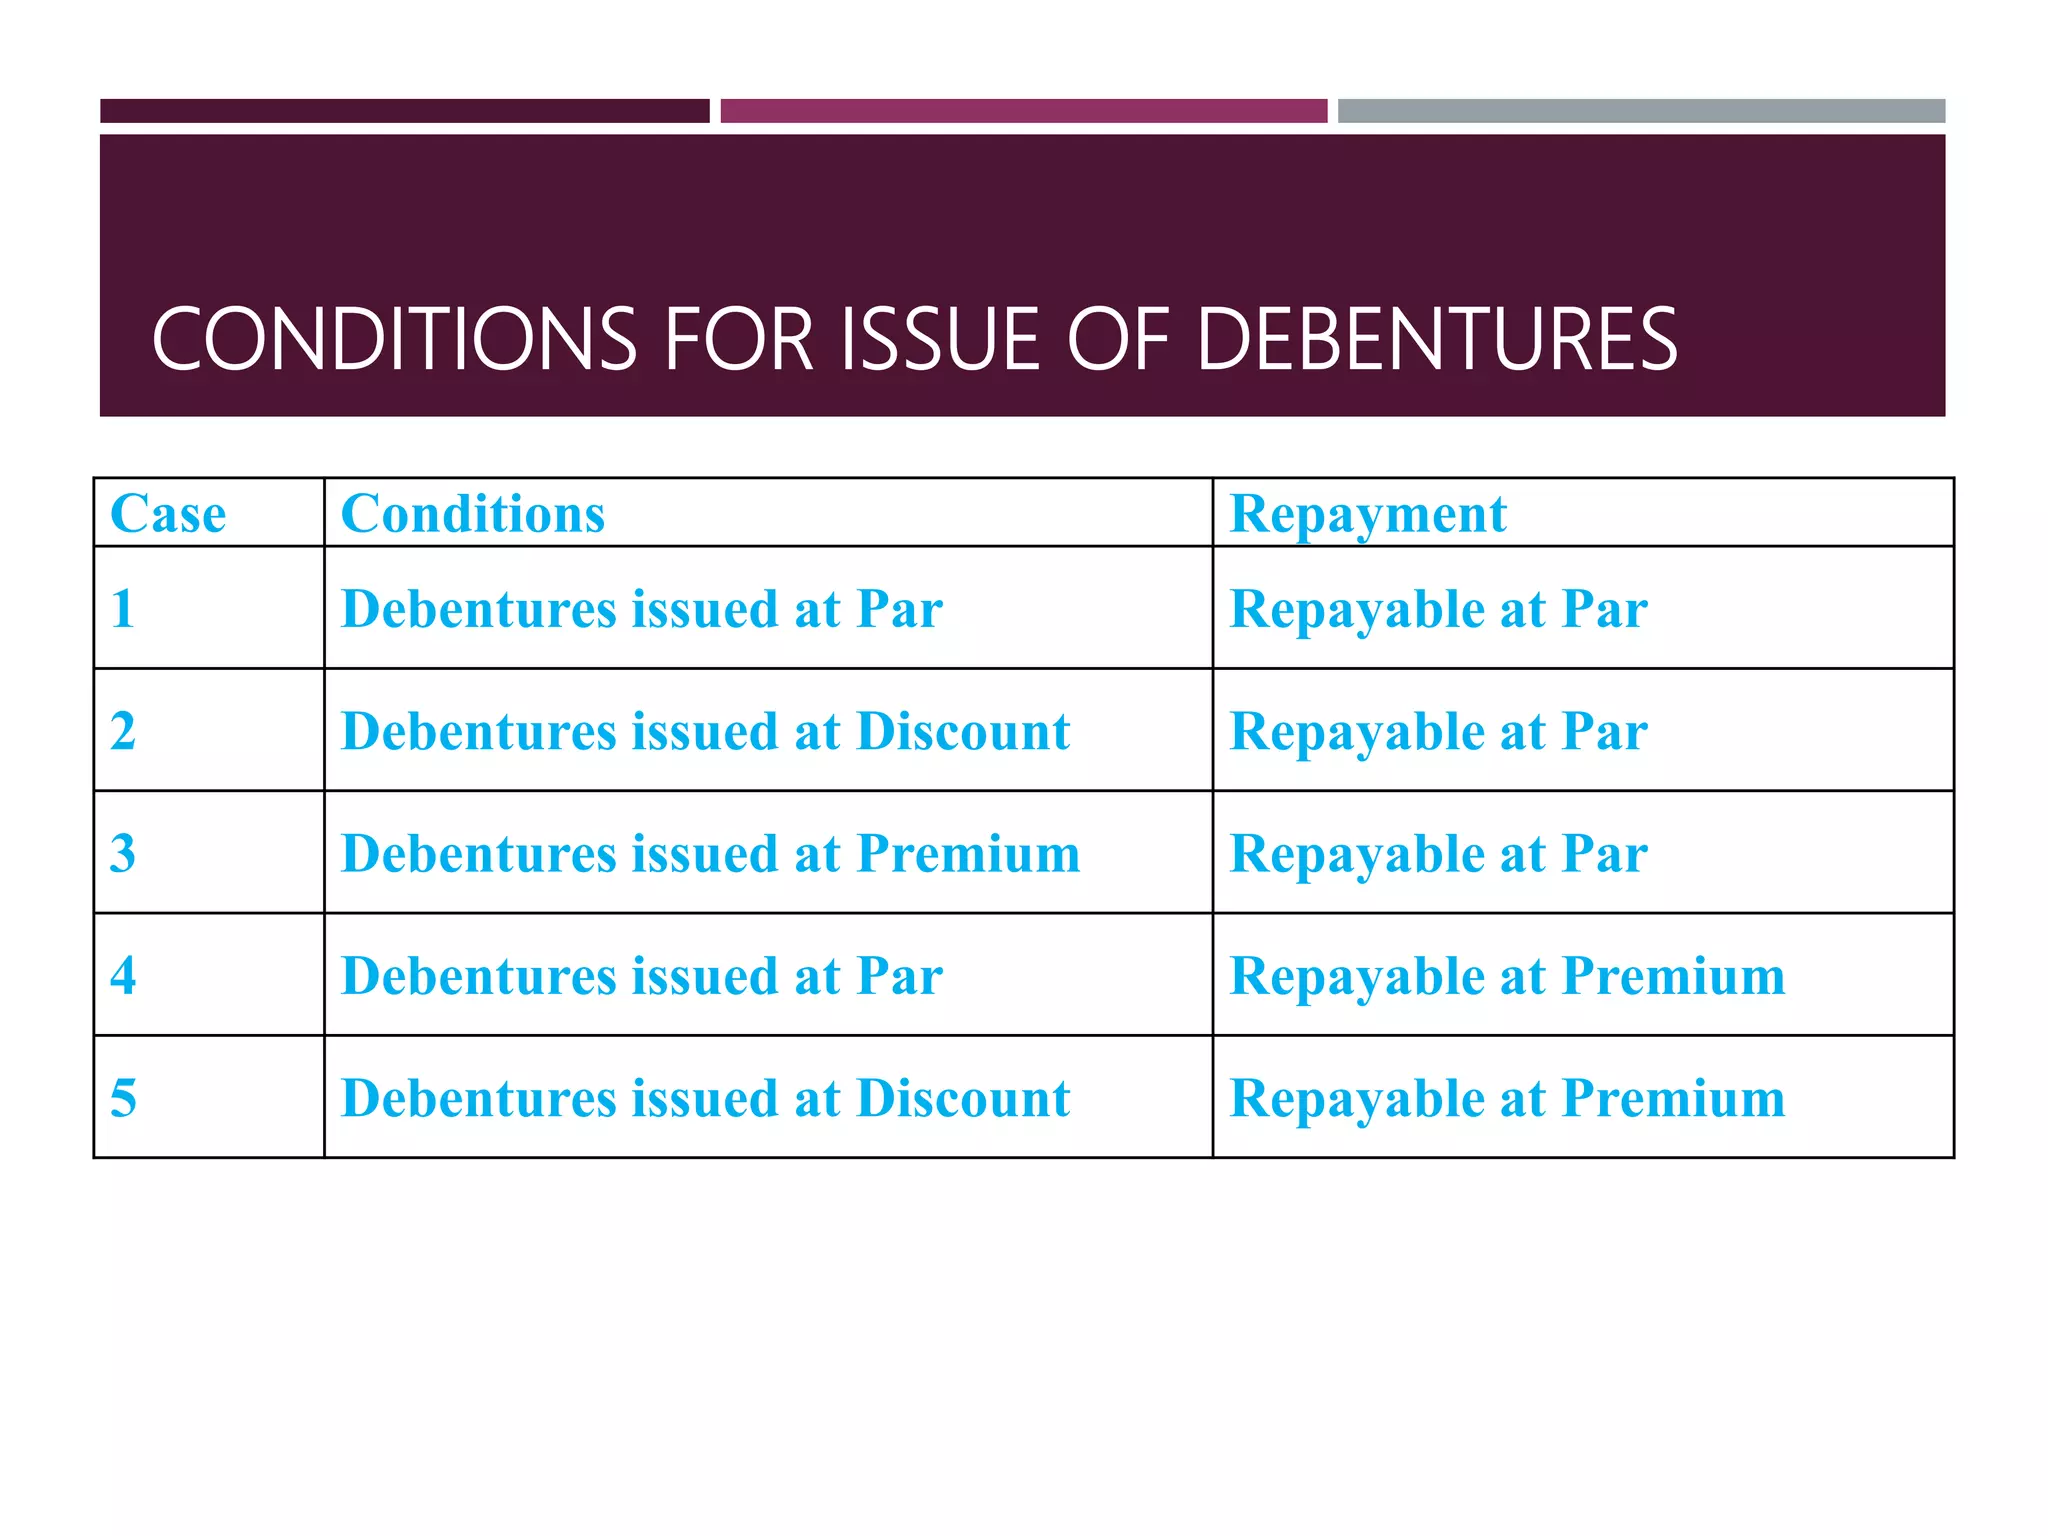
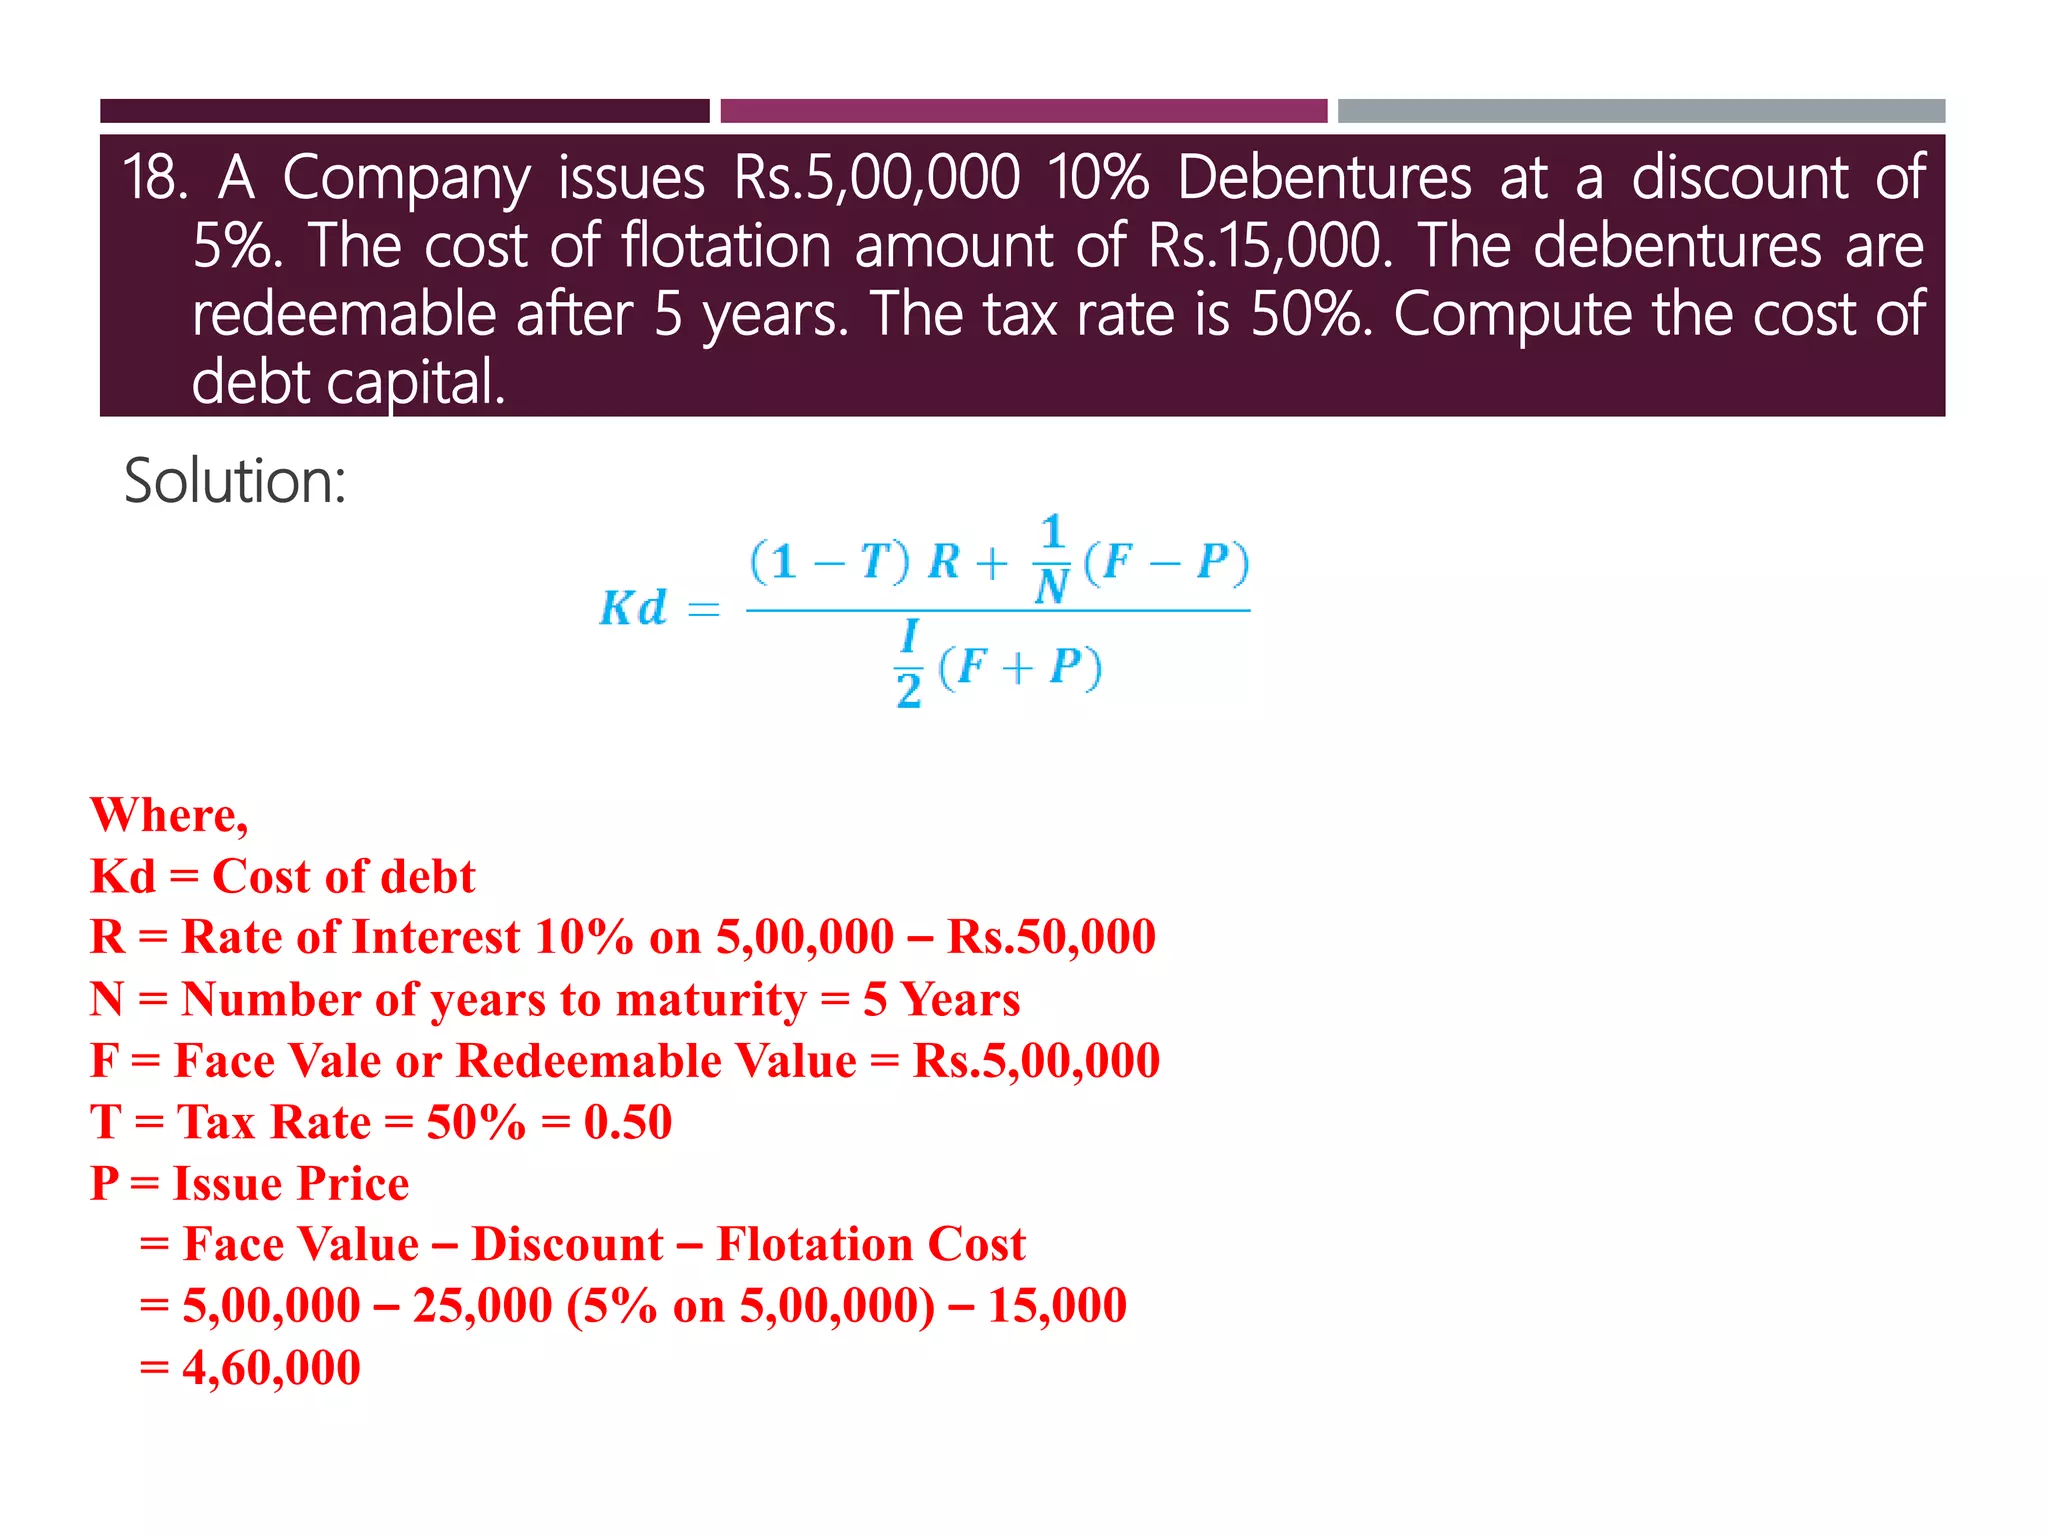
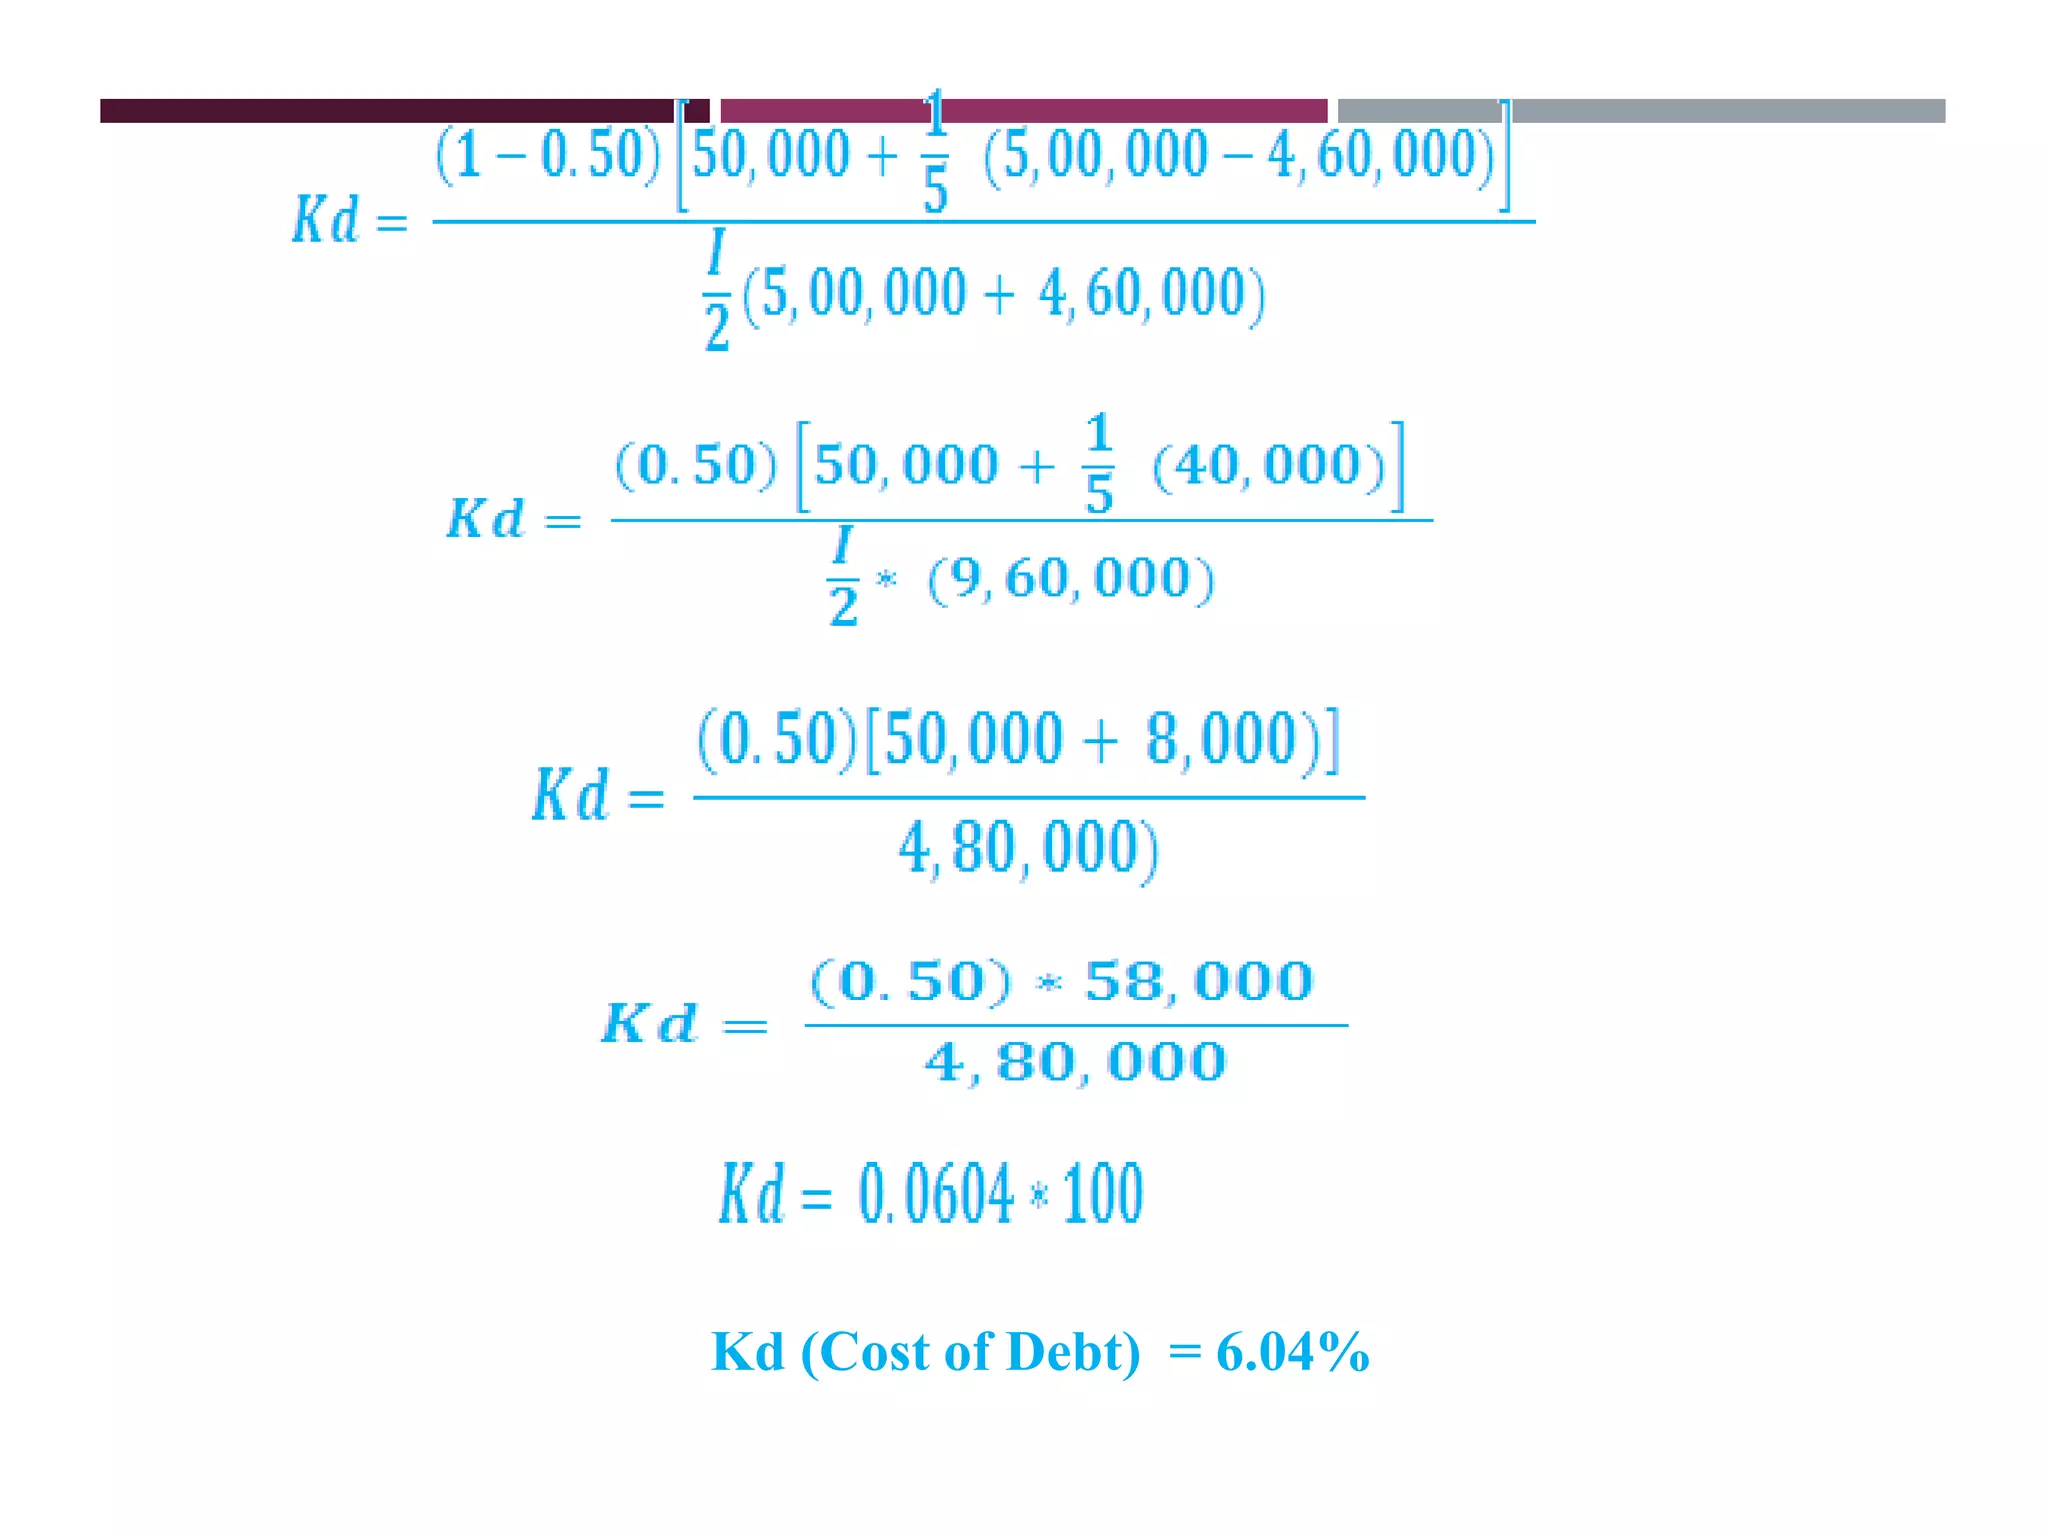
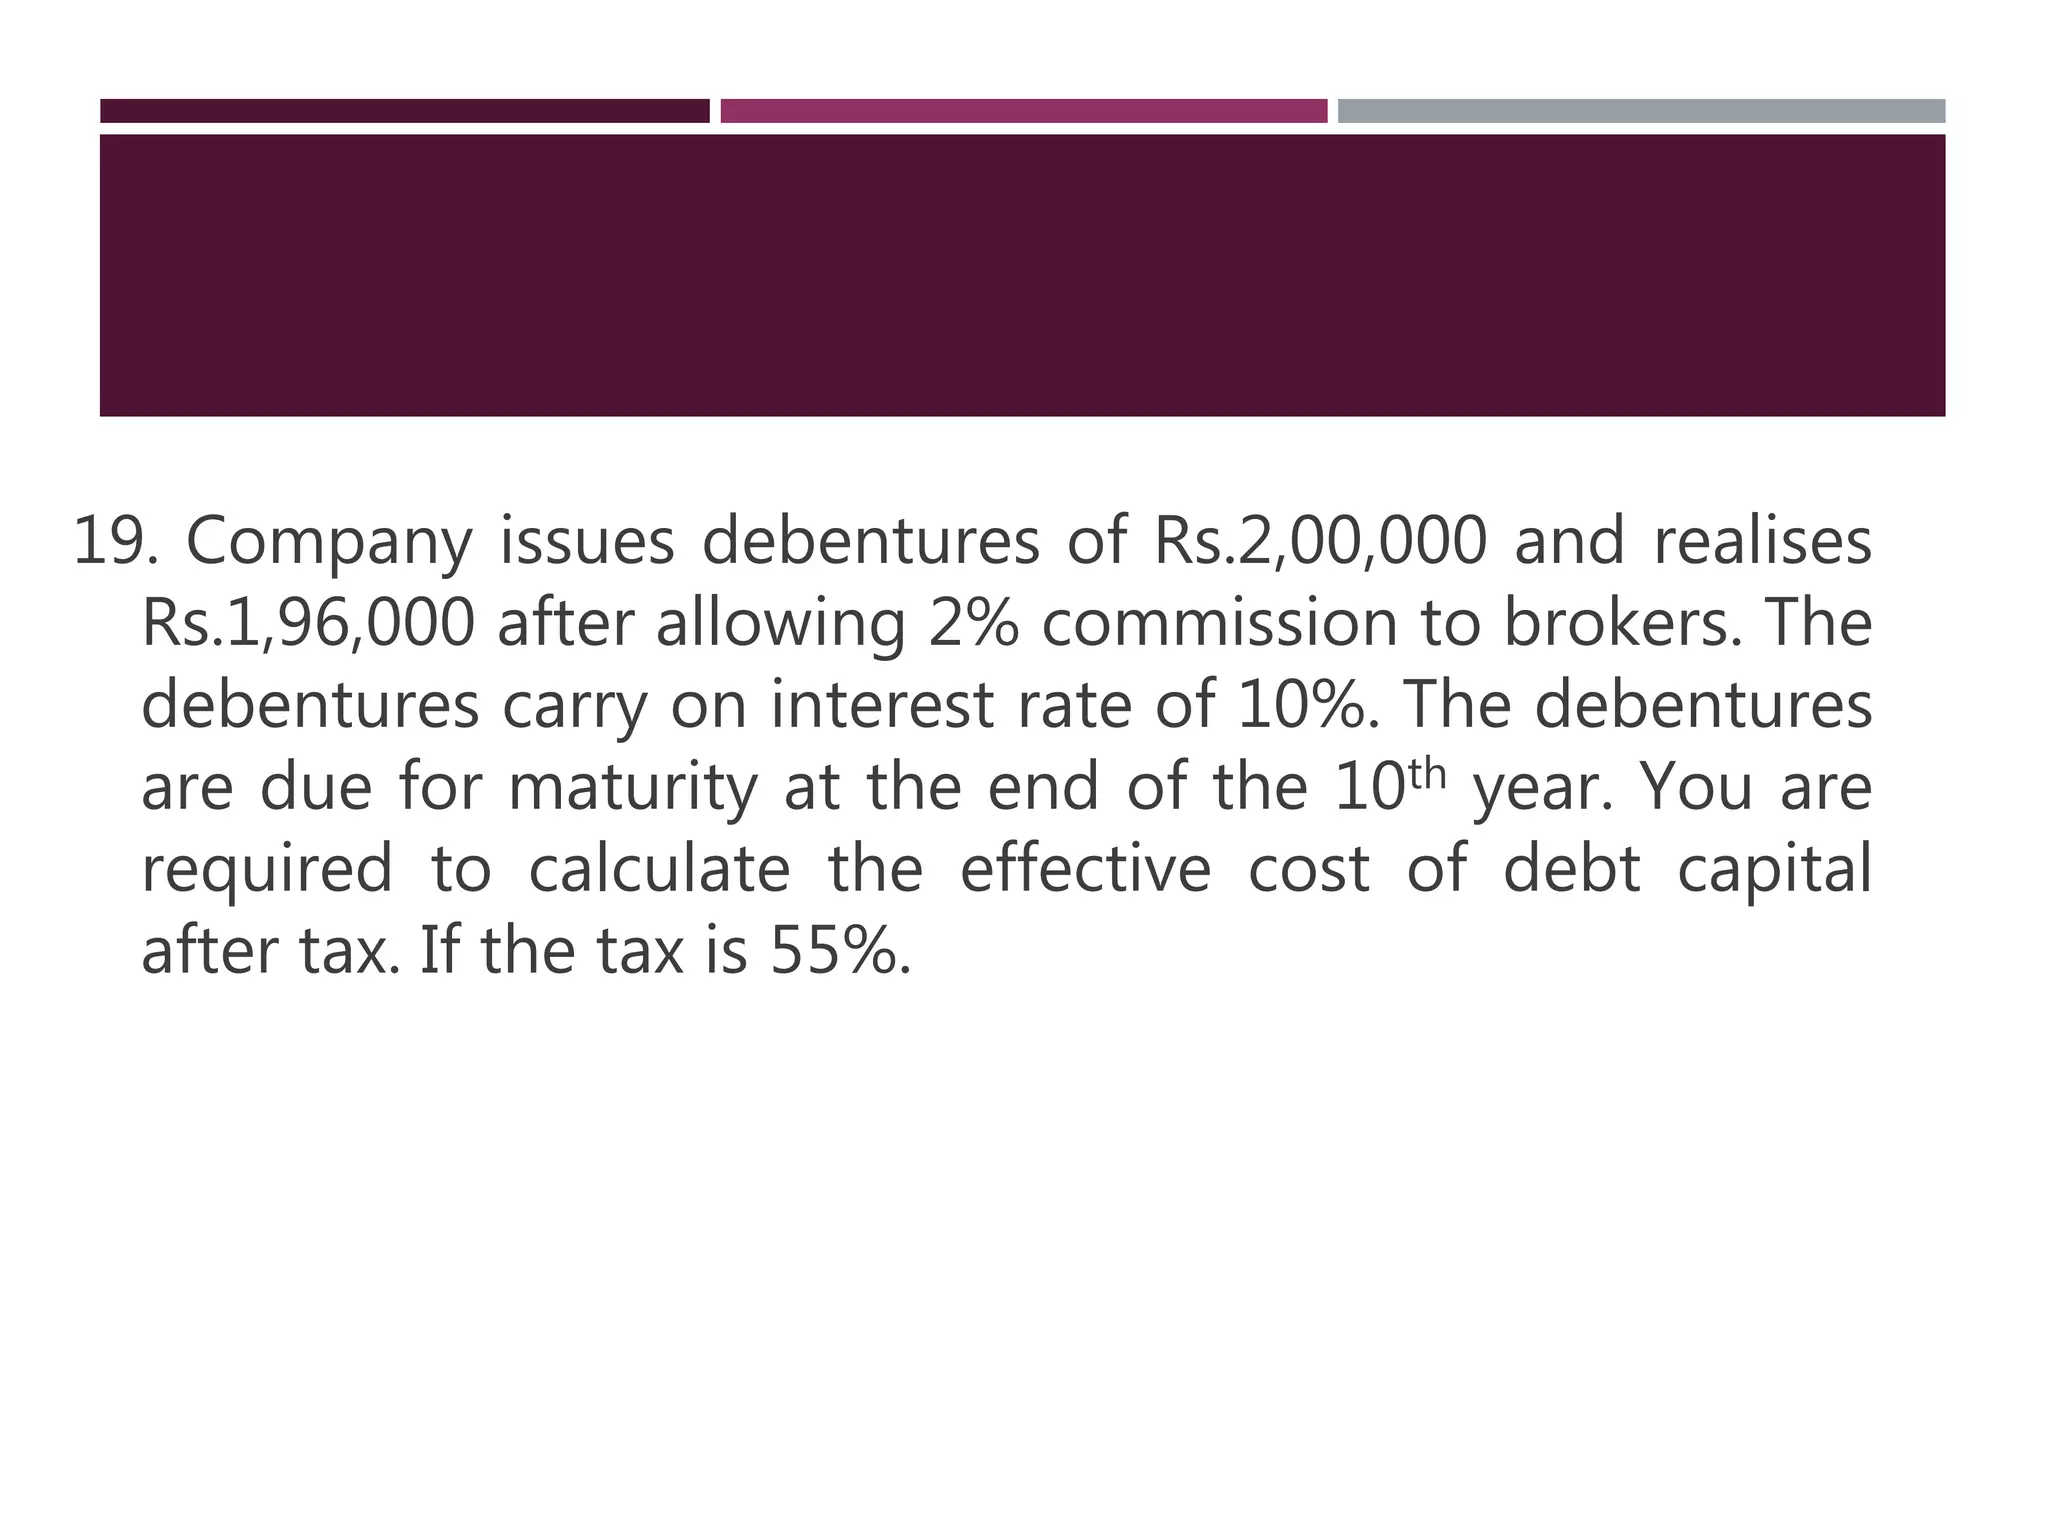
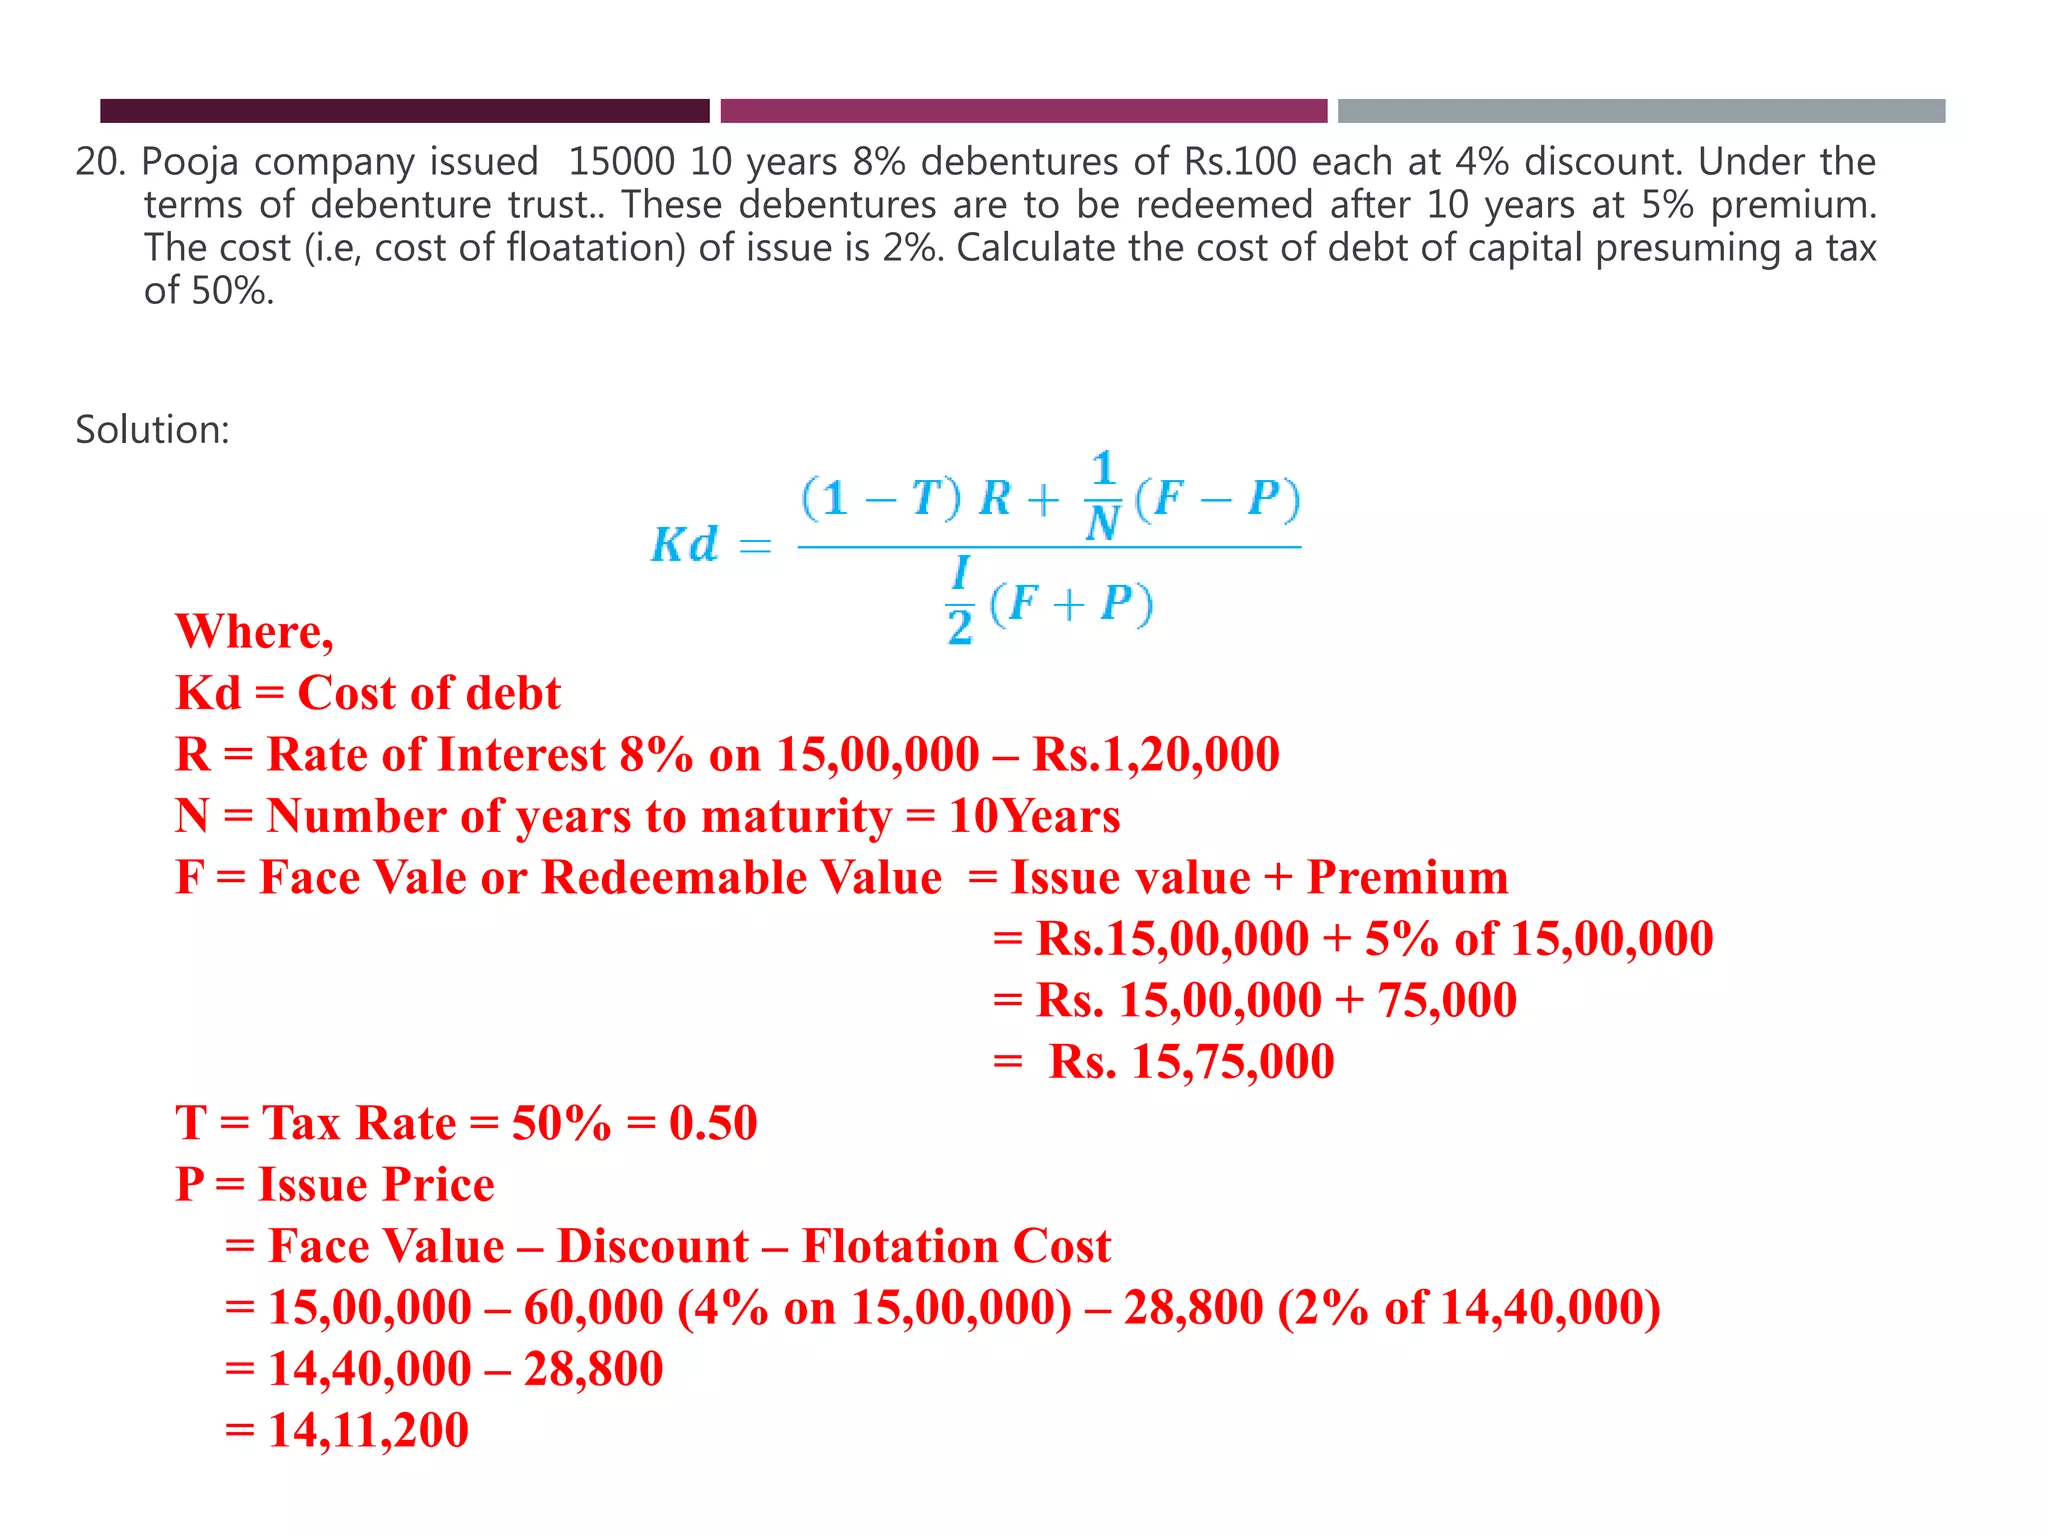
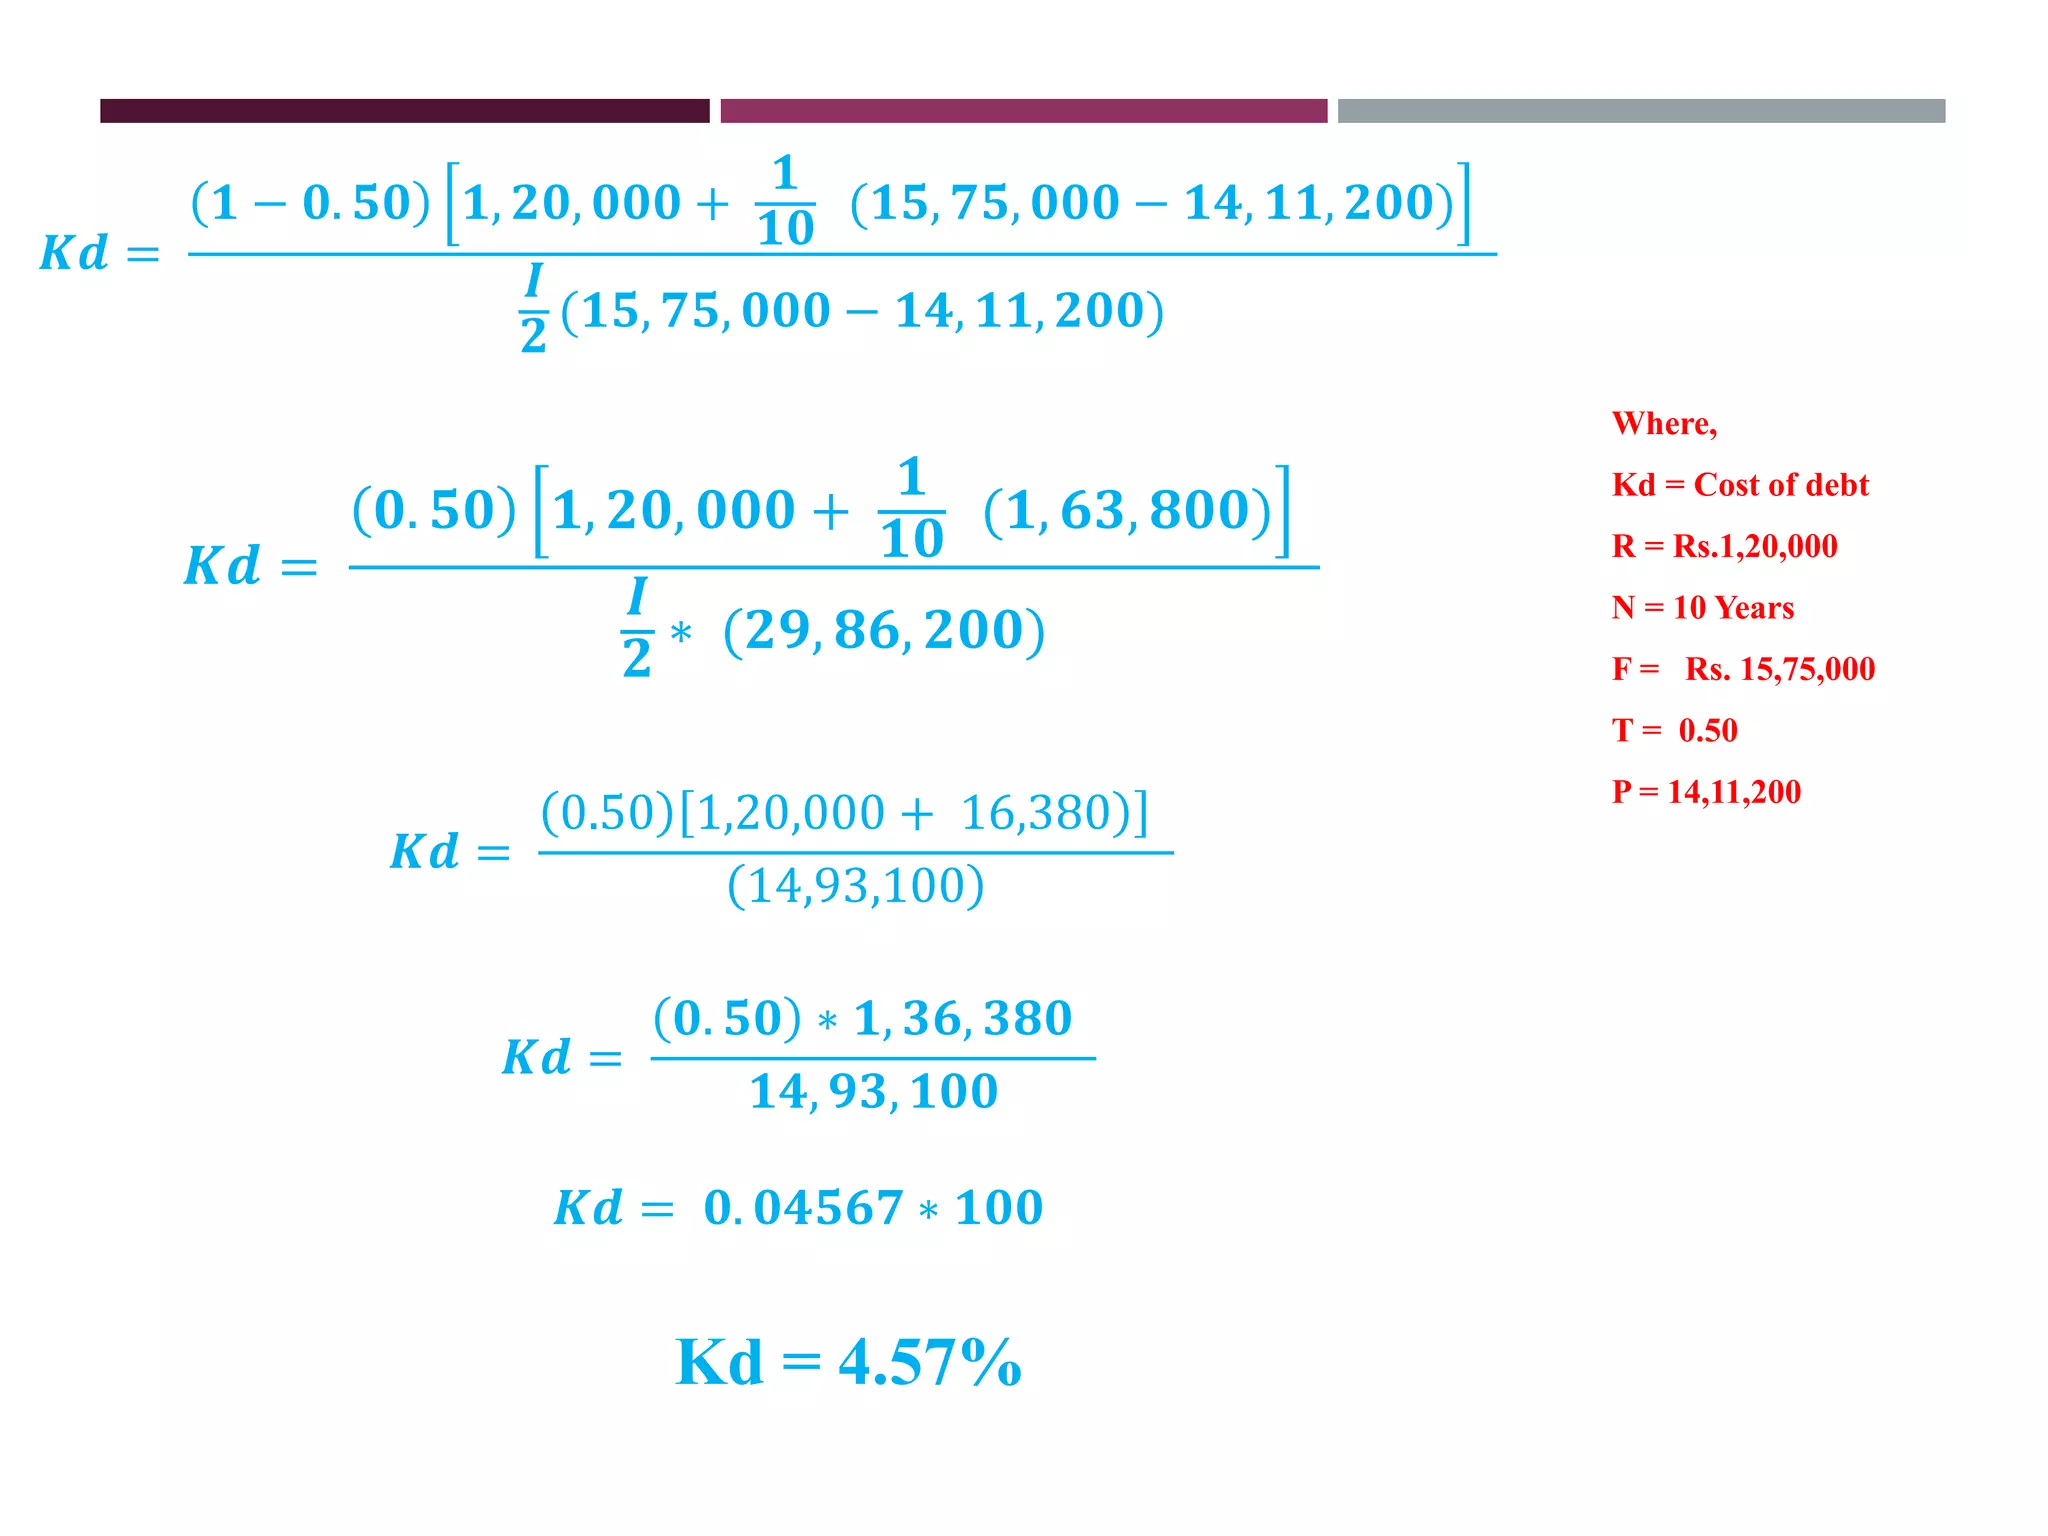
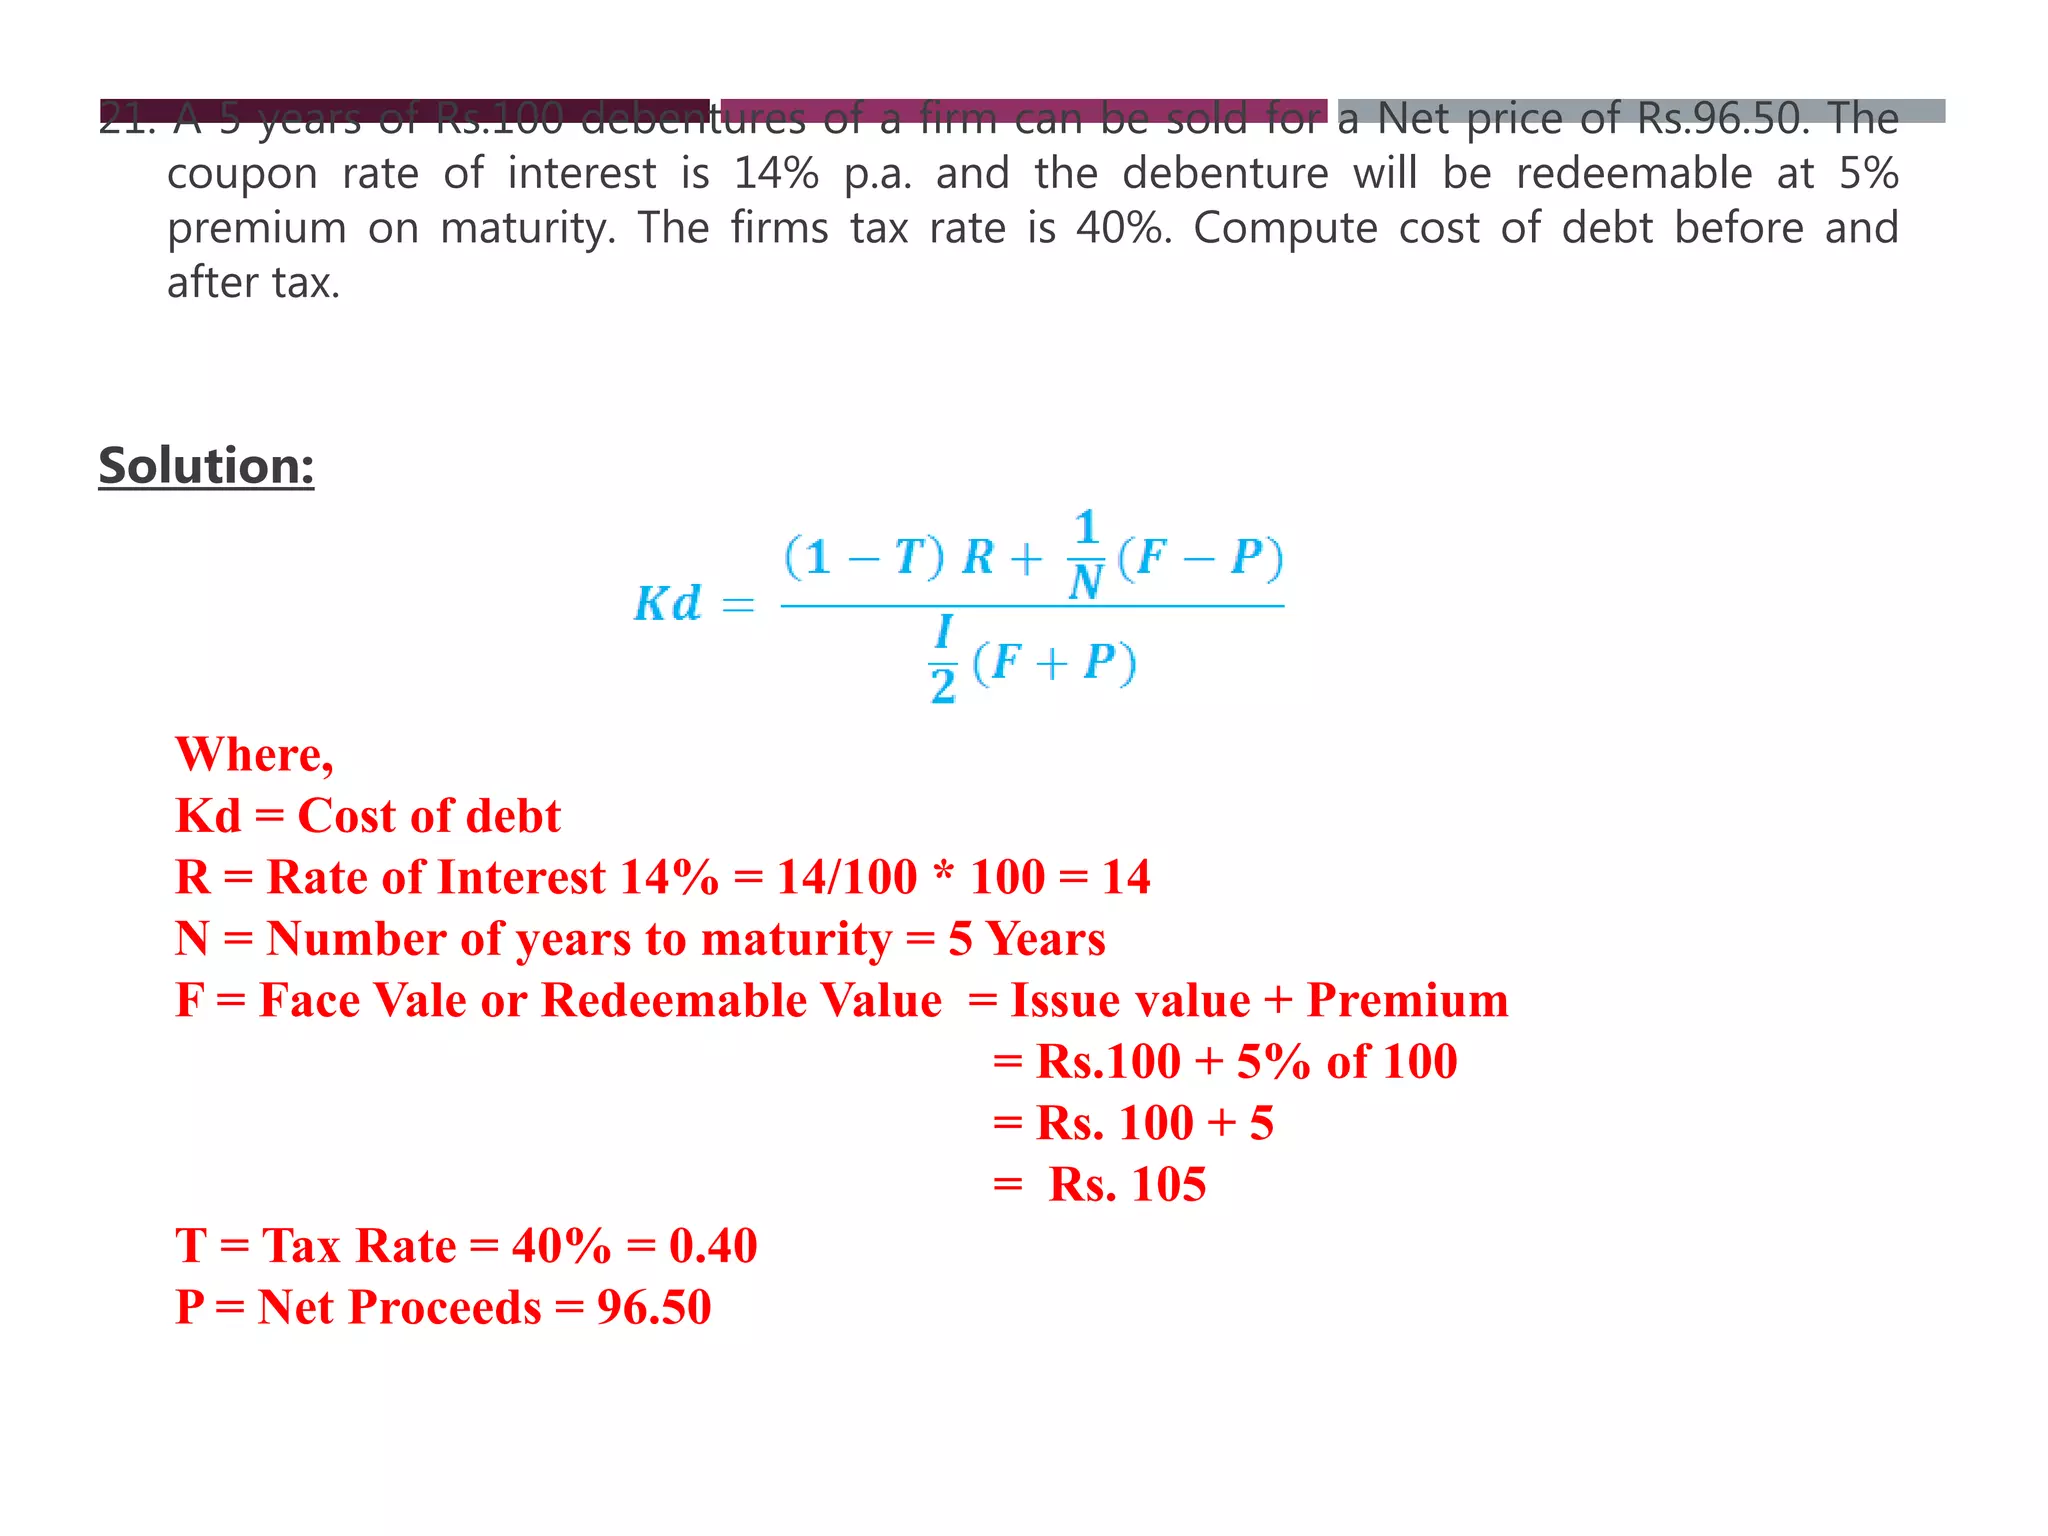
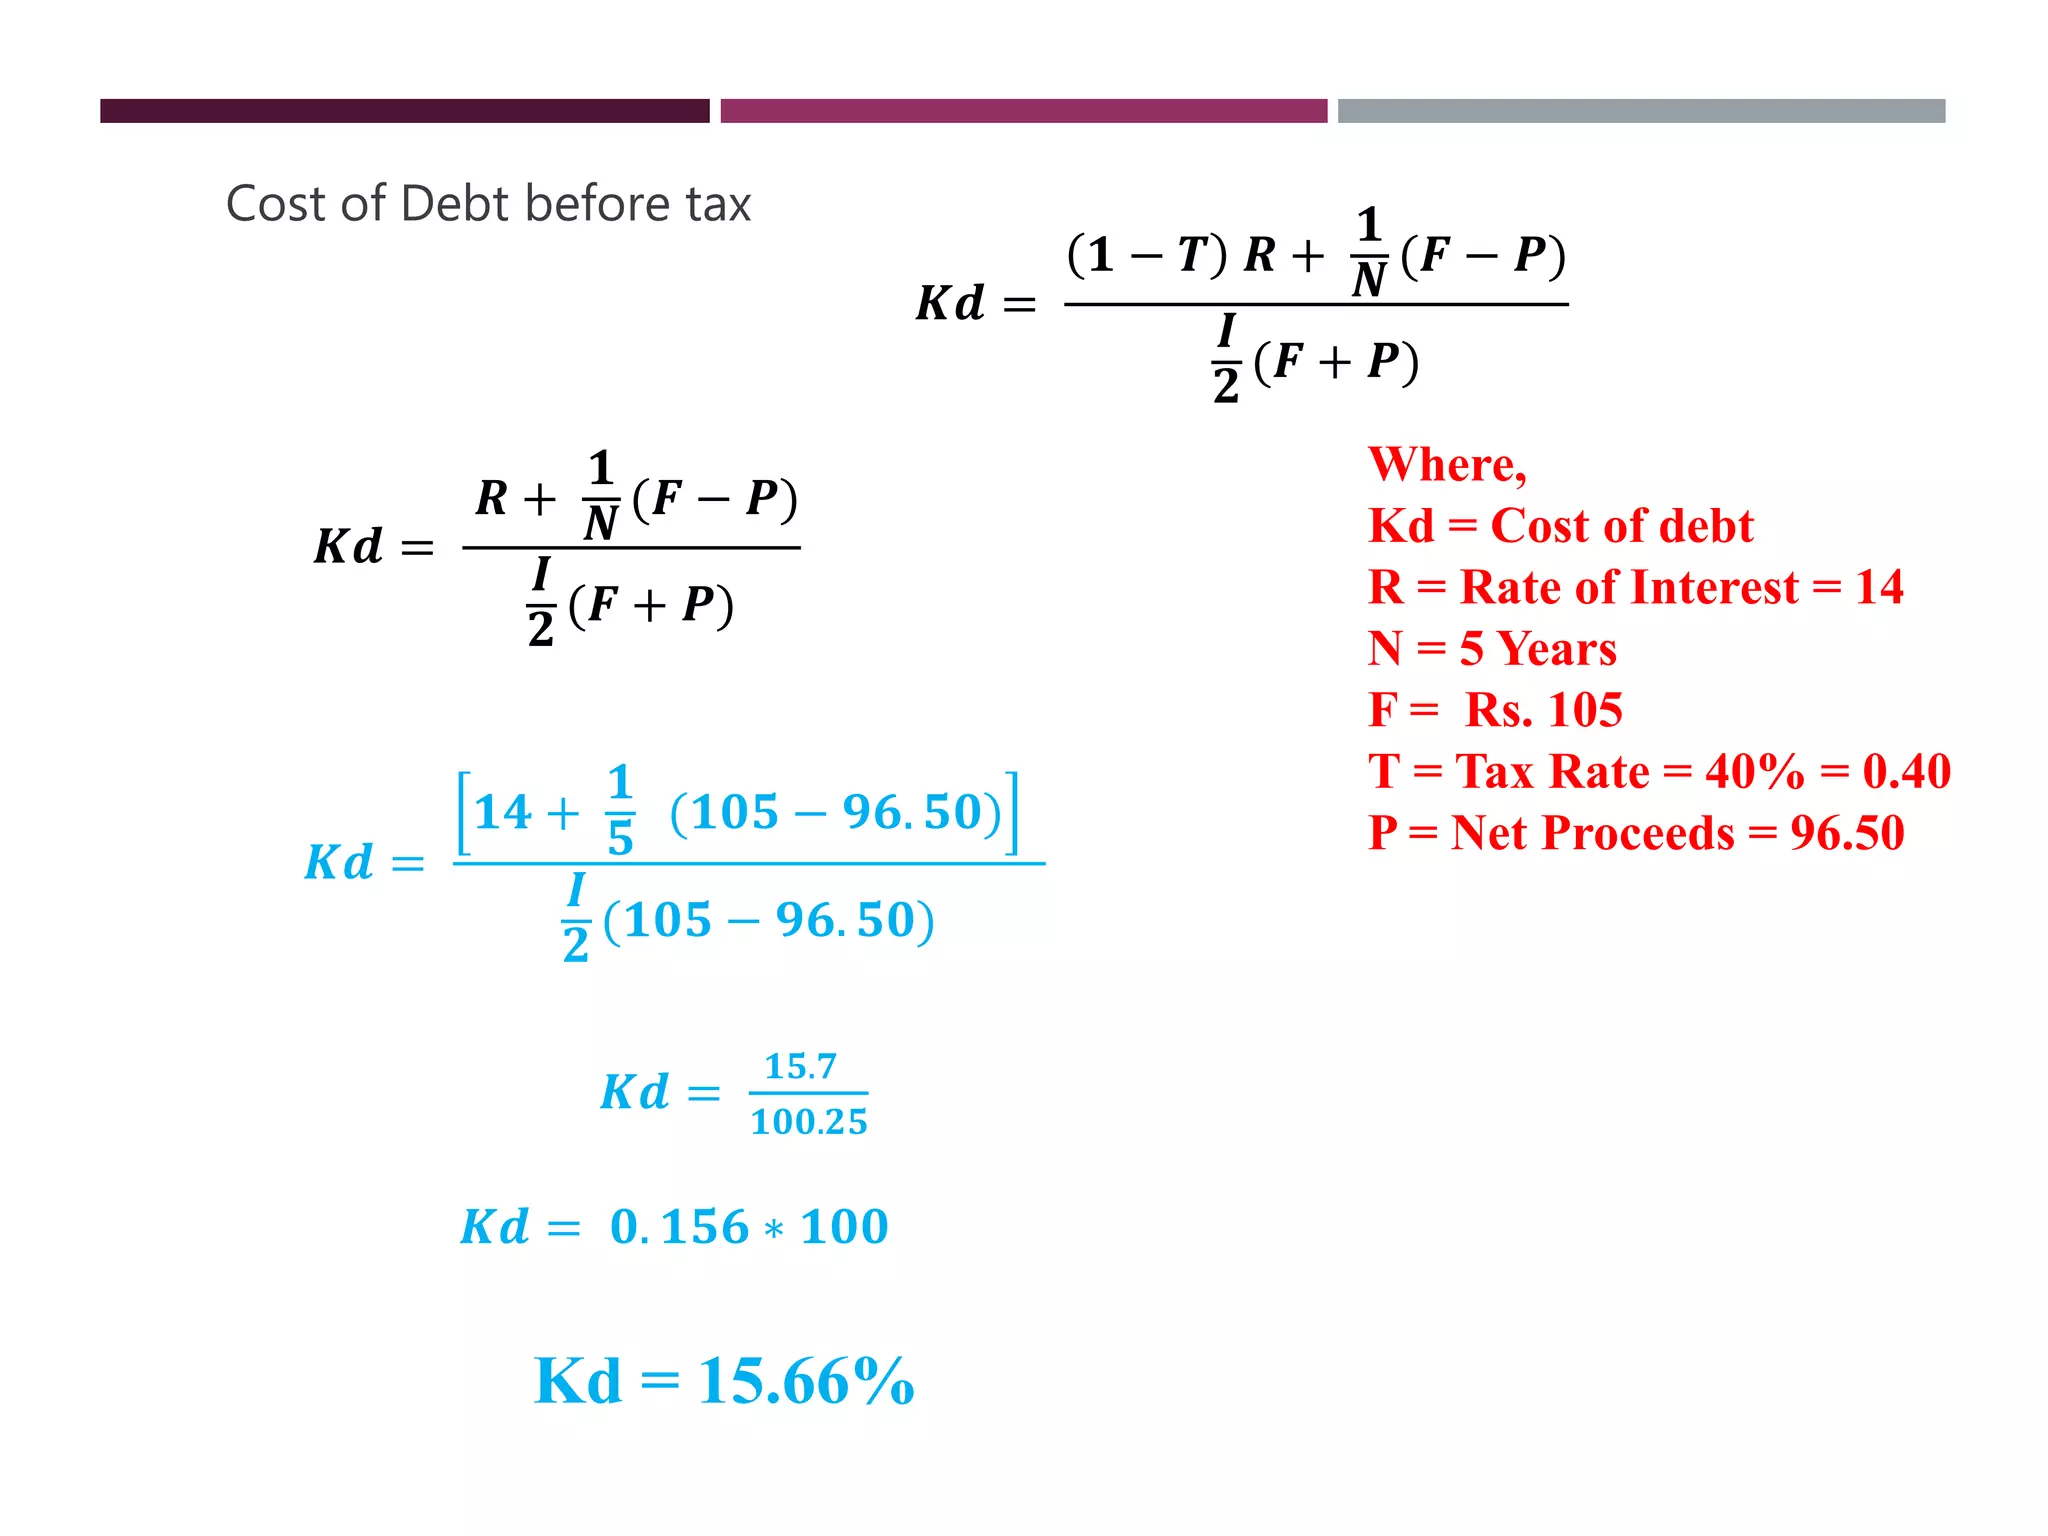
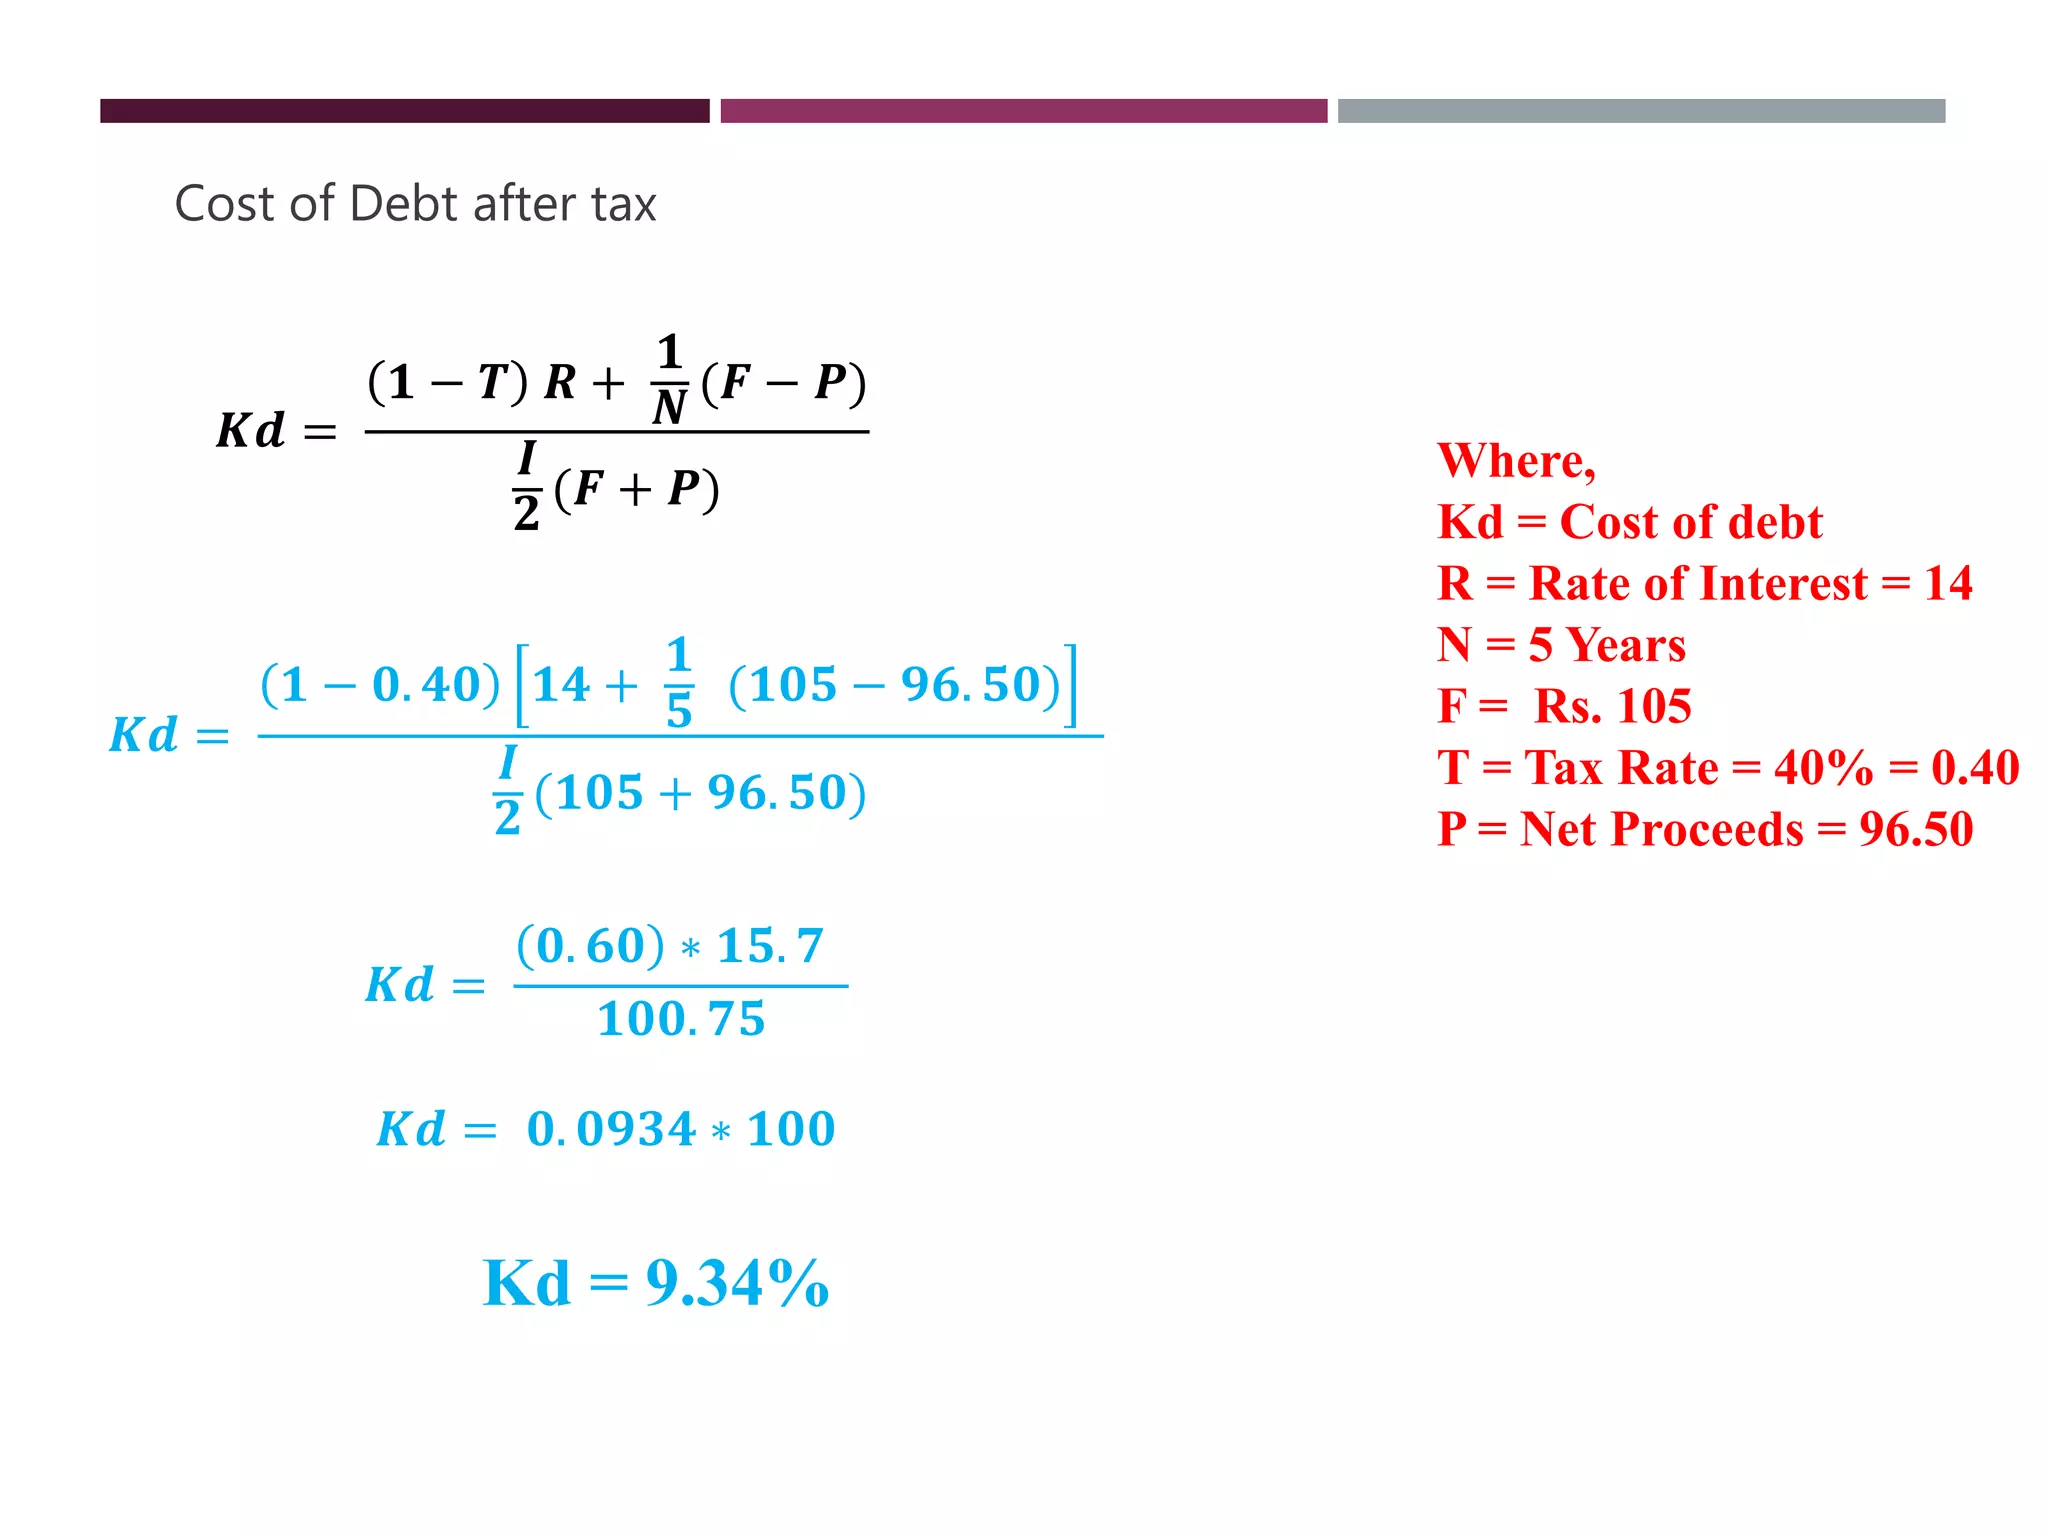
Cost of debt (i.e, debentures and long term debt) is defined in terms of the required rate of return that the debt, investment must yield to protect the shareholders interest. Hence, Cost of debt is contractual interest rate, adjusted further for the tax liability of the firm.
Cost of DebtDebentures are issued at par, at a premium and discount. Cost of Redeemable Debt
Cost of Preference Capital Soved Problems-kpuma reur
The Preference Capital carries a cost. The Cost of Preference Capital is calculated as follows:
Preference Shares may be issued at Par, Premium, Discount.
Cost of Redeemable Preference Shares
This analysis is an important tool used to optimize the capital structure for highest earnings for shareholders
It helps in understanding the sensitivity of EPS at given level of Earning before Interest & Tax under different sources of financing
It helps in analyzing how capital structure decision is important to raise the value of firm
An optimal financing structure minimizes the cost of capital and maximizes the earnings
Earning Per Share under different Capital structure plans
Plan 1 ( Only Equity Shares )
EPS = (EBIT (1−Tax rate))/(No. of Outstanding Shares)
Plan 2 ( Equity Shares & Debt )
EPS = ((EBIT −Interest) (1−Tax rate))/(No. of Outstanding Shares)
Plan 3 (Equity, Debt & Preference Shares)
EPS = ((EBIT −Interest) (1−Tax rate)−Pref. Dividend)/(No. of Outstanding Shares)
Plan 4 (Equity shares & Preference Shares)
EPS = (EBIT (1−Tax rate)−Pref. Dividend)/(No. of Outstanding Shares)
Thank You For Waching
Subscribe to DevTech Finance
Weighted average cost is the average of the costs of specific sources of capital employed in a business, properly weighted by the proportion they hold in the firm’s capital structure.
Book Value :
Value shown in the balance sheet is called book value. Weightage to each source of finance is given on the basis of book value as recorded in the balance sheet.
Market Value :
Market value represent prices of prevailing in the stock market for securities. So current market price are applied in ascertaining the weightage.
Investment Decision — Capital Budgeting Techniques — Pay Back Method — Accounting Rate Of Return — NPV — IRR — Discounted Pay Back Method — Capital Rationing — Risk Adjusted Techniques Of Capital Budgeting. — Capital Budgeting Practices
Many investors mistakenly base the success of their portfolios on returns alone. Few consider the risk that they took to achieve those returns. Since the 1960s, investors have known how to quantify and measure risk with the variability of returns, but no single measure actually looked at both risk and return together. Today, we have three sets of performance measurement tools to assist us with our portfolio evaluations. The Treynor, Sharpe and Jensen ratios combine risk and return performance into a single value, but each is slightly different. Which one is best for you? Why should you care? Let's find out.
Portfolio performance measures should be a key aspect of the investment decision process. These tools provide the necessary information for investors to assess how effectively their money has been invested (or may be invested). Remember, portfolio returns are only part of the story. Without evaluating risk-adjusted returns, an investor cannot possibly see the whole investment picture, which may inadvertently lead to clouded investment decisions.
This ppt is all about the long term finance for the business. From which sources a business firm used to get their long term finance to run the business. So i hope it will help you to give your presentation . Thanks for the download. And if you find any mistake, please feel free to comment and inform.
or send me a mail in tatinpisa@outlook.com
The cost of capital is the minimum rate of return which a company is expected to earn from a proposed project so as to make no reduction in the earning per share to equity shareholders and its market price
Sources of Funds:
Transactions which result in an increase in the amount of fund or working capital are called sources of fund.
The following are the sources of funds:
Funds from operations, operating profit or trading profit.
Non operating incomes.
Refund of Income Tax (received).
Issue of Shares for cash or for any other current asset.
Issue of debentures for cash or for any other current asset.
Long term and medium term loans borrowed.
Long term or medium term deposits accepted.
Sale of long term investments for cash or for any other current asset.
Sale of fixed assets for cash or for any other current asset.
Preparation of Funds from Operations
The term Operation means the day to day affairs of the business.
It refers to trading.
Non operating items should not be treated as operational, while ascertaining funds from operations.
Examples of Non Operating expenses:
Depreciation
Loss on sale of fixed assets.
Writing-Off of fictious assets like Goodwill
Preliminary expenses, discount or loss on issue of shares and debentures
FFA- Statement of Schedule of Changes in Working Capitaluma reur
Statement Of Schedule Of Changes In Working Capital
This statement is prepared with the help of current assets and current liabilities relating to two different periods.
An increase or decrease in respect of each of such items should be recorded to ascertain the net increase or decrease in the working capital.
An increase in the value of current assets between two different periods indicates an increase in the working capital. It is an application of funds.
An increase in the value of current liabilities between two different periods indicates decrease in the working capital. It is sources of funds.
Investment:
Relationship between profit and investment is shown by computing “Rate of Return ratios”.
Return on Investment (ROI)
Return on Total Resources
Return on Equity (ROE)
Earning Per Share Ratio (EPS)
Fixed Assets Turnover Ratio
Debt to Total Fund Ratio
Entrepreneurship Development Programme (EDP)uma reur
EDP – Introduction to Entrepreneurship Development Programme
Entrepreneurship Development Programme is primarily meant for developing those first generation entrepreneurs who on their own cannot become successful entrepreneurs. It covers three major variables- location, target group and enterprise.
Any of these can become the focus or starting point for initiating and implementing an EDP.
The Khadi and Village Industries Commission (KVIC)uma reur
The Khadi and Village Industries Commission (KVIC) is a statutory body formed in April 1957 (During 2nd Five Year plan) by the Government of India, under the Act of Parliament, 'Khadi and Village Industries Commission Act of 1956'. It is an apex organisation under the Ministry of Micro, Small and Medium Enterprises, with regard to khadi and village industries within India, which seeks to - "plan, promote, facilitate, organise and assist in the establishment and development of khadi and village industries in the rural areas in coordination with other agencies engaged in rural development wherever necessary.“
KVIC also helps in building up reserve of raw materials for supply to producers.
The commission focuses in creation of common service facilities for processing of raw materials, such as semi-finished goods.
KVIC has also helped in creation of employment in Khadi industry.
Schemes Under Khadi and Village Industries Commission
Under the Khadi and Village Industries Commission, you can avail the following schemes:
PMEGP or Prime Minister's Employment Generation Programme
The Ministry of Micro, Small and Medium Enterprises introduced this credit linked subsidy scheme for the creation of employment in both rural and urban areas of the nation. This scheme replaced the previous Rural Employment Generation Programme or in short the REGP.
Under the PMEGP scheme the applicants from the general category are given a 15% to 25% subsidy on the interest rates. Applicants from other categories than general as well as woman applicants, former service members, physically disabled and applicants from the hill or border areas are provided with a subsidy of 20% to 35%.
Entrepreneurship Development Institute of India (EDII)uma reur
EDI has been spearheading entrepreneurship movement throughout the nation with a belief that entrepreneurs need not necessarily be born, but can be developed through well-conceived and well-directed activities.
In consonance with this belief, EDI aims at:
Creating a multiplier effect on opportunities for self-employment,
Augmenting the supply of competent entrepreneurs through training,
Augmenting the supply of entrepreneur trainer-motivators,
Participating in institution building efforts,
Long-Term Financing
Long-term financing is usually needed for acquiring new equipment, R&D, cash flow enhancement, and company expansion. Some of the major methods for long-term financing are discussed below.
Equity Financing
Equity financing includes preferred stocks and common stocks. This method is less risky in respect to cash flow commitments. However, equity financing often results in dissolution of share ownership and it also decreases earnings.
The cost associated with equity is generally higher than the cost associated with debt, which is again a deductible expense. Therefore, equity financing can also result in an enhanced hurdle rate that may cancel any reduction in the cash flow risk.
Sales:
Relationship between profit and sales is shown by computing “Profit margin ratios”.
Gross Profit Ratio
Operating Ratio
Expenses Ratio
Operating Profit Ratio
Net Profit Ratio
From the following information calculate Debtors turnover ratio (DTR) and Average collection period (ACP).
Total Sales Rs.3,80,000, Cash sales Rs. 2,40,000, Opening Debtors Rs. 12,000, Closing Debtors Rs. 16,800. Opening balance of Bills receivable Rs. 9,600 and Closing balance of Bills receivable Rs.14,400.
Creditor’s Turnover Ratio is also known as Payables Turnover Ratio, Creditor’s Velocity and Trade Payables Ratio. It is an activity ratio that finds out the relationship between net credit purchases and average trade payables of a business.
It finds out how efficiently the assets are employed by a firm and indicates the average speed with which the payments are made to the trade creditors.
It is calculated by the following formula:
Role of financial institutions in support of women entrepreneurial activities...uma reur
The RUDSETI type of Institutions aided by GoI will, therefore, have the following objectives:
The trainings offered will be demand driven
Rural BPL youth will be given priority
Area in which training will be provided to a particular rural BPL youth will be decided after assessment of the aptitude of the candidate
Hand holding will be provided for assured credit linkage with Banks
Escort services will be provided for ensuring at least a two year follow up to ensure sustainability of micro enterprise undertaken by the rural BPL youth.
Provide intensive short-term residential self-employment training programmes with free food and accommodation to rural youth for taking up self employment initiatives and skill up gradation for running their micro-enterprises successfully.
Empower rural youth and economically backward sections leading to the development of rural enterprises and entrepreneurship.
Identify, orient, motivate, train and assist rural youth including tribal communities to attain sustainability and economic well being through rural entrepreneurship.
Upgrade technical, agricultural, managerial and service delivery skills.
Promote and train self-help groups.
Identify, develop and transfer appropriate and sustainable rural technologies.
Personality development for school and college students.
Promote awareness and trigger use of non-conventional and energy efficient technologies.
Identification & selection of right candidate for the right course.
Campus and practical approach.
Use of simulation exercises, group discussions, role plays during training period.
Field visits & experience sharing with role models.
Interactions with Bankers /Govt. Officials.
Turnover Ratios or Activity Ratios or Performance Ratios
Turnover ratios are used to determine how efficiently the financial assets and liabilities of an organization have been used for the purpose of generating revenues. These ratios measure the operating efficiency of an enterprise.
The types of Turnover ratios are: –
Inventory Turnover Ratio or Stock Turnover Ratio.
Debtors Turnover Ratio.
Creditors Turnover Ratio.
Cash Turnover Ratio.
Working Capital Turnover Ratio.
Fixed Assets Turnover Ratio.
Capital Turnover Ratio or Sales to Net Worth Ratio.
It is also referred as the stock turnover ratio which is used to measure the number of sales generated from its inventory and how efficiently the inventories in a company is used.
This ratio reveals the number of times stock is replaced during a given accounting period.
It is calculated by the following formula:
Illustration 1:
From the following information calculate stock turnover ratio. Opening stock 30,000, purchases 90,000, carriage inward 7500, sales 1,50,000, closing stock 15,000, gross profit 37,500.
The Debtors Turnover Ratio also called as Receivables Turnover Ratio or Debtors velocity shows how quickly the credit sales are converted into the cash. This ratio measures the efficiency of a firm in managing and collecting the credit issued to the customers.
It is calculated by the following formula:
De퐛퐭퐨퐫퐬 퐓퐮퐫퐧퐨퐯퐞퐫 퐑퐚퐭퐢퐨=(퐍퐞퐭 퐂퐫퐞퐝퐢퐭 퐒퐚퐥퐞퐬)/(퐀퐯퐞퐫퐚퐠퐞 퐃퐞퐛퐭퐨퐫퐬)
Interpretation:
Standard credit period is 30 days
If the credit period is more than 30 days it indicates that the concern is not efficient.
If the credit period is less than 30 days it indicates that the concern is efficient.
The Average Collection Period, also called as Debt Collection Period, shows how much time business takes to realize the credit sales. Simply, how long will it take to recover payments from the debtors against the credit sales?
It is calculated by dividing the number of months or days or weeks by the debtors turnover ratio.
Leverage Ratios or Solvency Ratios or Capital Structure Ratios
Leverage or Solvency ratios can be defined as a type of ratio that is used to evaluate whether a company is solvent and well capable of paying off its debt obligations or not. These ratios are used to measure the long term financial position as a test of solvency of an organisation.
The types of Leverage ratios are: –
Proprietary Ratio or Equity Ratio
Equity to Fixed Asset Ratio
Equity to Current Assets Ratio
Current Liabilities to Shareholders Funds Ratio
Debt Equity Ratio
Capital Gearing or Leverage Ratio
Liquidity Ratios
This type of ratio helps in measuring the ability of a company to take care of its short-term debt obligations. A higher liquidity ratio represents that the company is highly rich in cash.
The types of liquidity ratios are: –
Current Ratio or Working Capital Ratio
Quick Ratio or Liquidity Ratio or Acid Test Ratio
Absolute Liquid Ratio or Cash Ratio
Stock to Working Capital Ratio
Current Ratio: The current ratio is the ratio between the current assets and current liabilities of a company. The current ratio is used to indicate the liquidity of an organization in being able to meet its debt obligations in the upcoming twelve months. A higher current ratio will indicate that the organization is highly capable of repaying its short-term debt obligations.
Current Ratio = Current Assets / Current Liabilities
Current Assets:
Current Assets means cash and those assets which can be converted into cash within one year in ordinary course of business.
Current Liabilities:
Current Liabilities are those which are to be paid by the firm in one year.
Quick Ratio or Liquidity Ratio or Acid Test Ratio :
The quick ratio is used to ascertain information pertaining to the capability of a company in paying off its current liabilities on an immediate basis.
The formula used for the calculation of a quick ratio is-
Quick Ratio = (Cash and Cash Equivalents + Marketable Securities + Accounts Receivables) / Current Liabilities
. Absolute Liquid Ratio or Cash Ratio:
The cash ratio measures a company’s ability to pay off short-term liabilities with cash and cash equivalents:
Cash ratio = Cash and Cash equivalents / Current Liabilities
Stock to Working Capital Ratio:
It is calculated by dividing the value of stock (or inventories such as raw materials, work in progress, finished goods, stores and packing materials) by the Working capital.
Role of financial institutions in support of women entrepreneurial activities...uma reur
The ‘District Industries Centre’ (DICs) programme was started by the central government in 1978 with the objective of providing a focal point for promoting small, tiny, cottage and village industries in a particular area and to make available to them all necessary services and facilities at one place. The finances for setting up DICs in a state are contributed equally by the particular State Government and the Central Government.
To facilitate the process of small enterprise development, DICs have been entrusted with most of the administrative and financial powers. For purpose of allotment of land, work sheds, raw materials etc., DICs functions under the ‘Directorate of Industries’. Each DIC is headed by a General Manager who is assisted by four functional managers and three project managers to look after the following activities :
The important objectives of DICs are as follow :
i. Accelerate the overall efforts for industrialisation of the district.
ii. Rural industrialisation and development of rural industries and handicrafts.
iii. Attainment of economic equality in various regions of the district.
iv. Providing the benefit of the government schemes to the new entrepreneurs.
v. Centralisation of procedures required to start a new industrial unit and minimisation- of the efforts and time required to obtain various permissions, licenses, registrations, subsidies etc.
CEDOK Established in 1992 is a Government of Karnataka Organisation promoted by the Department of Industries and Commerce with the support of State level industrial developmental agencies such as :
Karnataka State Small Industries Development Corporation (KSSIDC),
Karnataka State Financial Corporation (KSFC),
Karnataka State Industrial Investment Development Corporation (KSIIDC),
Karnataka Industrial Area Development Board (KIADB),
and national level financial institutions such as
Industrial Development Bank of India (IDBI),
Industrial Finance Corporation of India (IFCI),
Industrial Credit and Investment Corporation of India (ICICI) and
Government of India through Development Commissioner (SSI), New Delhi
with a objective to contribute to the development and dispersal of entrepreneurship by undertaking various entrepreneurship development and skill development / upgradation training programmes thus expand the social and economical base of entrepreneurial class
Role of financial institutions in support of women entrepreneurial activities...uma reur
Origin of SIDBI
In order to promote small scale industries in the country, a special Act was passed in Parliament in April 1990 for starting of Small Industries Development Bank of India. SIDBI is a wholly owned subsidiary of IDBI. It is providing assistance to all those institutions which are promoting small scale industries.
Capital of SIDBI
SIDBI has an authorised capital of Rs. 1000 crores. The RBI has also allocated INR 10,000 Crores to SIDBI for various venture capital activities and company startups in 2015. The entire operations of IDBI connected with small scale industries are now handed over to SIDBI.
Objectives of SIDBI:
To promote marketing of products of small scale sector.
To upgrade technology and also undertaking modernization of small scale units.
To provide more financial assistance to small scale ancillary and tiny sector.
To encourage employment oriented industries.
To coordinate all the other institutions involved in the promotion of small scale industries.
Financial ratios are created with the use of numerical values taken from financial statements to gain meaningful information about a company. The numbers found on a company’s financial statements – balance sheet, income statement, and cash flow statement – are used to perform quantitative analysis and assess a company’s liquidity, leverage, growth, margins, profitability, rates of return, valuation, and more.
Modes of Expression of Ratios:
Ratios may be expressed in any one or more of the following ways:
(a) Proportion,
(b) Rate or times
(c) Percentage.
Advantages of Ratio Analysis:
The information shown in financial statements does not signify anything individually because the facts shown are inter-related. Hence it is necessary to establish relationships between various items to reveal significant details and throw light on all notable financial and operational aspects. Ratio analysis caters to the needs of various parties interested in financial statements. The basic objective of ratio analysis is to help management in interpretation of financial statements to enable it to perform the managerial functions efficiently.
Limitations of Ratio Analysis:
Ratios are precious tools in the hands of management but the utility lies in the proper utilisation of ratios. Mishandling or misuse of ratios and using them without proper context may lead the management to a wrong direction. The financial analyst should be well versed in computing ratios and proper utilization of ratios. Like all techniques of control, ratio analysis also suffers from several ‘ifs and buts’ and for proper computation and utilization of ratios the analyst should be aware of the limitations of ratio analysis.
Uses and Users of Financial Ratio Analysis
Analysis of financial ratios serves two main purposes:
1. Track company performance
Determining individual financial ratios per period and tracking the change in their values over time is done to spot trends that may be developing in a company. For example, an increasing debt-to-asset ratio may indicate that a company is overburdened with debt and may eventually be facing default risk.
2. Make comparative judgments regarding company performance
Comparing financial ratios with that of major competitors is done to identify whether a company is performing better or worse than the industry average. For example, comparing the return on assets between companies helps an analyst or investor to determine which company is making the most efficient use of its assets.
Users of financial ratios include parties external and internal to the company:
External users: Financial analysts, retail investors, creditors, competitors, tax authorities, regulatory authorities, and industry observers
Internal users: Management team, employees, and owners
Operation “Blue Star” is the only event in the history of Independent India where the state went into war with its own people. Even after about 40 years it is not clear if it was culmination of states anger over people of the region, a political game of power or start of dictatorial chapter in the democratic setup.
The people of Punjab felt alienated from main stream due to denial of their just demands during a long democratic struggle since independence. As it happen all over the word, it led to militant struggle with great loss of lives of military, police and civilian personnel. Killing of Indira Gandhi and massacre of innocent Sikhs in Delhi and other India cities was also associated with this movement.
Students, digital devices and success - Andreas Schleicher - 27 May 2024..pptxEduSkills OECD
Andreas Schleicher presents at the OECD webinar ‘Digital devices in schools: detrimental distraction or secret to success?’ on 27 May 2024. The presentation was based on findings from PISA 2022 results and the webinar helped launch the PISA in Focus ‘Managing screen time: How to protect and equip students against distraction’ https://www.oecd-ilibrary.org/education/managing-screen-time_7c225af4-en and the OECD Education Policy Perspective ‘Students, digital devices and success’ can be found here - https://oe.cd/il/5yV
Synthetic Fiber Construction in lab .pptxPavel ( NSTU)
Synthetic fiber production is a fascinating and complex field that blends chemistry, engineering, and environmental science. By understanding these aspects, students can gain a comprehensive view of synthetic fiber production, its impact on society and the environment, and the potential for future innovations. Synthetic fibers play a crucial role in modern society, impacting various aspects of daily life, industry, and the environment. ynthetic fibers are integral to modern life, offering a range of benefits from cost-effectiveness and versatility to innovative applications and performance characteristics. While they pose environmental challenges, ongoing research and development aim to create more sustainable and eco-friendly alternatives. Understanding the importance of synthetic fibers helps in appreciating their role in the economy, industry, and daily life, while also emphasizing the need for sustainable practices and innovation.
This is a presentation by Dada Robert in a Your Skill Boost masterclass organised by the Excellence Foundation for South Sudan (EFSS) on Saturday, the 25th and Sunday, the 26th of May 2024.
He discussed the concept of quality improvement, emphasizing its applicability to various aspects of life, including personal, project, and program improvements. He defined quality as doing the right thing at the right time in the right way to achieve the best possible results and discussed the concept of the "gap" between what we know and what we do, and how this gap represents the areas we need to improve. He explained the scientific approach to quality improvement, which involves systematic performance analysis, testing and learning, and implementing change ideas. He also highlighted the importance of client focus and a team approach to quality improvement.
How to Make a Field invisible in Odoo 17Celine George
It is possible to hide or invisible some fields in odoo. Commonly using “invisible” attribute in the field definition to invisible the fields. This slide will show how to make a field invisible in odoo 17.
Instructions for Submissions thorugh G- Classroom.pptxJheel Barad
This presentation provides a briefing on how to upload submissions and documents in Google Classroom. It was prepared as part of an orientation for new Sainik School in-service teacher trainees. As a training officer, my goal is to ensure that you are comfortable and proficient with this essential tool for managing assignments and fostering student engagement.
The Art Pastor's Guide to Sabbath | Steve ThomasonSteve Thomason
What is the purpose of the Sabbath Law in the Torah. It is interesting to compare how the context of the law shifts from Exodus to Deuteronomy. Who gets to rest, and why?
How to Split Bills in the Odoo 17 POS ModuleCeline George
Bills have a main role in point of sale procedure. It will help to track sales, handling payments and giving receipts to customers. Bill splitting also has an important role in POS. For example, If some friends come together for dinner and if they want to divide the bill then it is possible by POS bill splitting. This slide will show how to split bills in odoo 17 POS.
How to Create Map Views in the Odoo 17 ERPCeline George
The map views are useful for providing a geographical representation of data. They allow users to visualize and analyze the data in a more intuitive manner.
3. COMPUTATION OF COST OF CAPITAL
Computation of overall cost of capital involves:
Computation of cost of specific source of finance.
Computation of weighted cost of capital.
4. COMPUTATION OF COST OF SPECIFIC SOURCE OF
FINANCE.
Specific sources of finance includes:
Cost of Debt
Cost of Preference capital
Cost of Equity Capital
Cost of Retained earnings
5. COST OF DEBT
Cost of debt is the rate of interest payable on debt.
Cost of debt (i.e, debentures and long term debt) is
defined in terms of the required rate of return that the
debt, investment must yield to protect the shareholders
interest. Hence, Cost of debt is contractual interest rate,
adjusted further for the tax liability of the firm.
6. COST OF DEBT
Where , Kd = Cost of Debt, I – Interest, P = Principal
• Cost of Debt after tax:
Where , Kd = Cost of Debt, T = Tax rate, R – Rate of Interest
Kd = (1-T) R
• Cost of Debt before tax:
7. COST OF DEBT
1. Company issues 12% debentures. Its marginal tax rate is 50%.Thus
effective cost of these debentures will be as follows:
Solution:
Kd = (1-T) R
Given:
T = 50%
R = 12%
Kd = (1-T) R
Kd = (1 – 0.50) * 12%
= 0.50 * 12 / 100 = 0.06
= 0.06 * 100 = 6%
8. COST OF DEBT
When the debentures are issued at par:
Cost of debt will be calculated by the following formula:
Kd = (1-T) R
When the debentures are issued at discount:
Cost of debt will be calculated by the following formula:
𝑲𝒅 =
𝑰𝒏𝒕𝒆𝒓𝒆𝒔𝒕
𝑷𝒓𝒊𝒏𝒄𝒊𝒑𝒂𝒍
𝟏 − 𝑻 𝒐𝒓 𝑲𝒅 =
𝑰
𝑷
(𝟏 − 𝑻)
Where,
Kd = Cost of debt
I = Interest on debentures
P = Net proceeds of debentures (Face value – Discount)
T = Tax Rate
9. COST OF DEBT
When the debentures are issued at premium:
Cost of debt will be calculated by the following formula:
𝑲𝒅 =
𝑰𝒏𝒕𝒆𝒓𝒆𝒔𝒕
𝑷𝒓𝒊𝒏𝒄𝒊𝒑𝒂𝒍
𝟏 − 𝑻 𝒐𝒓 𝑲𝒅 =
𝑰
𝑷
(𝟏 − 𝑻)
Where,
Kd = Cost of debt
I = Interest on debentures
P = Total proceeds (Principal + Premium)
T = Tax Rate
10. COST OF DEBT
2. A Company issues Rs.50,000 8% debentures at
par. What is the cost of debt?
Solution:
Cost of debt before tax:
𝑲𝒅 =
𝑰𝒏𝒕𝒆𝒓𝒆𝒔𝒕
𝑷𝒓𝒊𝒏𝒄𝒊𝒑𝒂𝒍
𝒐𝒓 𝑲𝒅 =
𝑰
𝑷
𝑰𝒏𝒕𝒆𝒓𝒆𝒔𝒕 = 50,000 * 8% = 50,000 * 8/100 = 4,000
𝑲𝒅 =
𝟒𝟎𝟎𝟎
𝟓𝟎,𝟎𝟎𝟎
∗ 𝟏𝟎𝟎 = 8%
Cost of Debt = 8%
11. COST OF DEBT
3. A Company issues Rs.50,000 8% debentures at par. The tax
rate is 50%. What is the cost of debt?
Solution:
Cost of debt after tax:
Kd = (1-T) R
Kd = (1-50%) 8%
Kd = (1-0.50) 8/100
Kd = 0.50 * 8/100 = 0.04 = 0.04 *100 = 4%
Cost of Debt = 4%
12. COST OF DEBT
4. If the debentures are issued at par:
Face Value of debentures Rs. 1,000
Flotation costs 2%
Net Proceeds ?
Solution:
Net Proceeds = Face Value – Flotation Cost
= 1000 – 20 (2% of 1000 = 1000 *
2/100)
= 980
Net Proceeds = 980
13. COST OF DEBT
5. If the debentures are issued at discount:
Issue price of debentures Rs. 1,000
Flotation costs 2%
Discount is 5%
Net Proceeds ?
Solution:
Net Proceeds = Face Value – discount - Flotation Cost
= 1000 – 50 (5% of 1000) = 950 – Flotation Cost
= 950 - (2% of 950 = 950 * 2/100)
= 950 – 19
= 931
Net Proceeds = 931
14. COST OF DEBT
6.
Face Value of debentures = Rs.1,000
Premium = 10%
Flotation Cost = 2%
Net Proceeds ?
Solution:
Net Proceeds = Face Value + Premium – Cost of Flotation
= 1000 + 100 – 2% on 1100
= 1100 – 22
= 1078
Net Proceeds = 1078
15. COST OF DEBT
DEBENTURES ARE ISSUED AT PAR, AT A PREMIUM AND
DISCOUNT.
When the debentures are issued at face value, it is called
Debentures issued at par.
In such case cost of debt is calculated as follows:
𝑲𝒅 =
𝑰𝒏𝒕𝒆𝒓𝒆𝒔𝒕
𝑷𝒓𝒊𝒏𝒄𝒊𝒑𝒂𝒍
𝟏 − 𝑻 𝒐𝒓 𝑲𝒅 =
𝑰
𝑷
(𝟏 − 𝑻)
or
Kd = (1-T) R
Where,
Kd = Cost of debt
I = Interest on debentures
P = Net proceeds of debentures (Face value – Discount)
T = Tax Rate
16. 7. Company issuesRs.80,000 9% debentures at par. The tax rate
applicable to the company is 50%. Compute the cost of debt capital.
Solution:
𝑲𝒅 =
𝑰𝒏𝒕𝒆𝒓𝒆𝒔𝒕
𝑷𝒓𝒊𝒏𝒄𝒊𝒑𝒂𝒍
𝟏 − 𝑻 𝒐𝒓 𝑲𝒅 =
𝑰
𝑷
(𝟏 − 𝑻)
Kd = Cost of Debt
I = Interest = 7,200 (80,000 *9/100)
T – Tax rate = 50% = 0.50
P = Issue Price = 80,000
𝑲𝒅 =
𝑰
𝑷
𝟏 − 𝑻
𝑲𝒅 =
𝟕, 𝟐𝟎𝟎
𝟖𝟎, 𝟎𝟎𝟎
∗ 𝟏 − 𝟎. 𝟓𝟎
Kd = 0.09 * 0.50
Kd = 0.045 * 100 = 4.5%
Cost of Debt = 4.5 %
17. DEBT IS ISSUED AT A PREMIUM
When the debentures are issued more than the face value, it is called
premium.
P = Net Proceeds (i.e, issue price)
= Face Value + Premium
18. 8. VGW company issues Rs.80,000 9% debentures at a premium
of 10%. The tax rate applicable to the company is 60%. Compute
the cost of debt capital.
Solution:
Computation of cost of debt capital
𝑲𝒅 =
𝑰
𝑷
𝟏 − 𝑻
Where,
Kd = Cost of debt
I = Interest = 7200 ( 80,000 * 9/100)
T = Tax = 60% or 0.60
P = Net Proceeds (i.e, issue price) = 88,000
Face Value + Premium
80,000 + 8,000 = 88,000
𝑲𝒅 =
𝟕𝟐𝟎𝟎
𝟖𝟖, 𝟎𝟎𝟎
∗ 𝟏 − 𝟎. 𝟔𝟎
𝑲𝒅 =
𝟕𝟐𝟎𝟎
𝟖𝟖,𝟎𝟎𝟎
∗ 𝟏 − 𝟎. 𝟔𝟎
Kd = 0.081 * 0.40 = 0.0324
= 0.0324 * 100 = 3.24%
Cost of Debt = 3.24 %
19. COST OF REDEEMABLE DEBT
When the debt is issued to be redeemed after a certain period during the
life time of a firm. Such a debt issue is known as Redeemable debt.
So the cost of redeemable debt capital is calculated is as follows:
Where,
Kd = Cost of debt
R = Rate of Interest
N = Number of years to maturity
F = Face Vale or Redeemable Value
T = Tax Rate
P = Issue Price
20. CONDITIONS FOR ISSUE OF DEBENTURES
Case Conditions Repayment
1 Debentures issued at Par Repayable at Par
2 Debentures issued at Discount Repayable at Par
3 Debentures issued at Premium Repayable at Par
4 Debentures issued at Par Repayable at Premium
5 Debentures issued at Discount Repayable at Premium
21. 18. A Company issues Rs.5,00,000 10% Debentures at a discount of
5%. The cost of flotation amount of Rs.15,000. The debentures are
redeemable after 5 years. The tax rate is 50%. Compute the cost of
debt capital.
Solution:
Where,
Kd = Cost of debt
R = Rate of Interest 10% on 5,00,000 – Rs.50,000
N = Number of years to maturity = 5 Years
F = Face Vale or Redeemable Value = Rs.5,00,000
T = Tax Rate = 50% = 0.50
P = Issue Price
= Face Value – Discount – Flotation Cost
= 5,00,000 – 25,000 (5% on 5,00,000) – 15,000
= 4,60,000
23. 19. Company issues debentures of Rs.2,00,000 and realises
Rs.1,96,000 after allowing 2% commission to brokers. The
debentures carry on interest rate of 10%. The debentures
are due for maturity at the end of the 10th year. You are
required to calculate the effective cost of debt capital
after tax. If the tax is 55%.
24. 20. Pooja company issued 15000 10 years 8% debentures of Rs.100 each at 4% discount. Under the
terms of debenture trust.. These debentures are to be redeemed after 10 years at 5% premium.
The cost (i.e, cost of floatation) of issue is 2%. Calculate the cost of debt of capital presuming a tax
of 50%.
Solution:
Where,
Kd = Cost of debt
R = Rate of Interest 8% on 15,00,000 – Rs.1,20,000
N = Number of years to maturity = 10Years
F = Face Vale or Redeemable Value = Issue value + Premium
= Rs.15,00,000 + 5% of 15,00,000
= Rs. 15,00,000 + 75,000
= Rs. 15,75,000
T = Tax Rate = 50% = 0.50
P = Issue Price
= Face Value – Discount – Flotation Cost
= 15,00,000 – 60,000 (4% on 15,00,000) – 28,800 (2% of 14,40,000)
= 14,40,000 – 28,800
= 14,11,200
26. 21. A 5 years of Rs.100 debentures of a firm can be sold for a Net price of Rs.96.50. The
coupon rate of interest is 14% p.a. and the debenture will be redeemable at 5%
premium on maturity. The firms tax rate is 40%. Compute cost of debt before and
after tax.
Solution:
Where,
Kd = Cost of debt
R = Rate of Interest 14% = 14/100 * 100 = 14
N = Number of years to maturity = 5 Years
F = Face Vale or Redeemable Value = Issue value + Premium
= Rs.100 + 5% of 100
= Rs. 100 + 5
= Rs. 105
T = Tax Rate = 40% = 0.40
P = Net Proceeds = 96.50
27. 𝑲𝒅 =
𝟏 − 𝑻 𝑹 +
𝟏
𝑵 (𝑭 − 𝑷)
𝑰
𝟐
(𝑭 + 𝑷)
𝑲𝒅 =
𝟏𝟒 +
𝟏
𝟓
(𝟏𝟎𝟓 − 𝟗𝟔. 𝟓𝟎)
𝑰
𝟐 (𝟏𝟎𝟓 − 𝟗𝟔. 𝟓𝟎)
𝑲𝒅 =
𝟏𝟓.𝟕
𝟏𝟎𝟎.𝟐𝟓
𝑲𝒅 = 𝟎. 𝟏𝟓𝟔 ∗ 𝟏𝟎𝟎
Kd = 15.66%
Cost of Debt before tax
𝑲𝒅 =
𝑹 +
𝟏
𝑵 (𝑭 − 𝑷)
𝑰
𝟐
(𝑭 + 𝑷)
Where,
Kd = Cost of debt
R = Rate of Interest = 14
N = 5 Years
F = Rs. 105
T = Tax Rate = 40% = 0.40
P = Net Proceeds = 96.50
28. 𝑲𝒅 =
𝟏 − 𝟎. 𝟒𝟎 𝟏𝟒 +
𝟏
𝟓
(𝟏𝟎𝟓 − 𝟗𝟔. 𝟓𝟎)
𝑰
𝟐
(𝟏𝟎𝟓 + 𝟗𝟔. 𝟓𝟎)
𝑲𝒅 =
𝟎. 𝟔𝟎 ∗ 𝟏𝟓. 𝟕
𝟏𝟎𝟎. 𝟕𝟓
𝑲𝒅 = 𝟎. 𝟎𝟗𝟑𝟒 ∗ 𝟏𝟎𝟎
Kd = 9.34%
Cost of Debt after tax
Where,
Kd = Cost of debt
R = Rate of Interest = 14
N = 5 Years
F = Rs. 105
T = Tax Rate = 40% = 0.40
P = Net Proceeds = 96.50
𝑲𝒅 =
𝟏 − 𝑻 𝑹 +
𝟏
𝑵
(𝑭 − 𝑷)
𝑰
𝟐
(𝑭 + 𝑷)