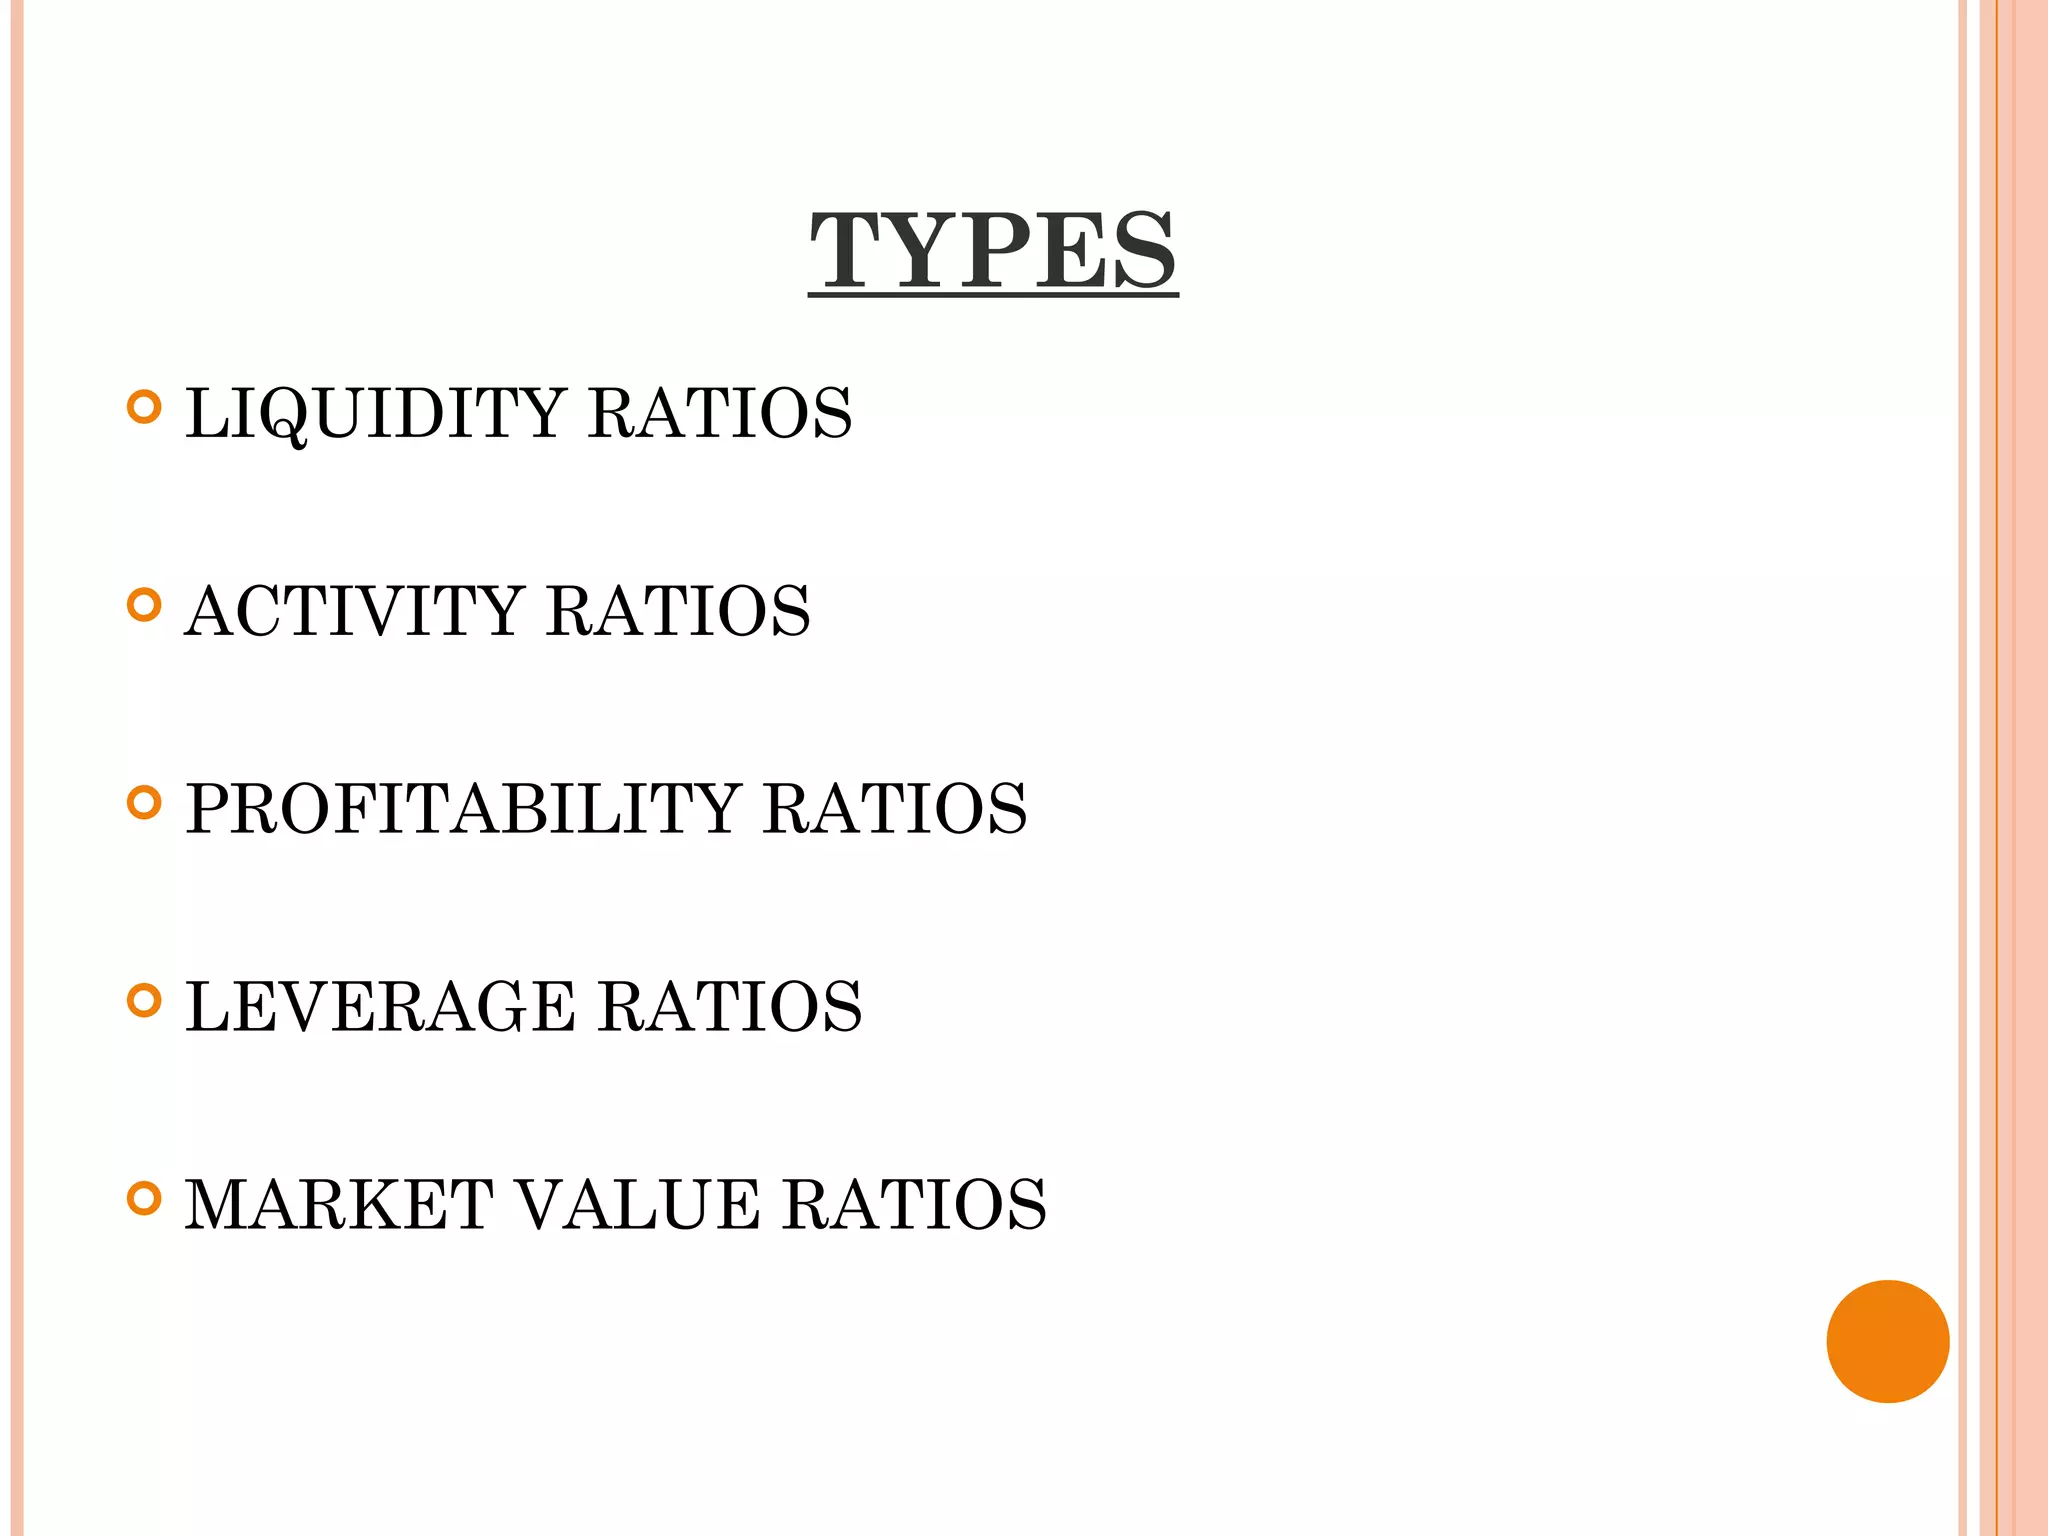
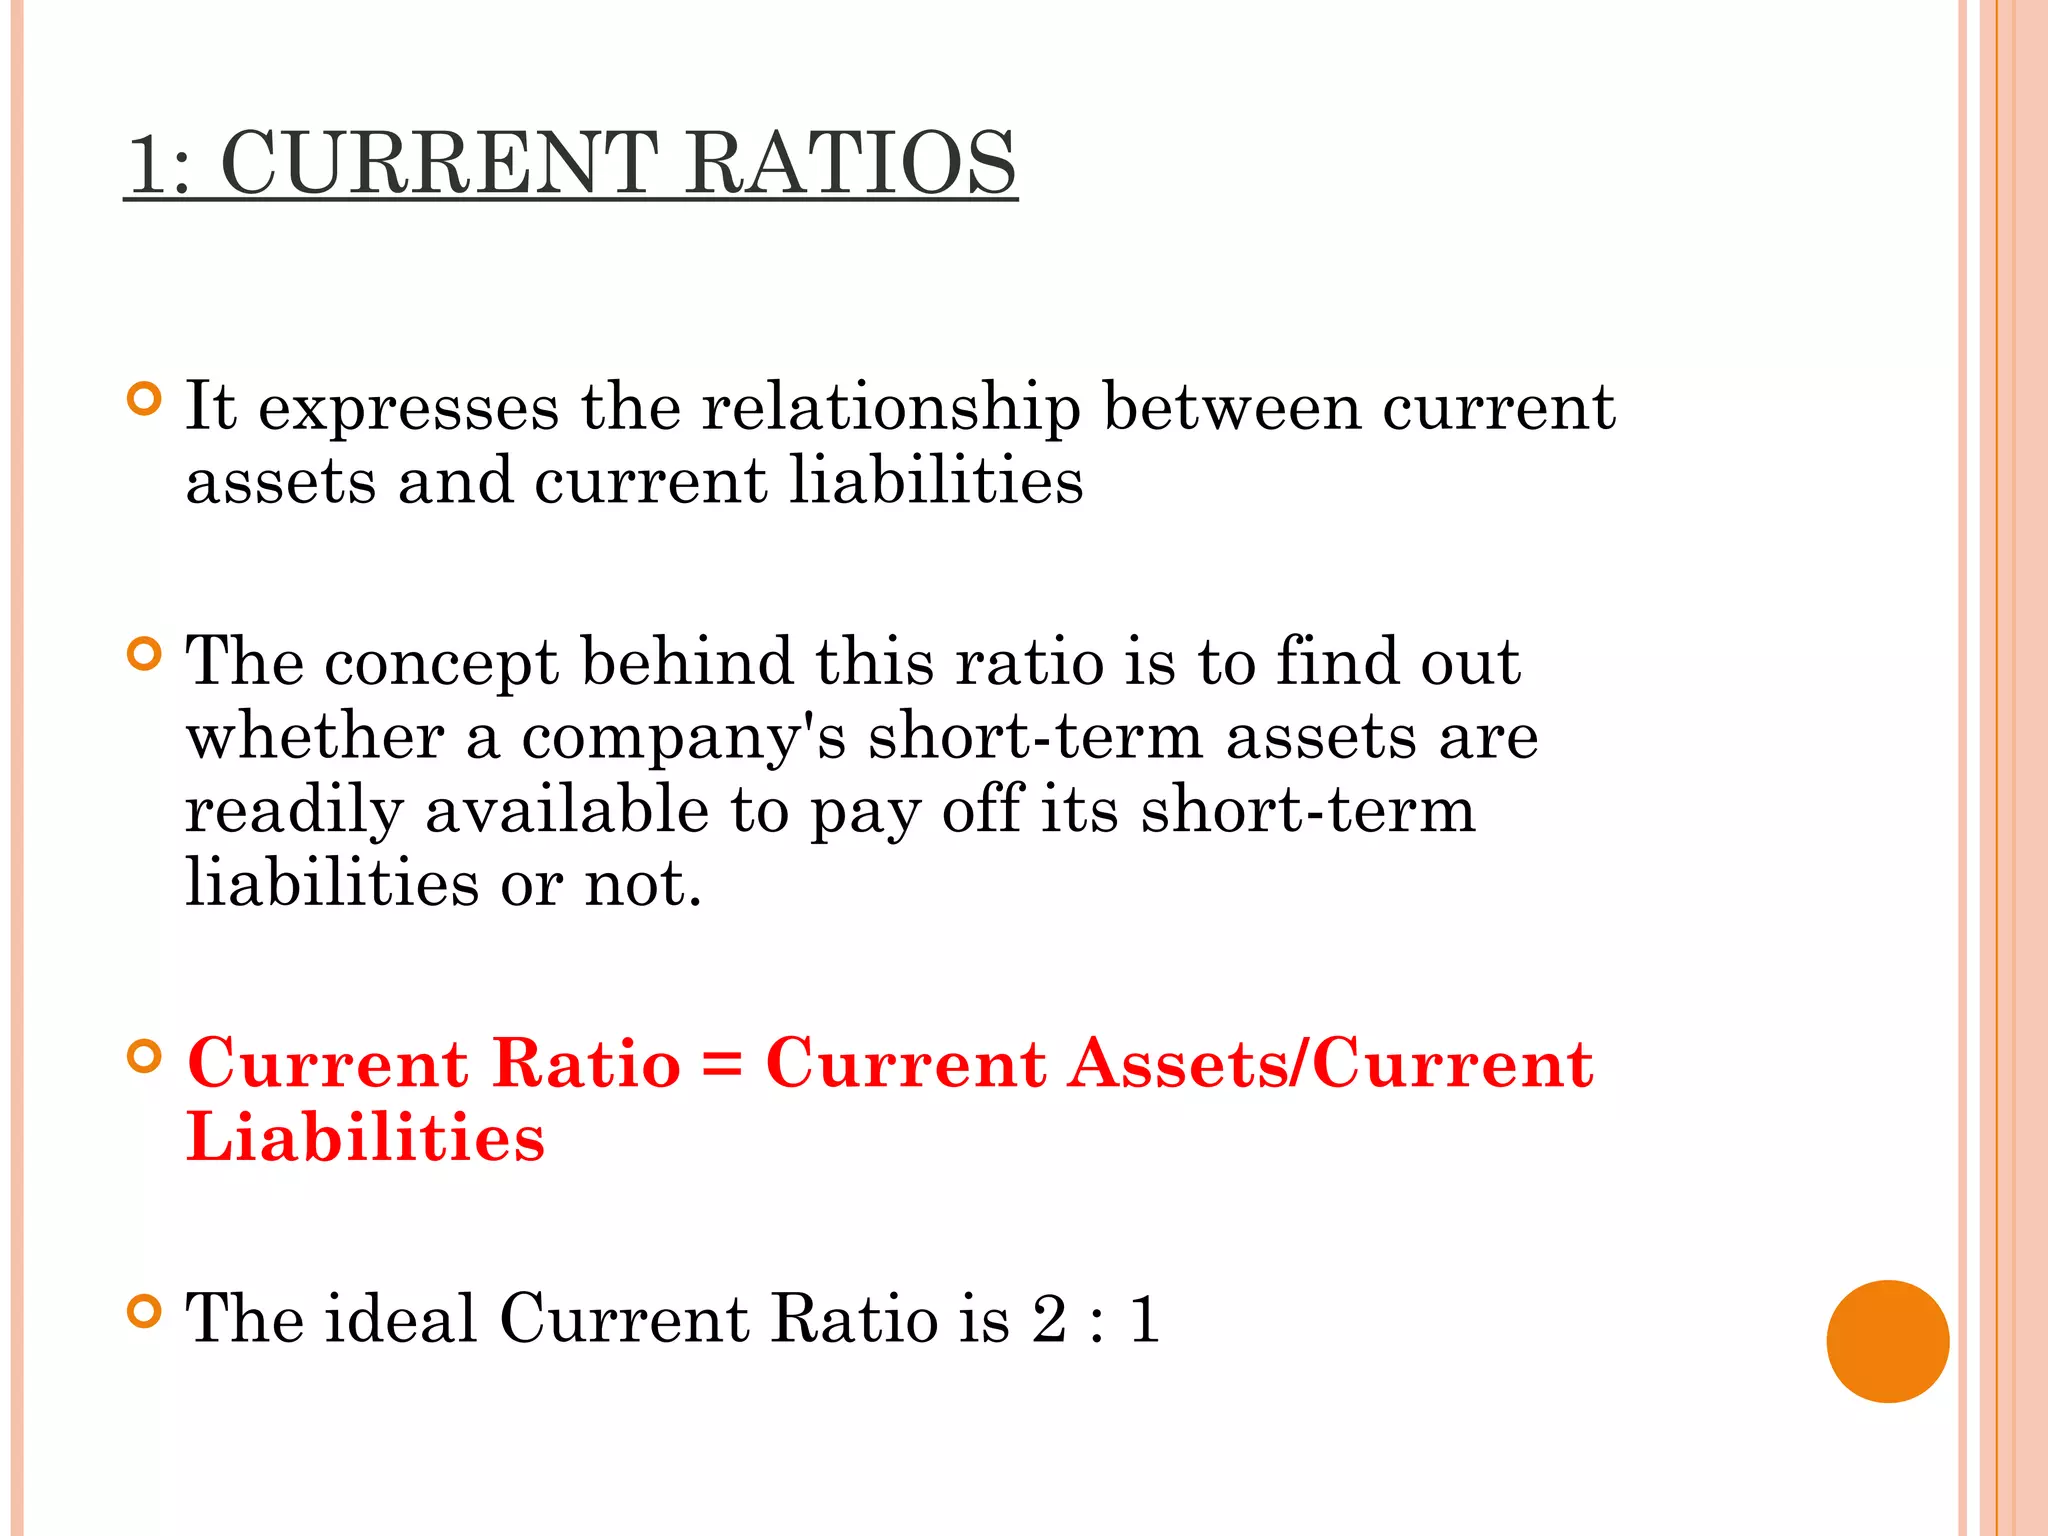
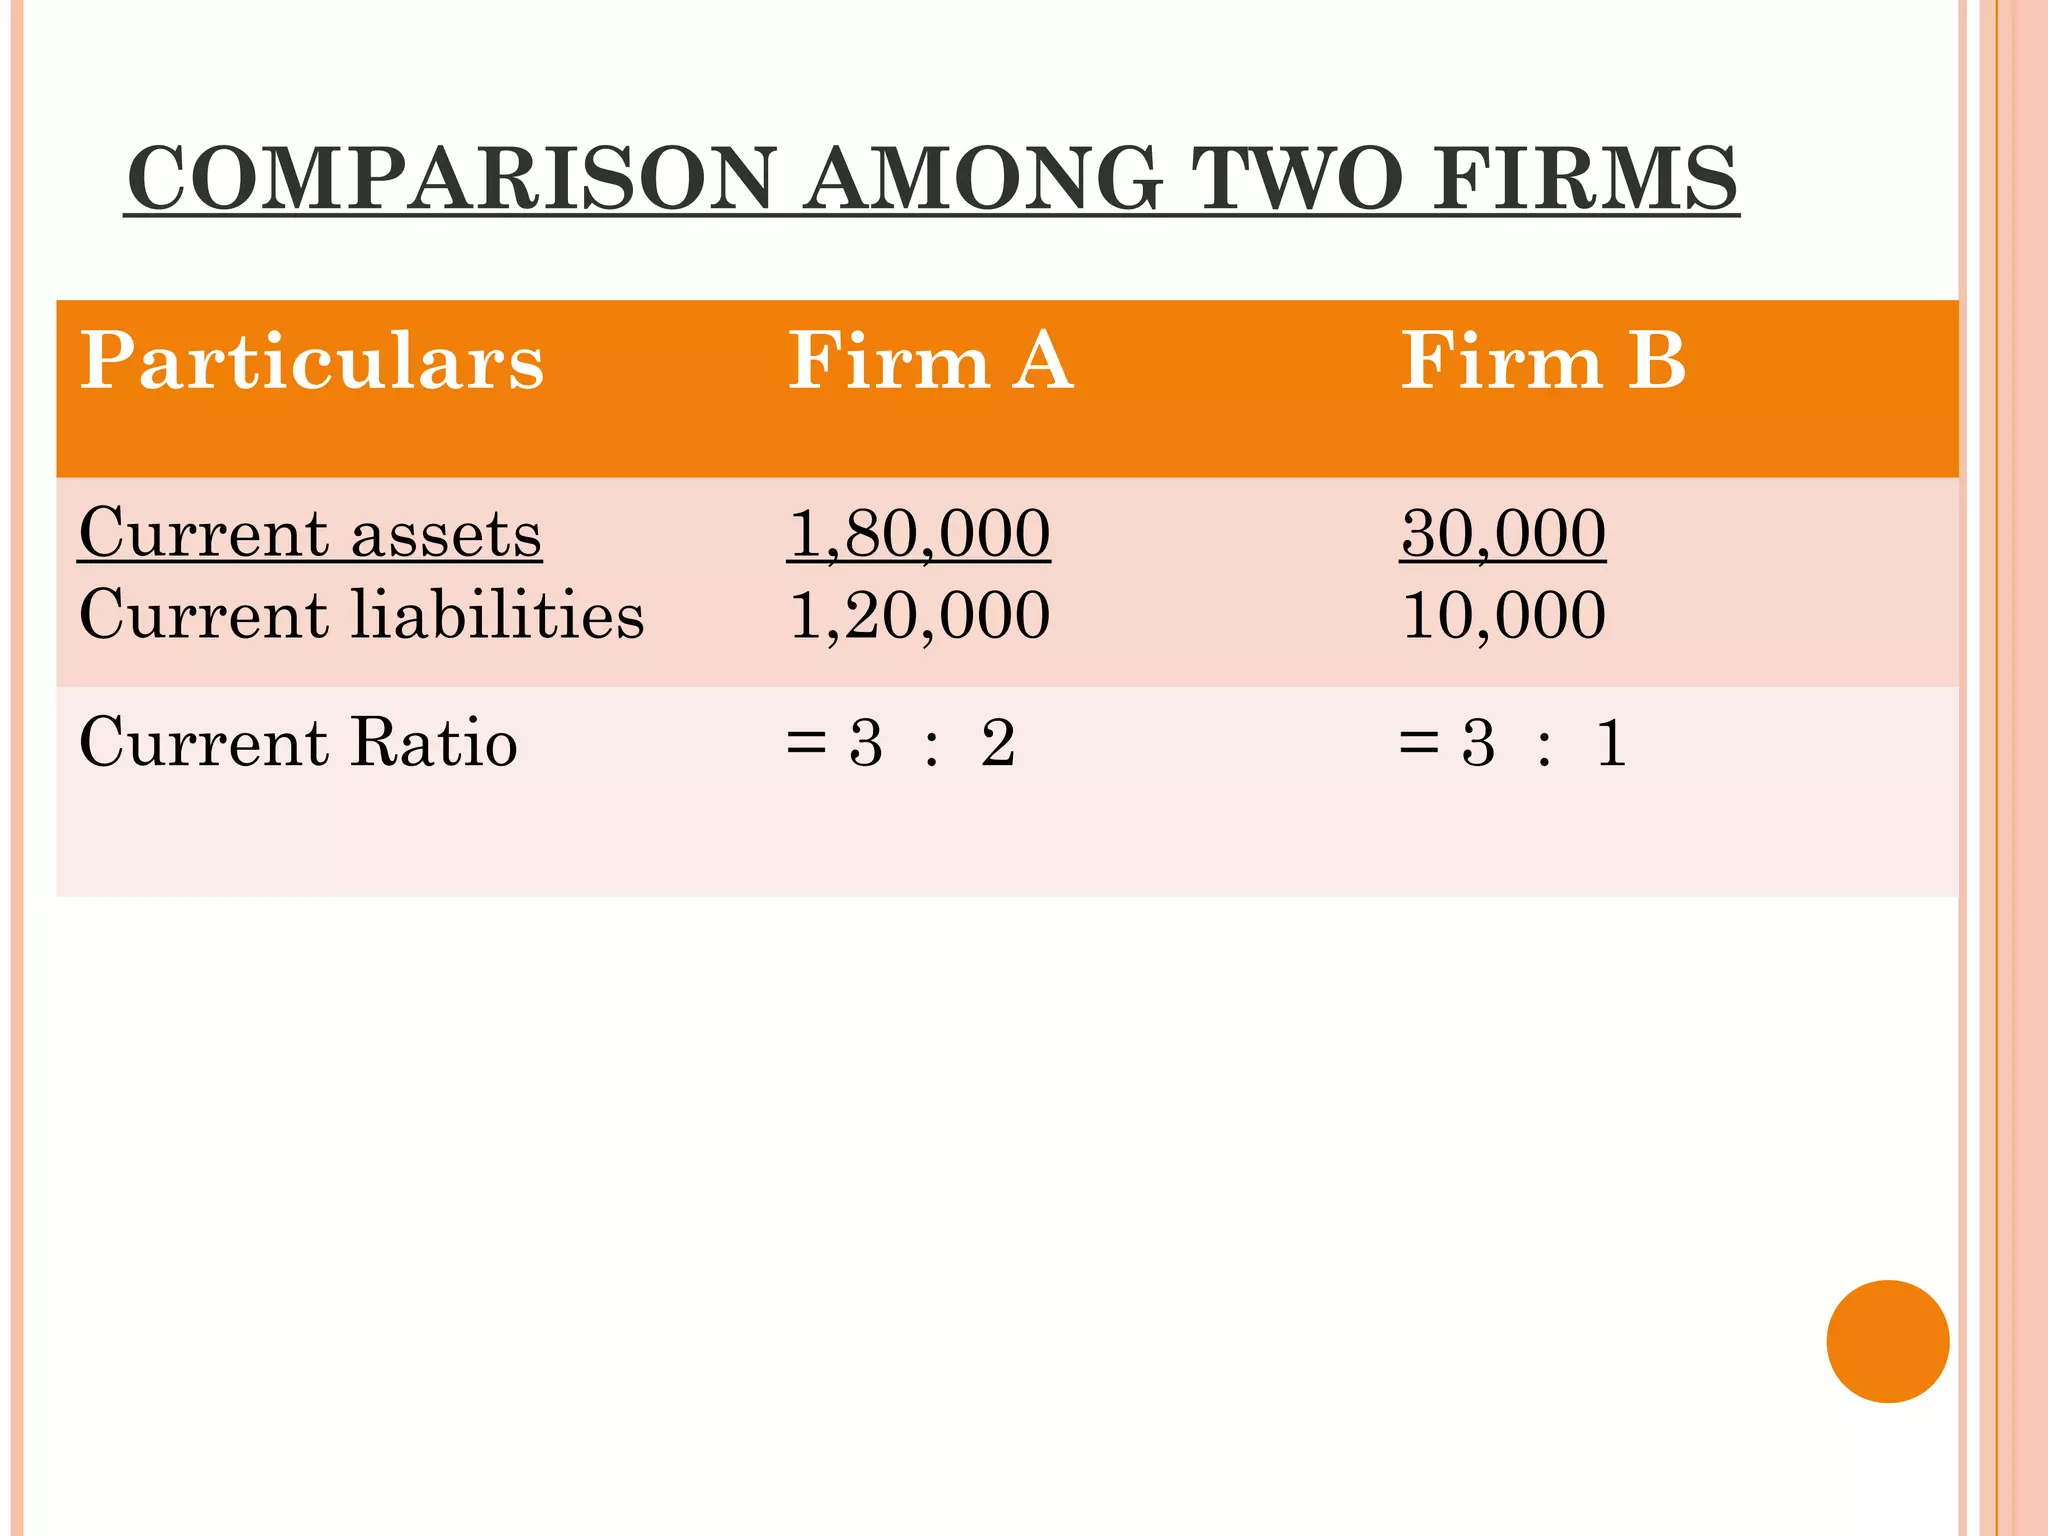
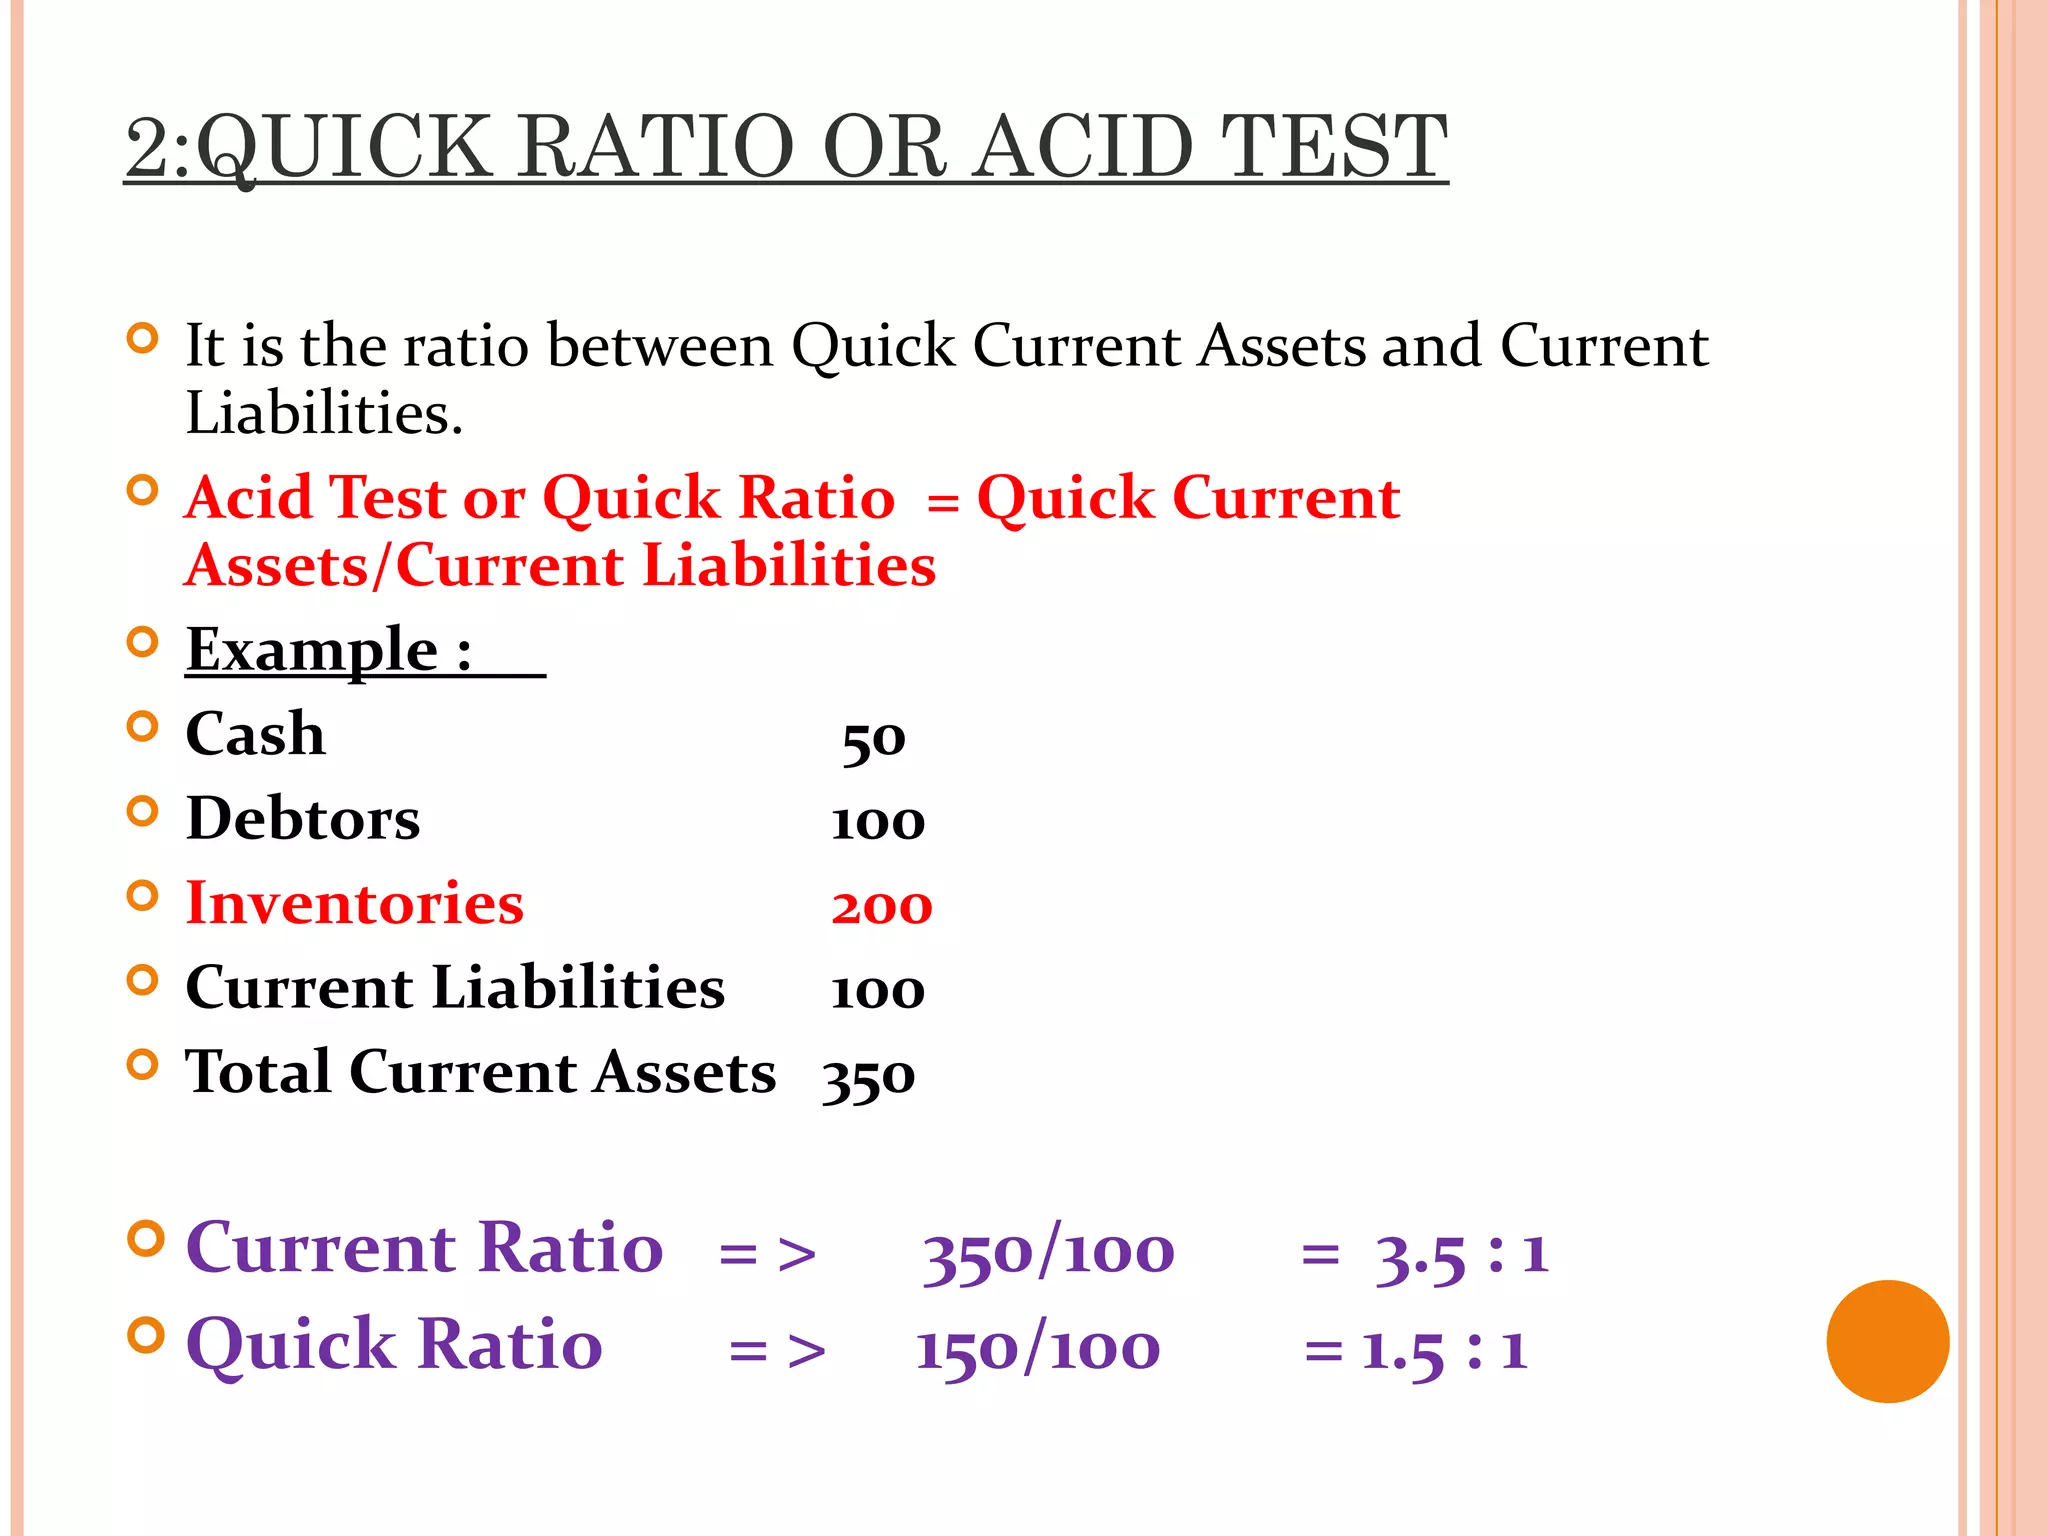
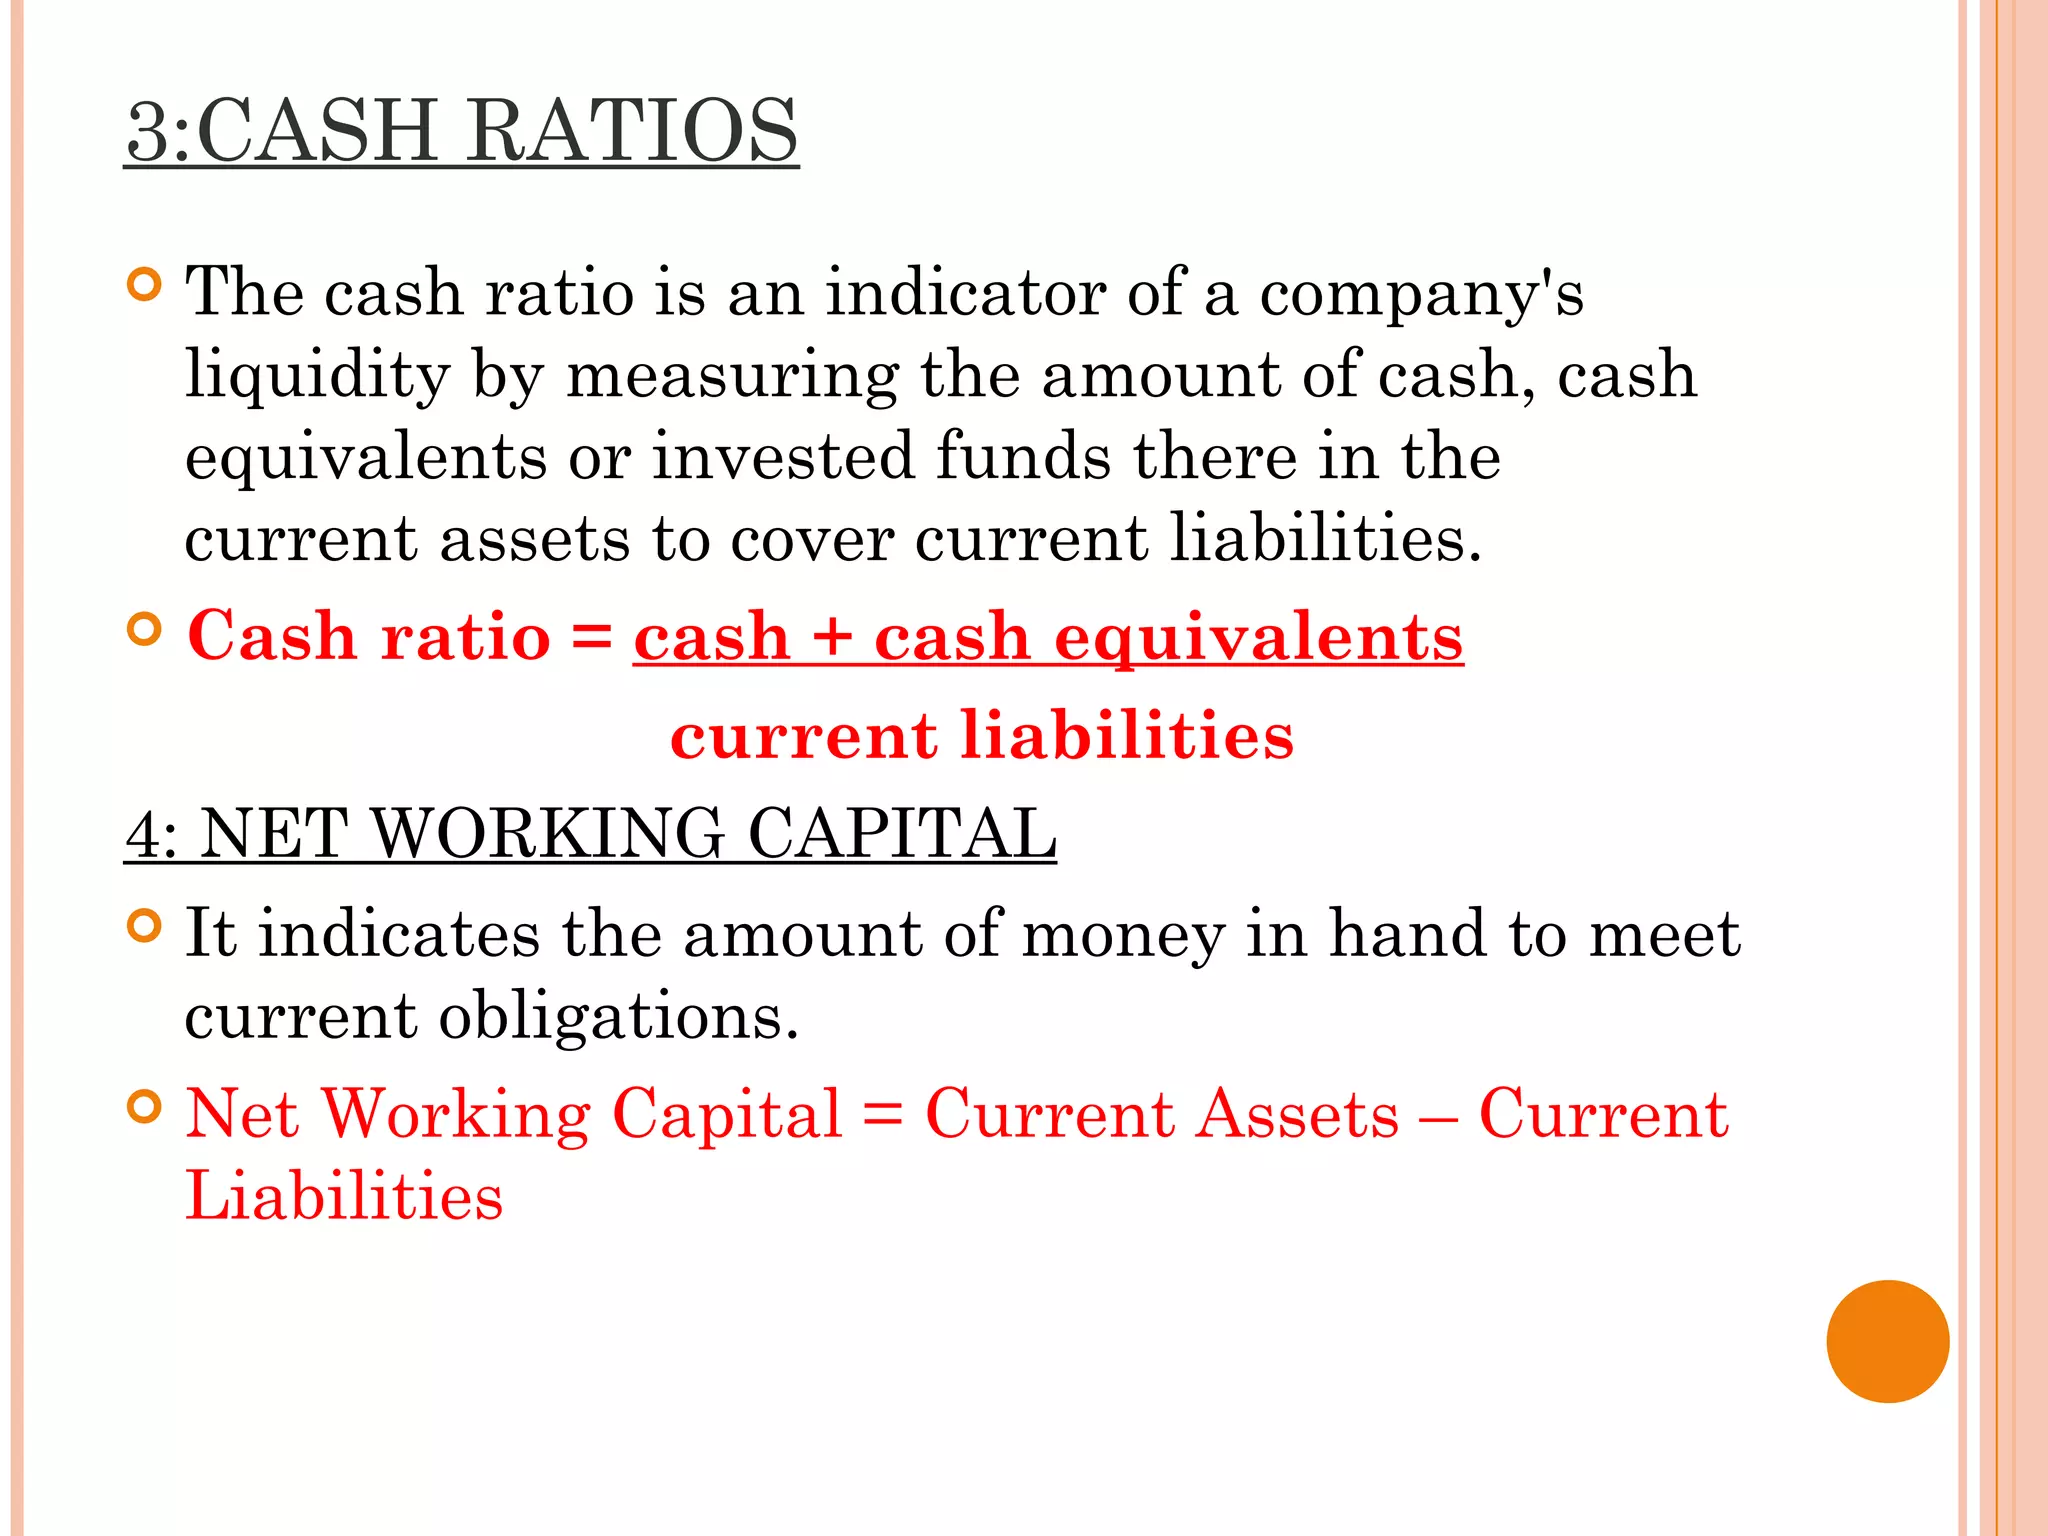
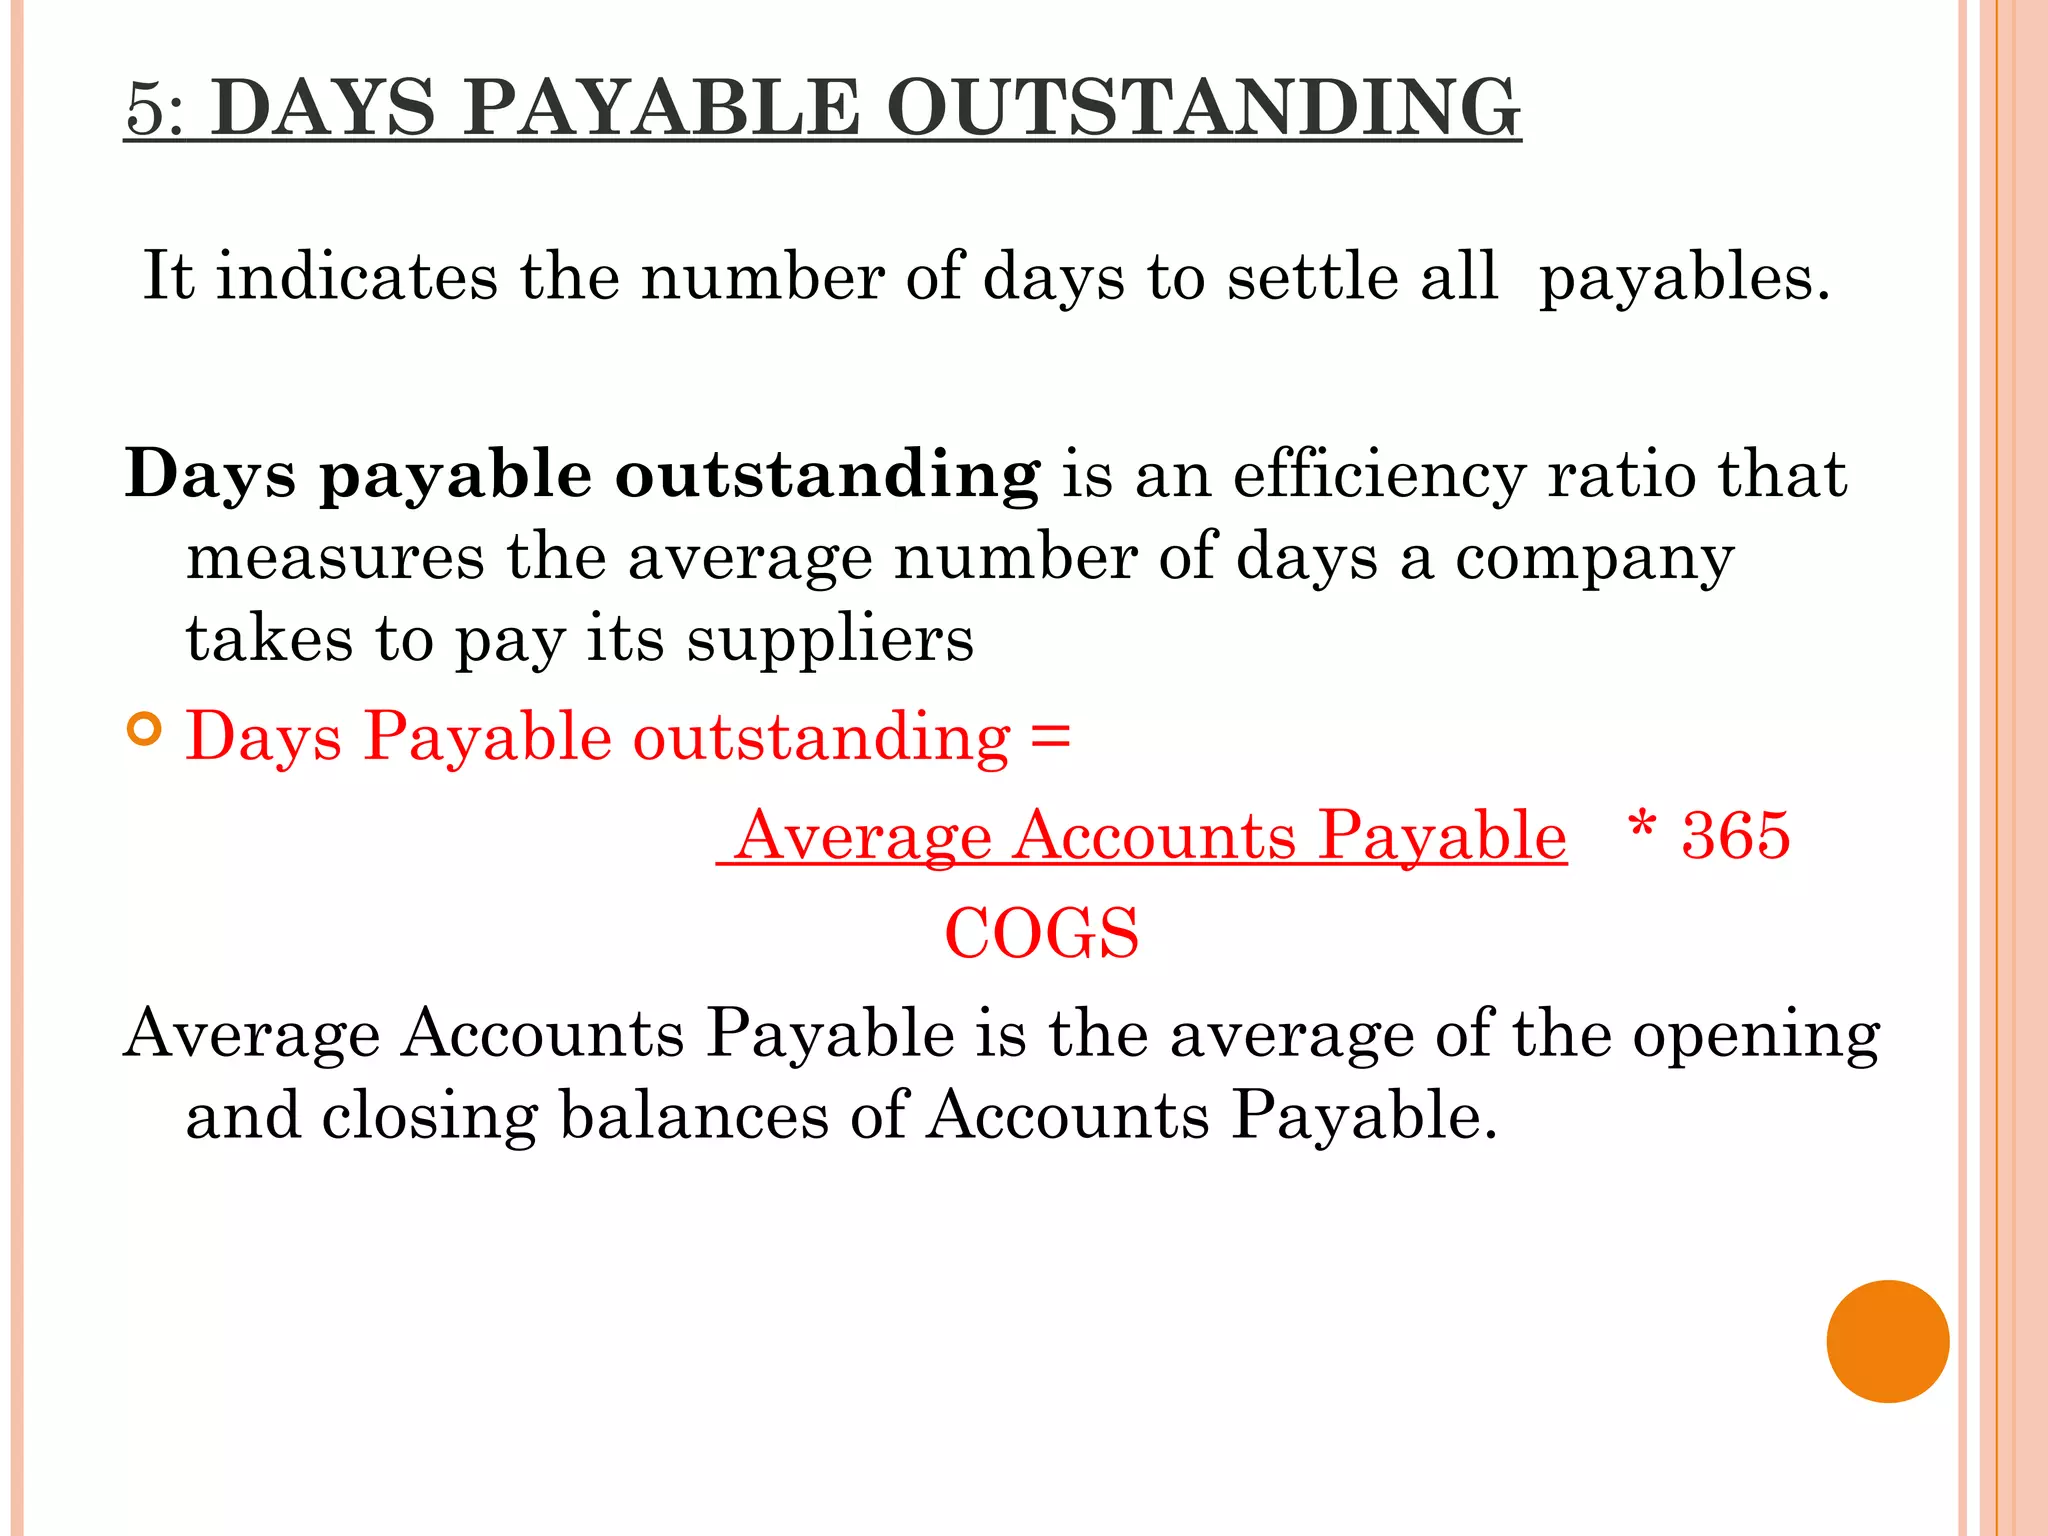
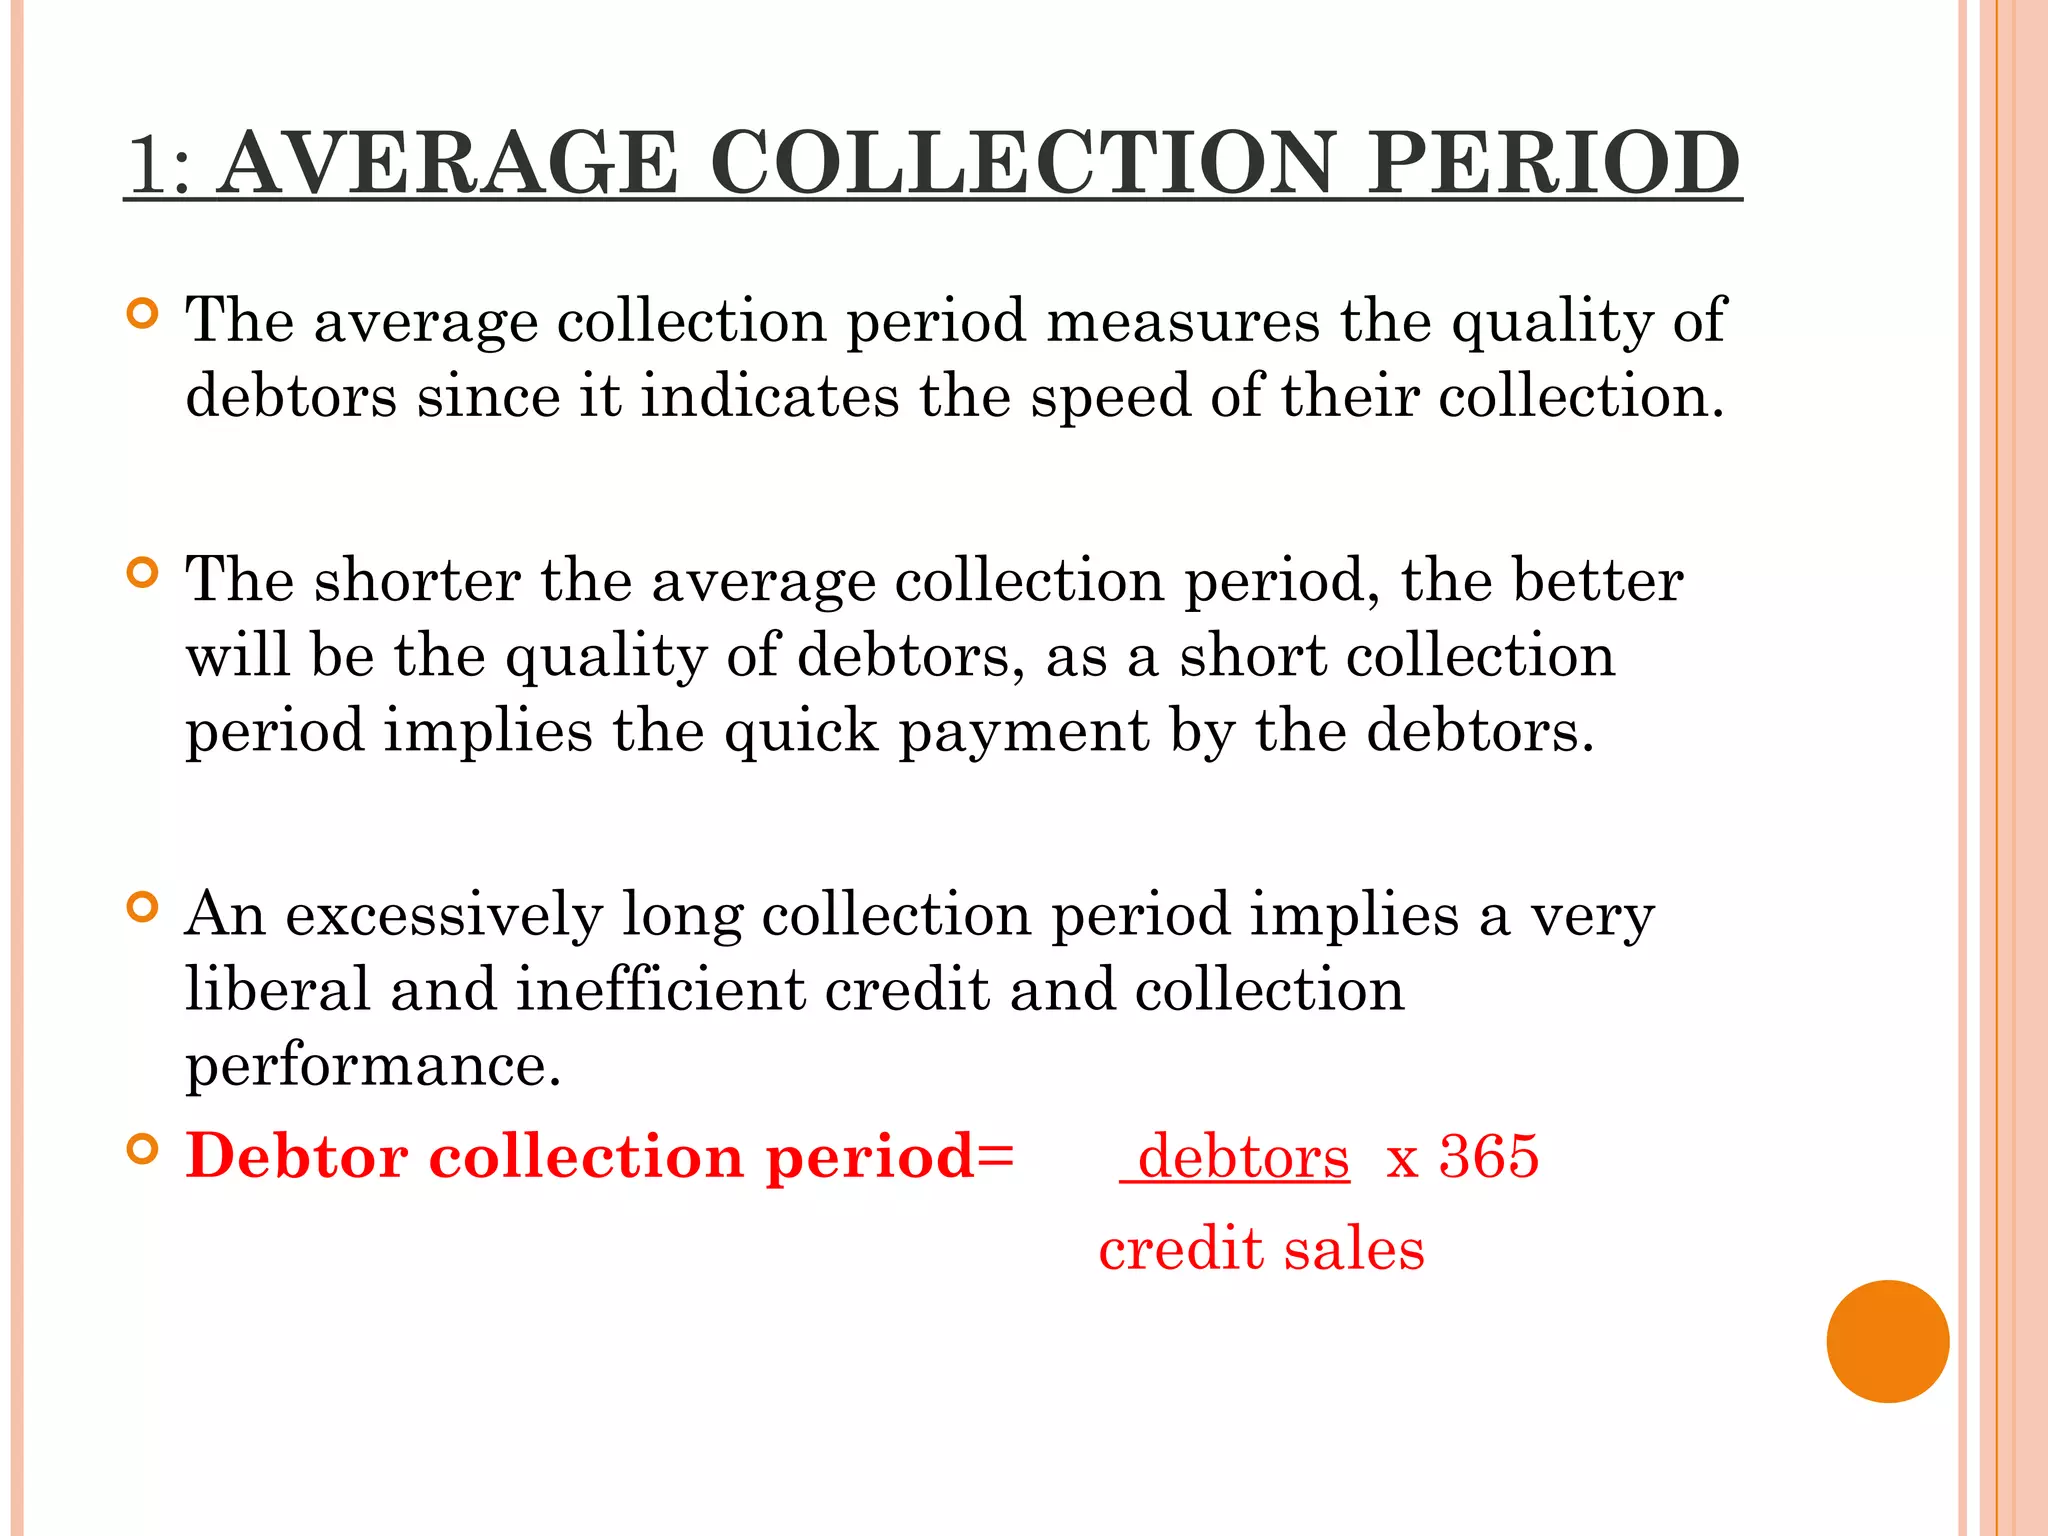
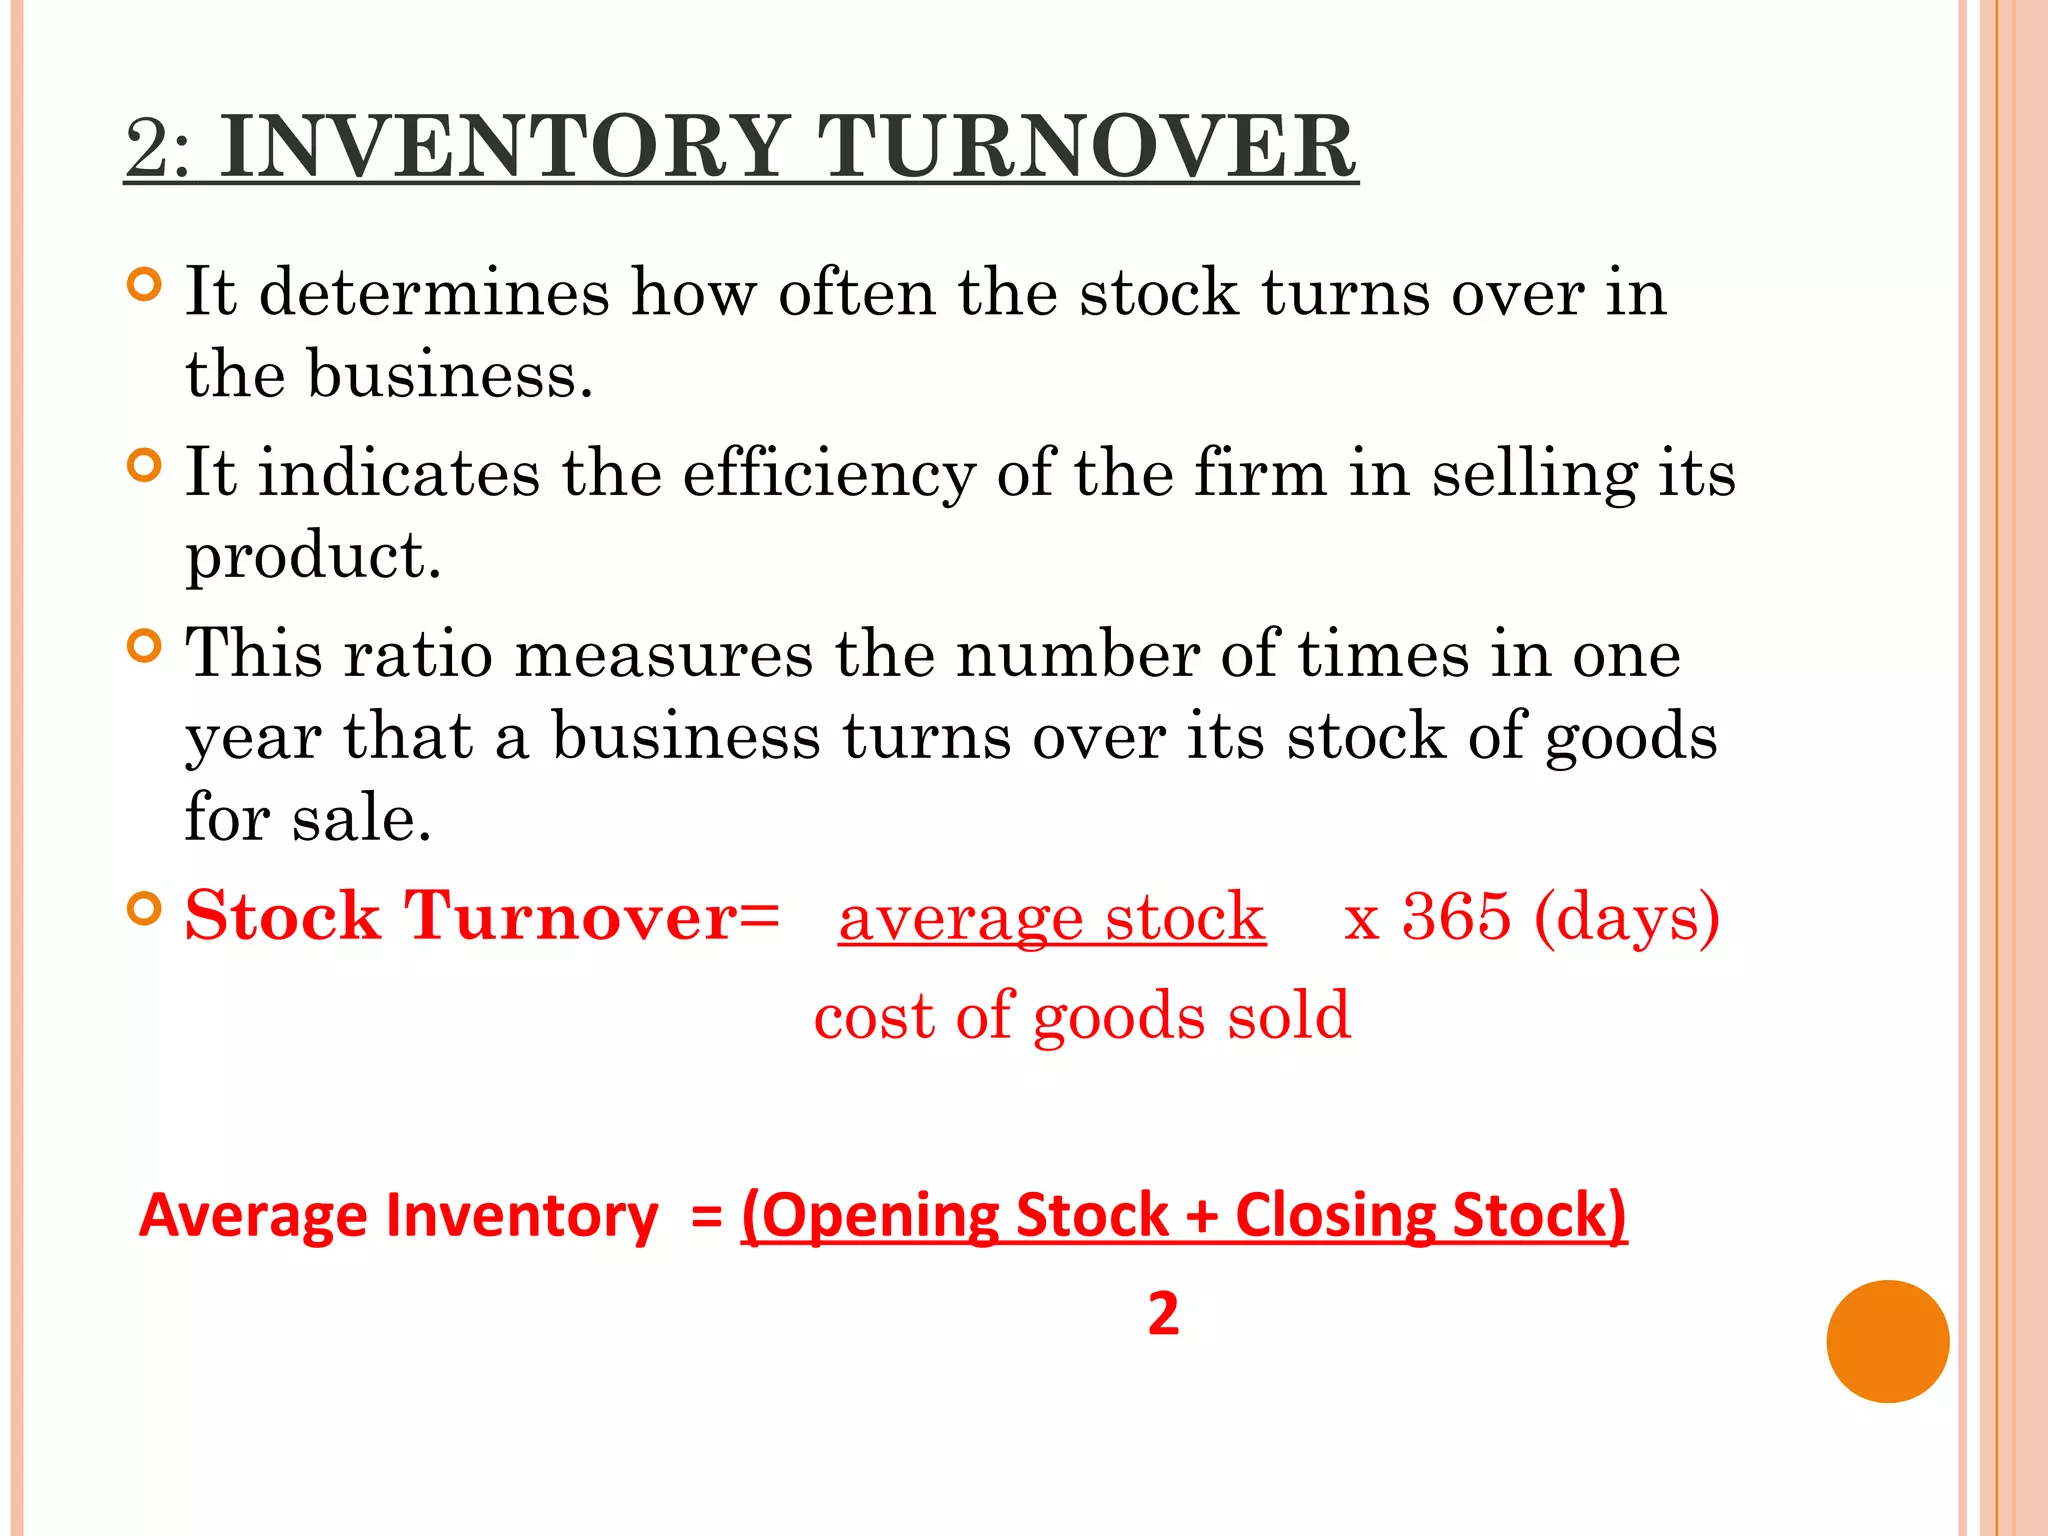
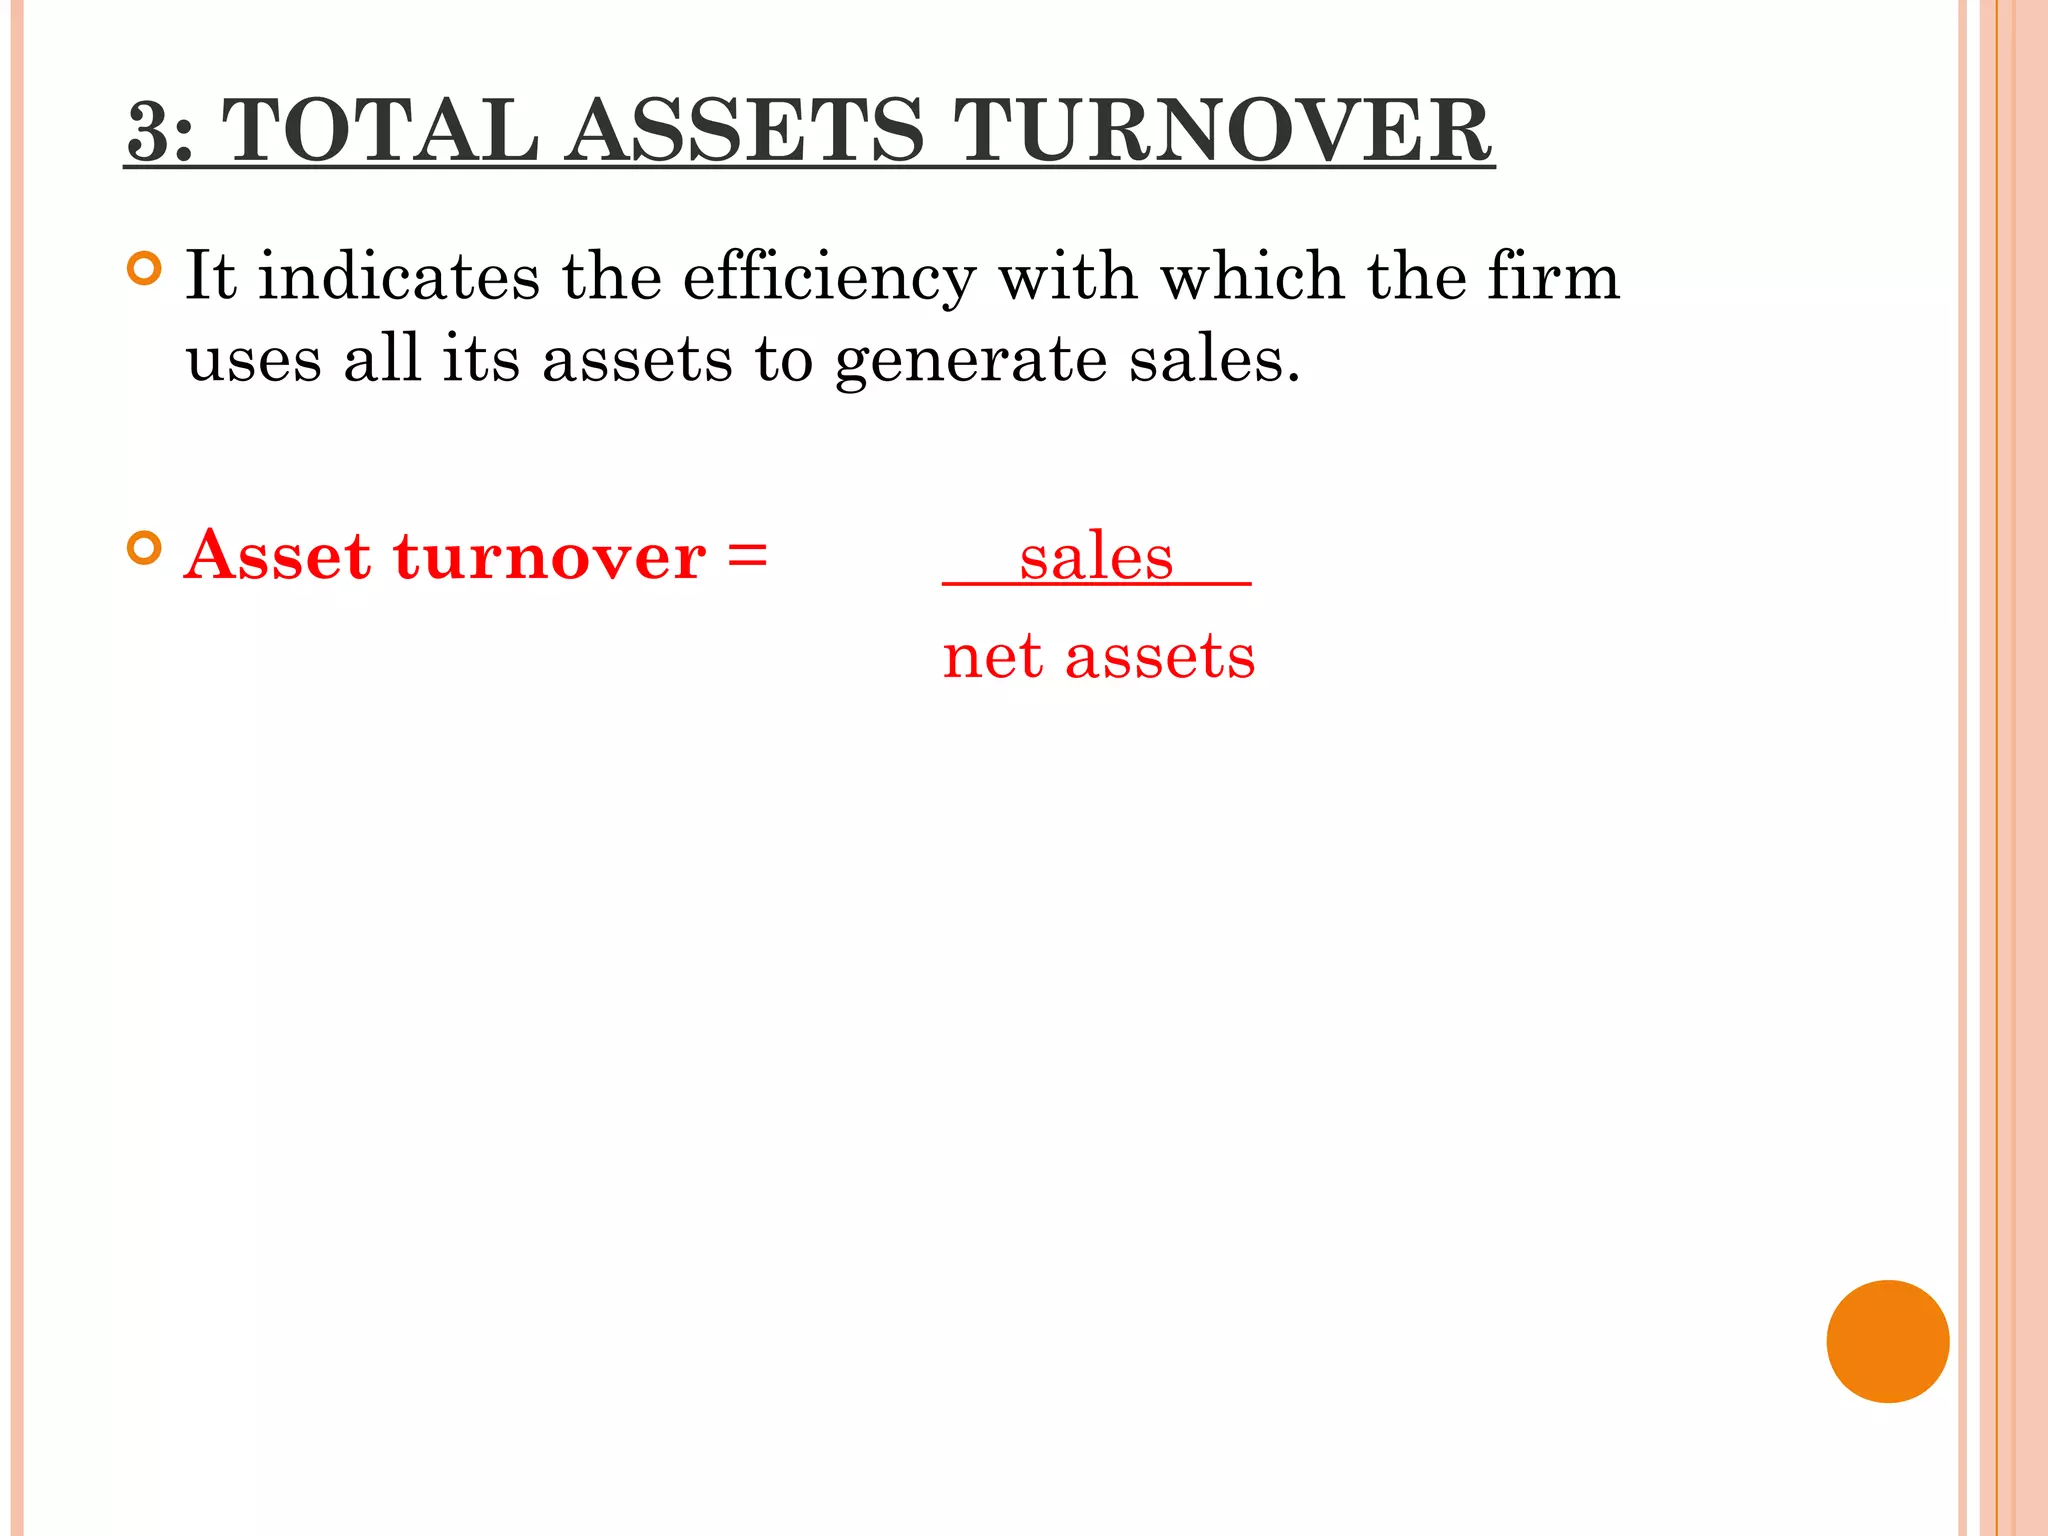
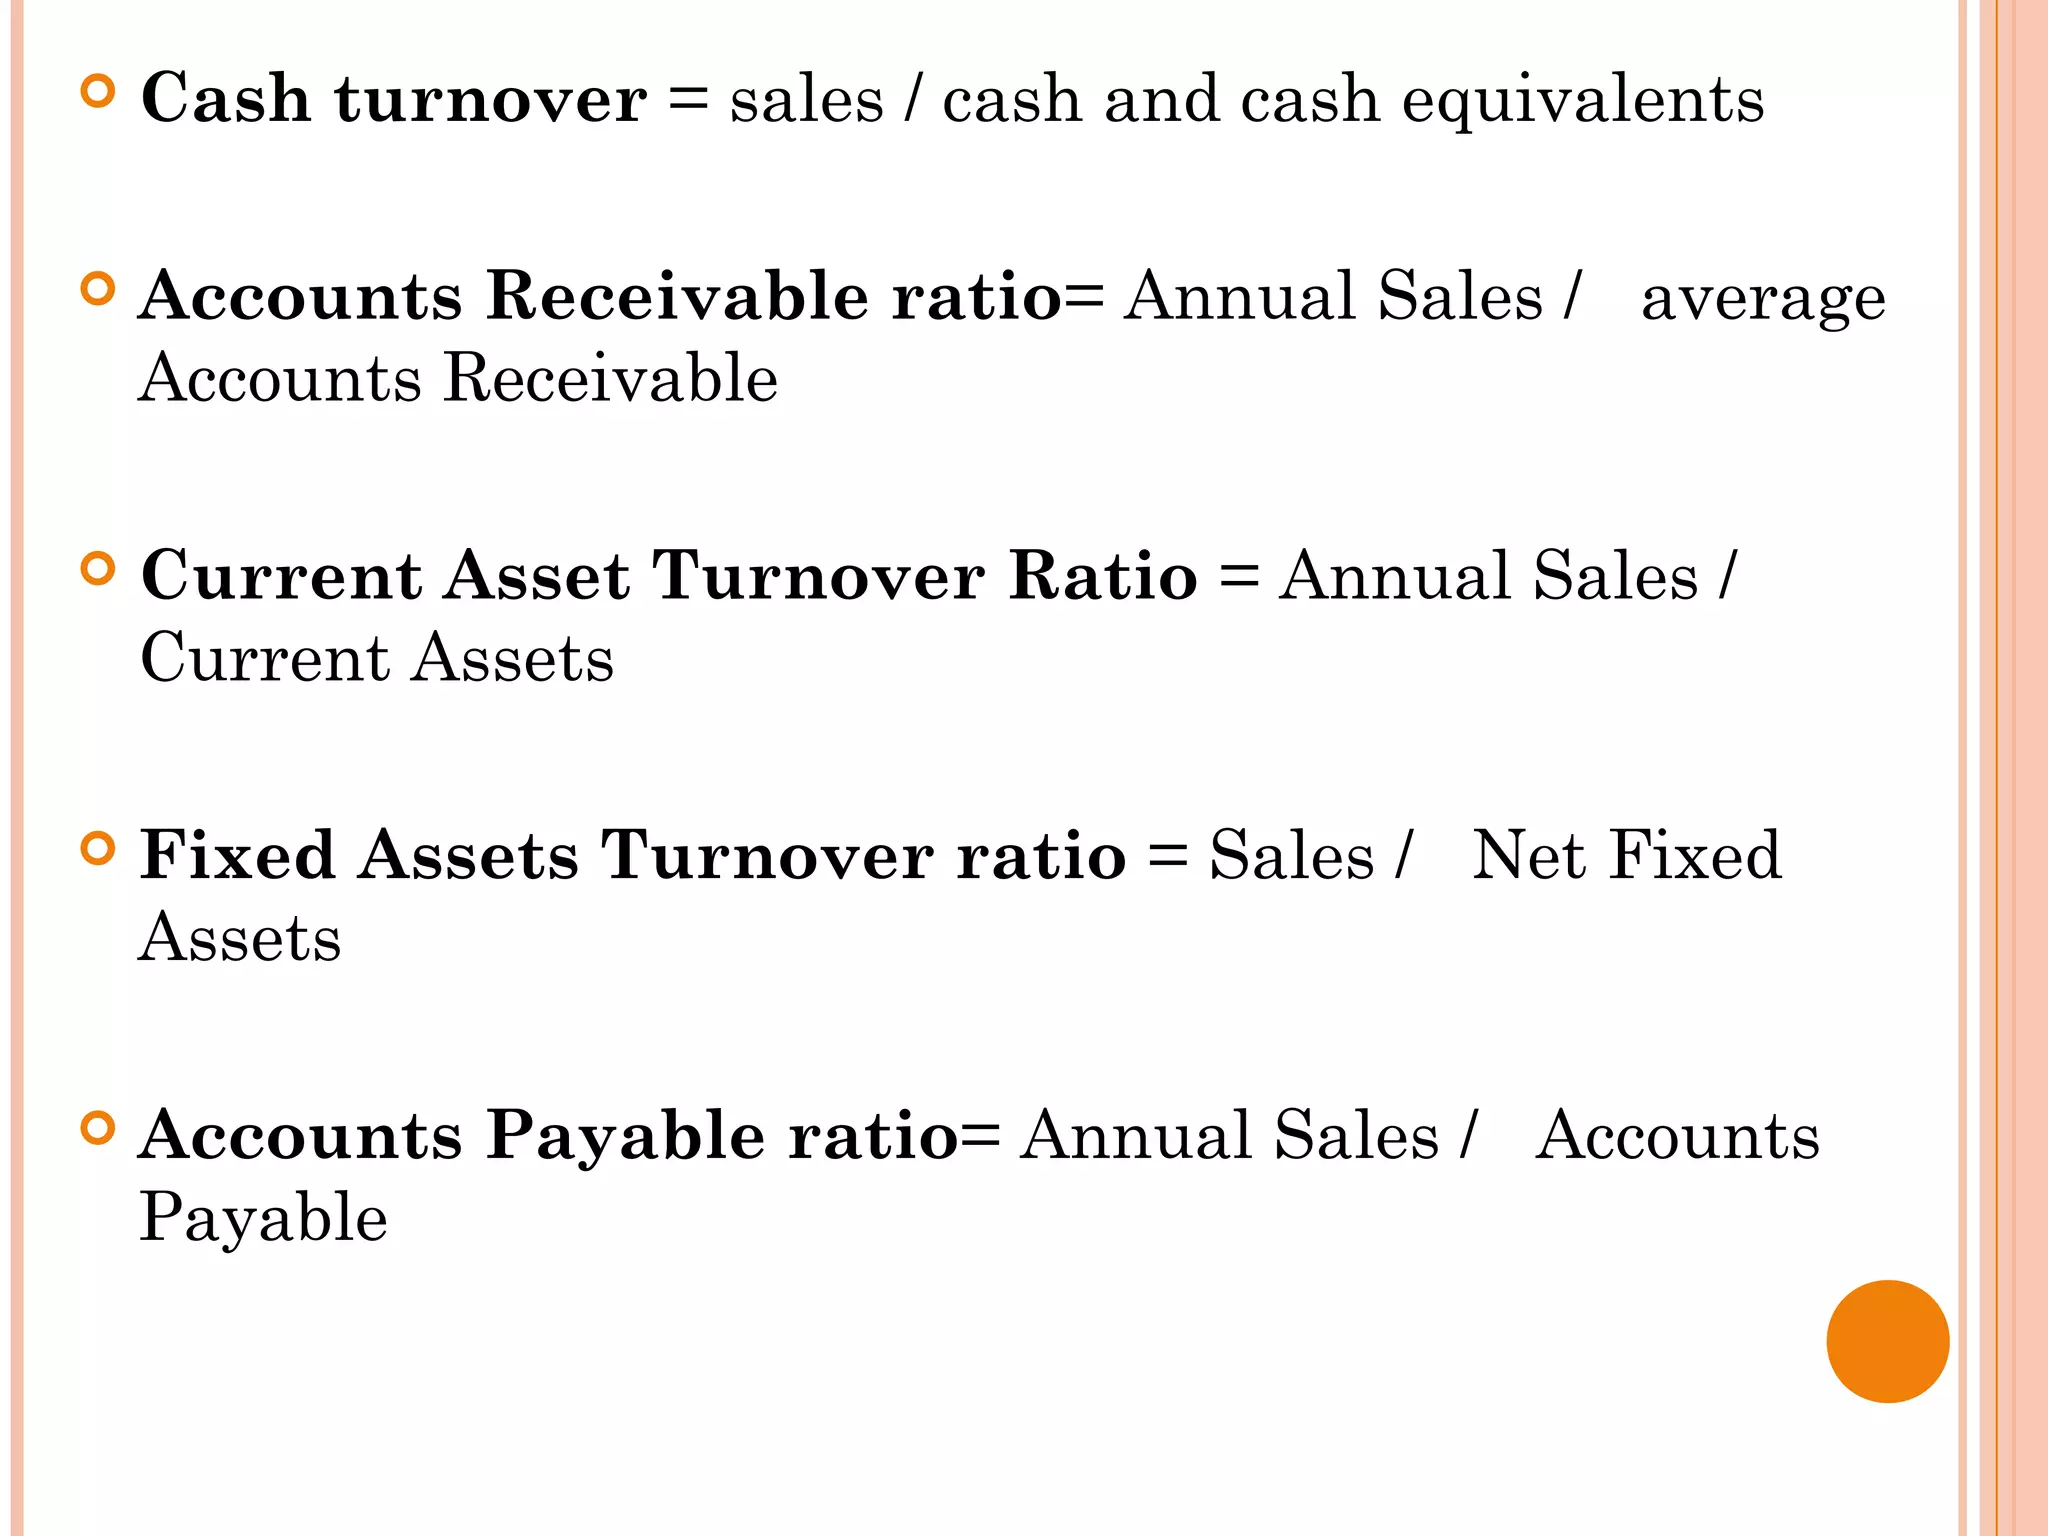
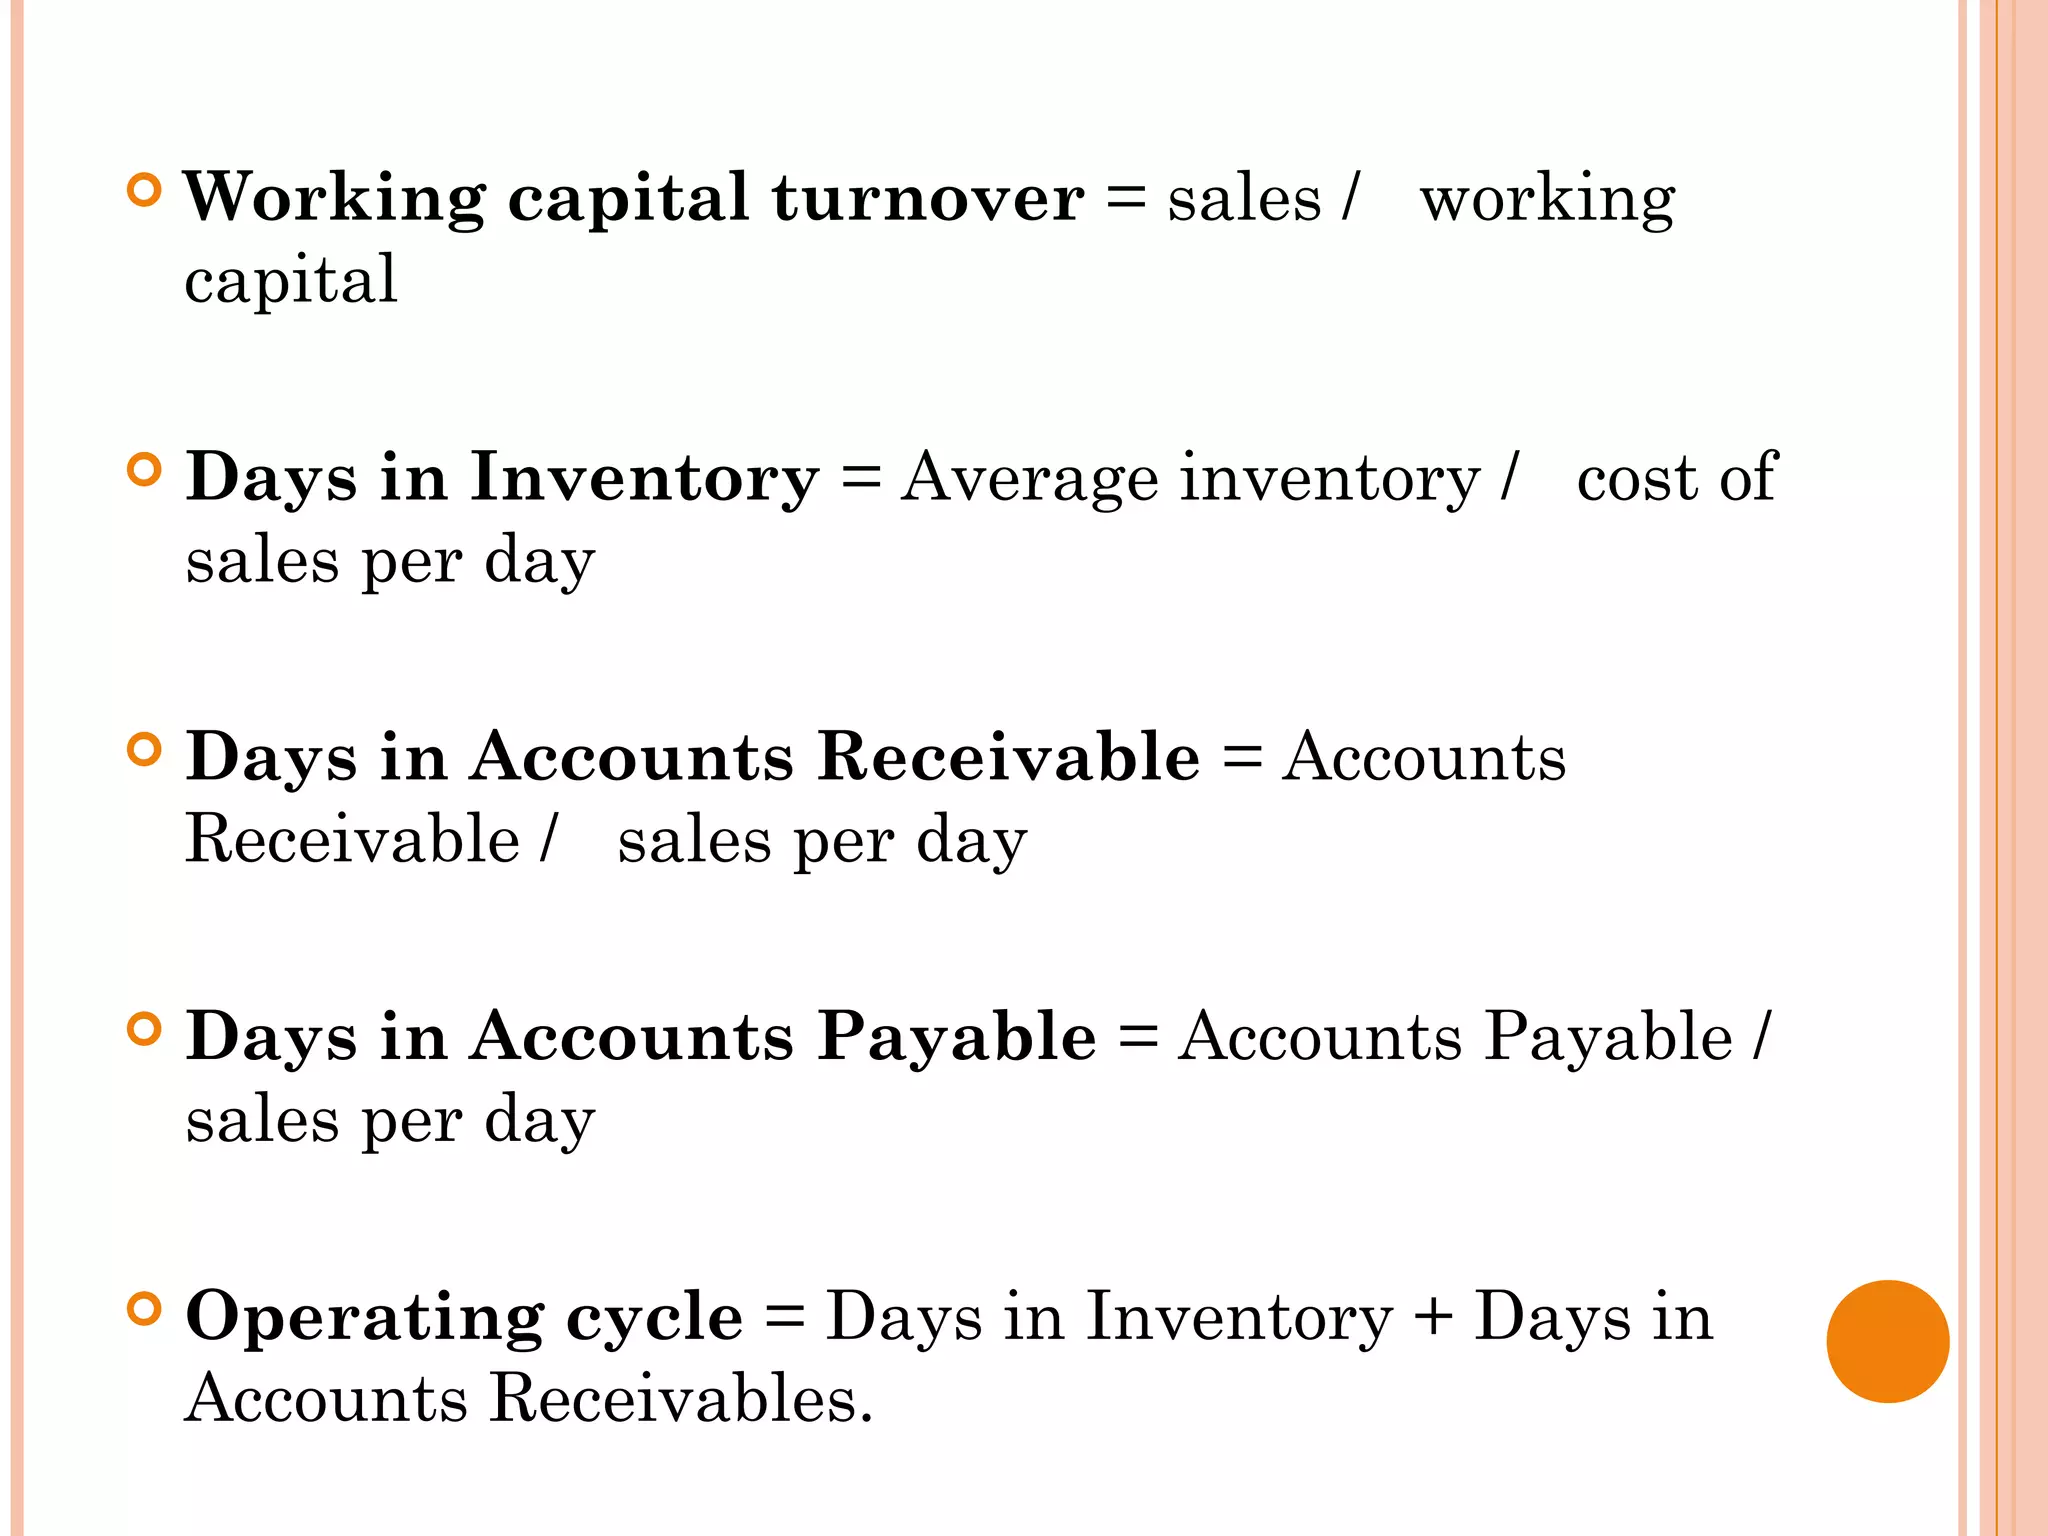
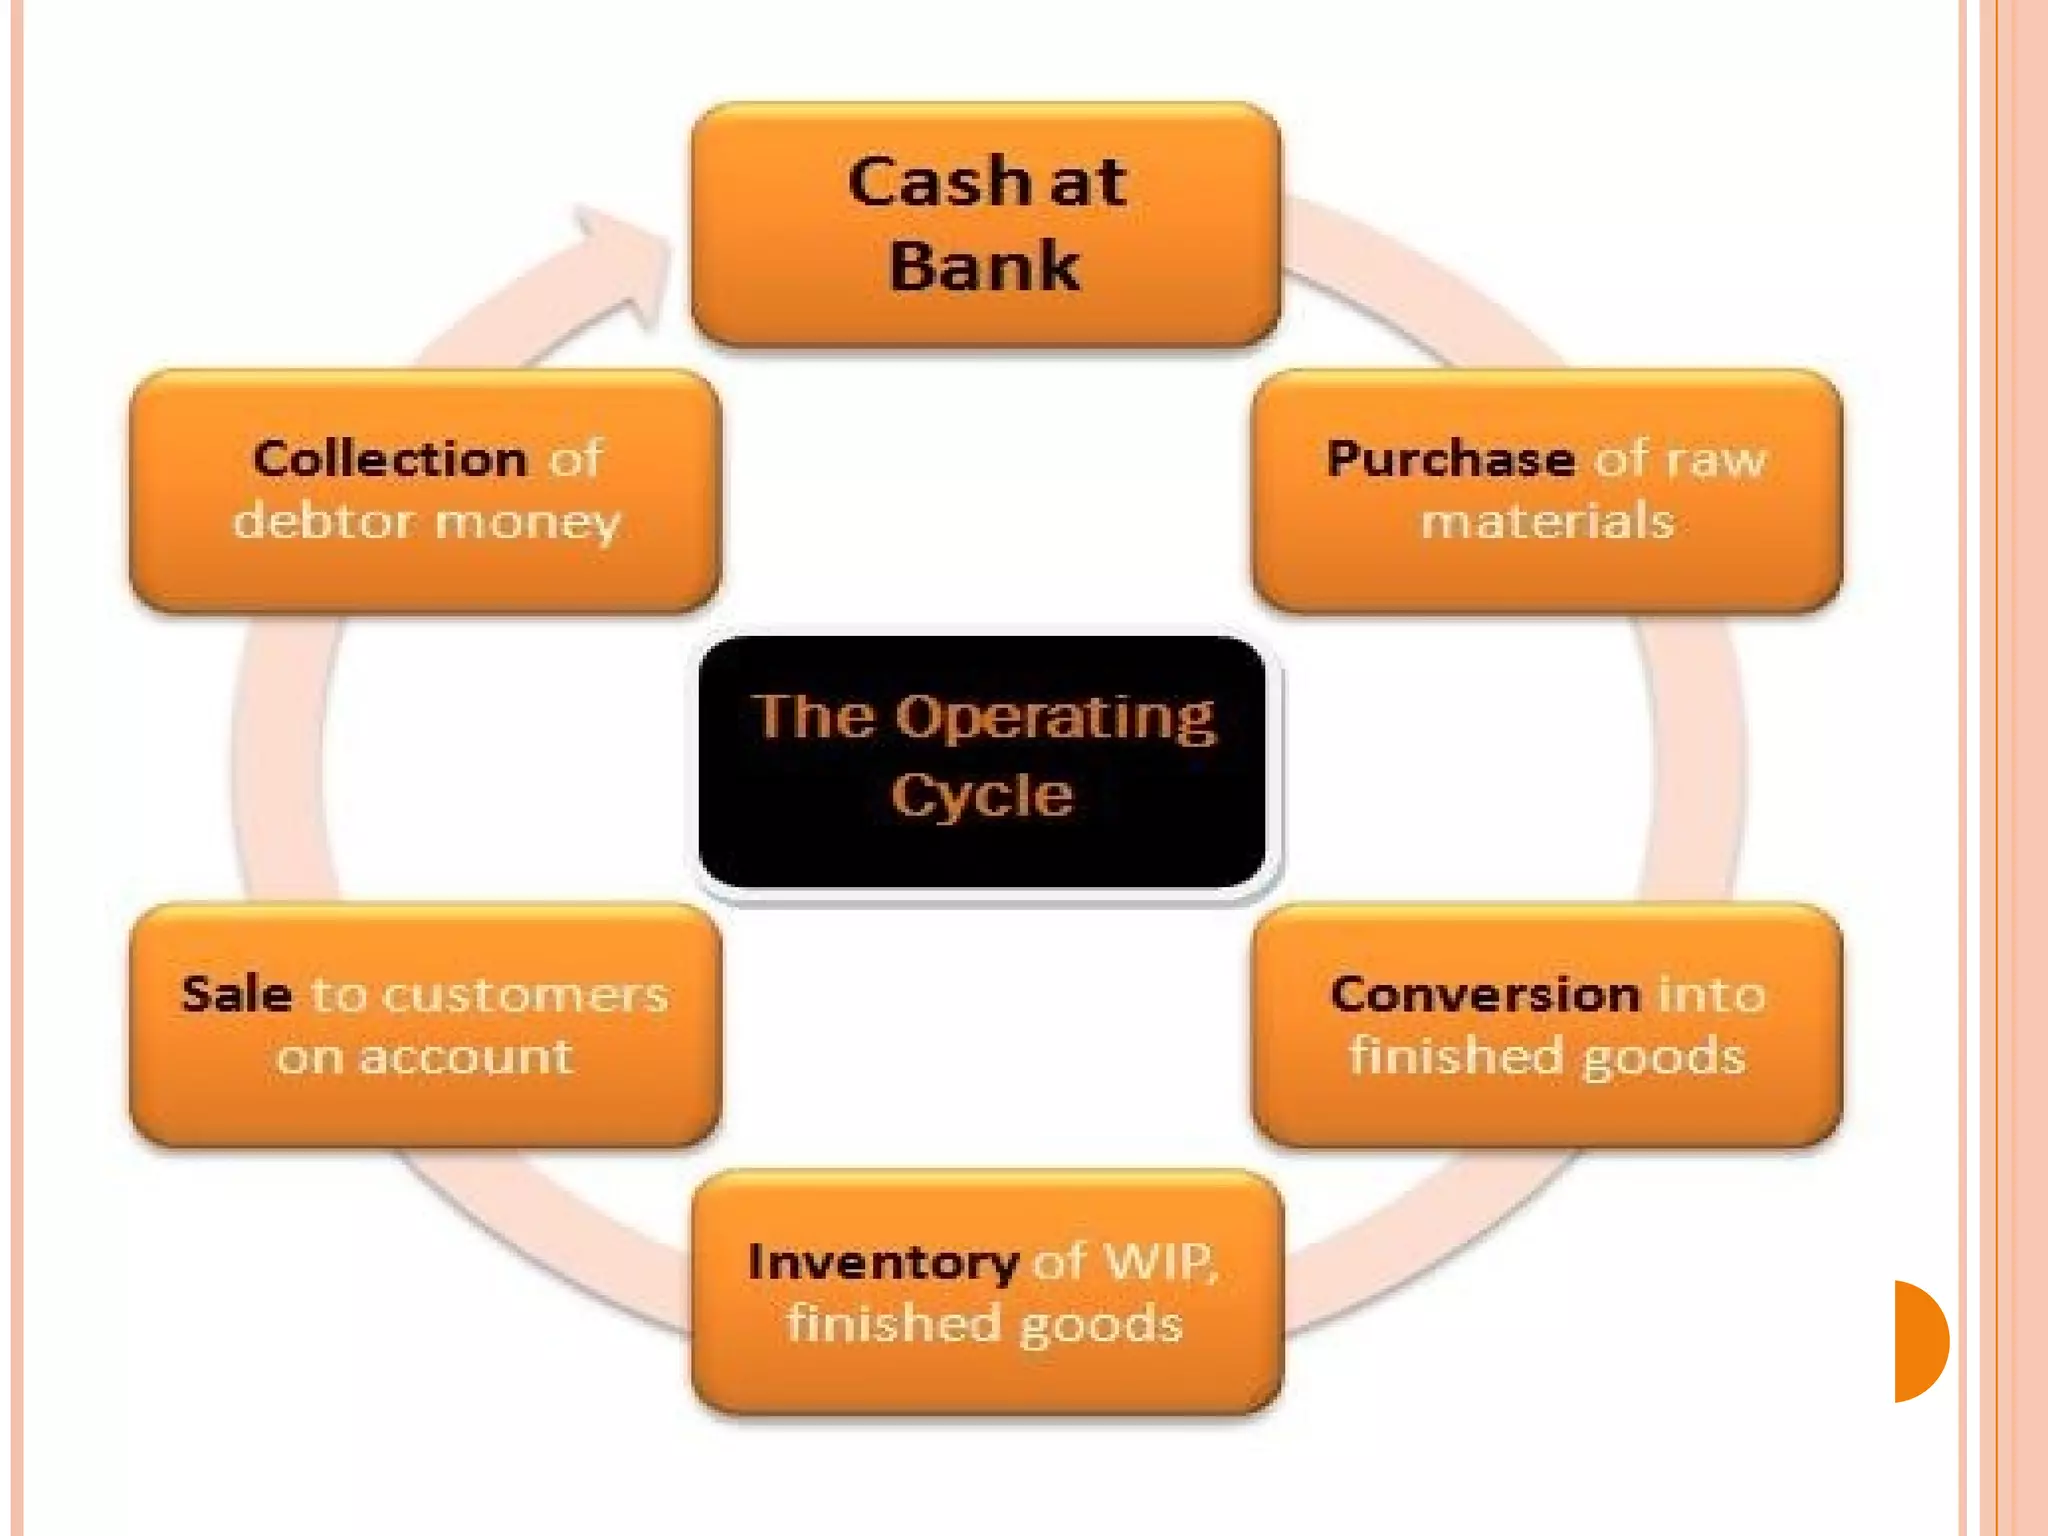
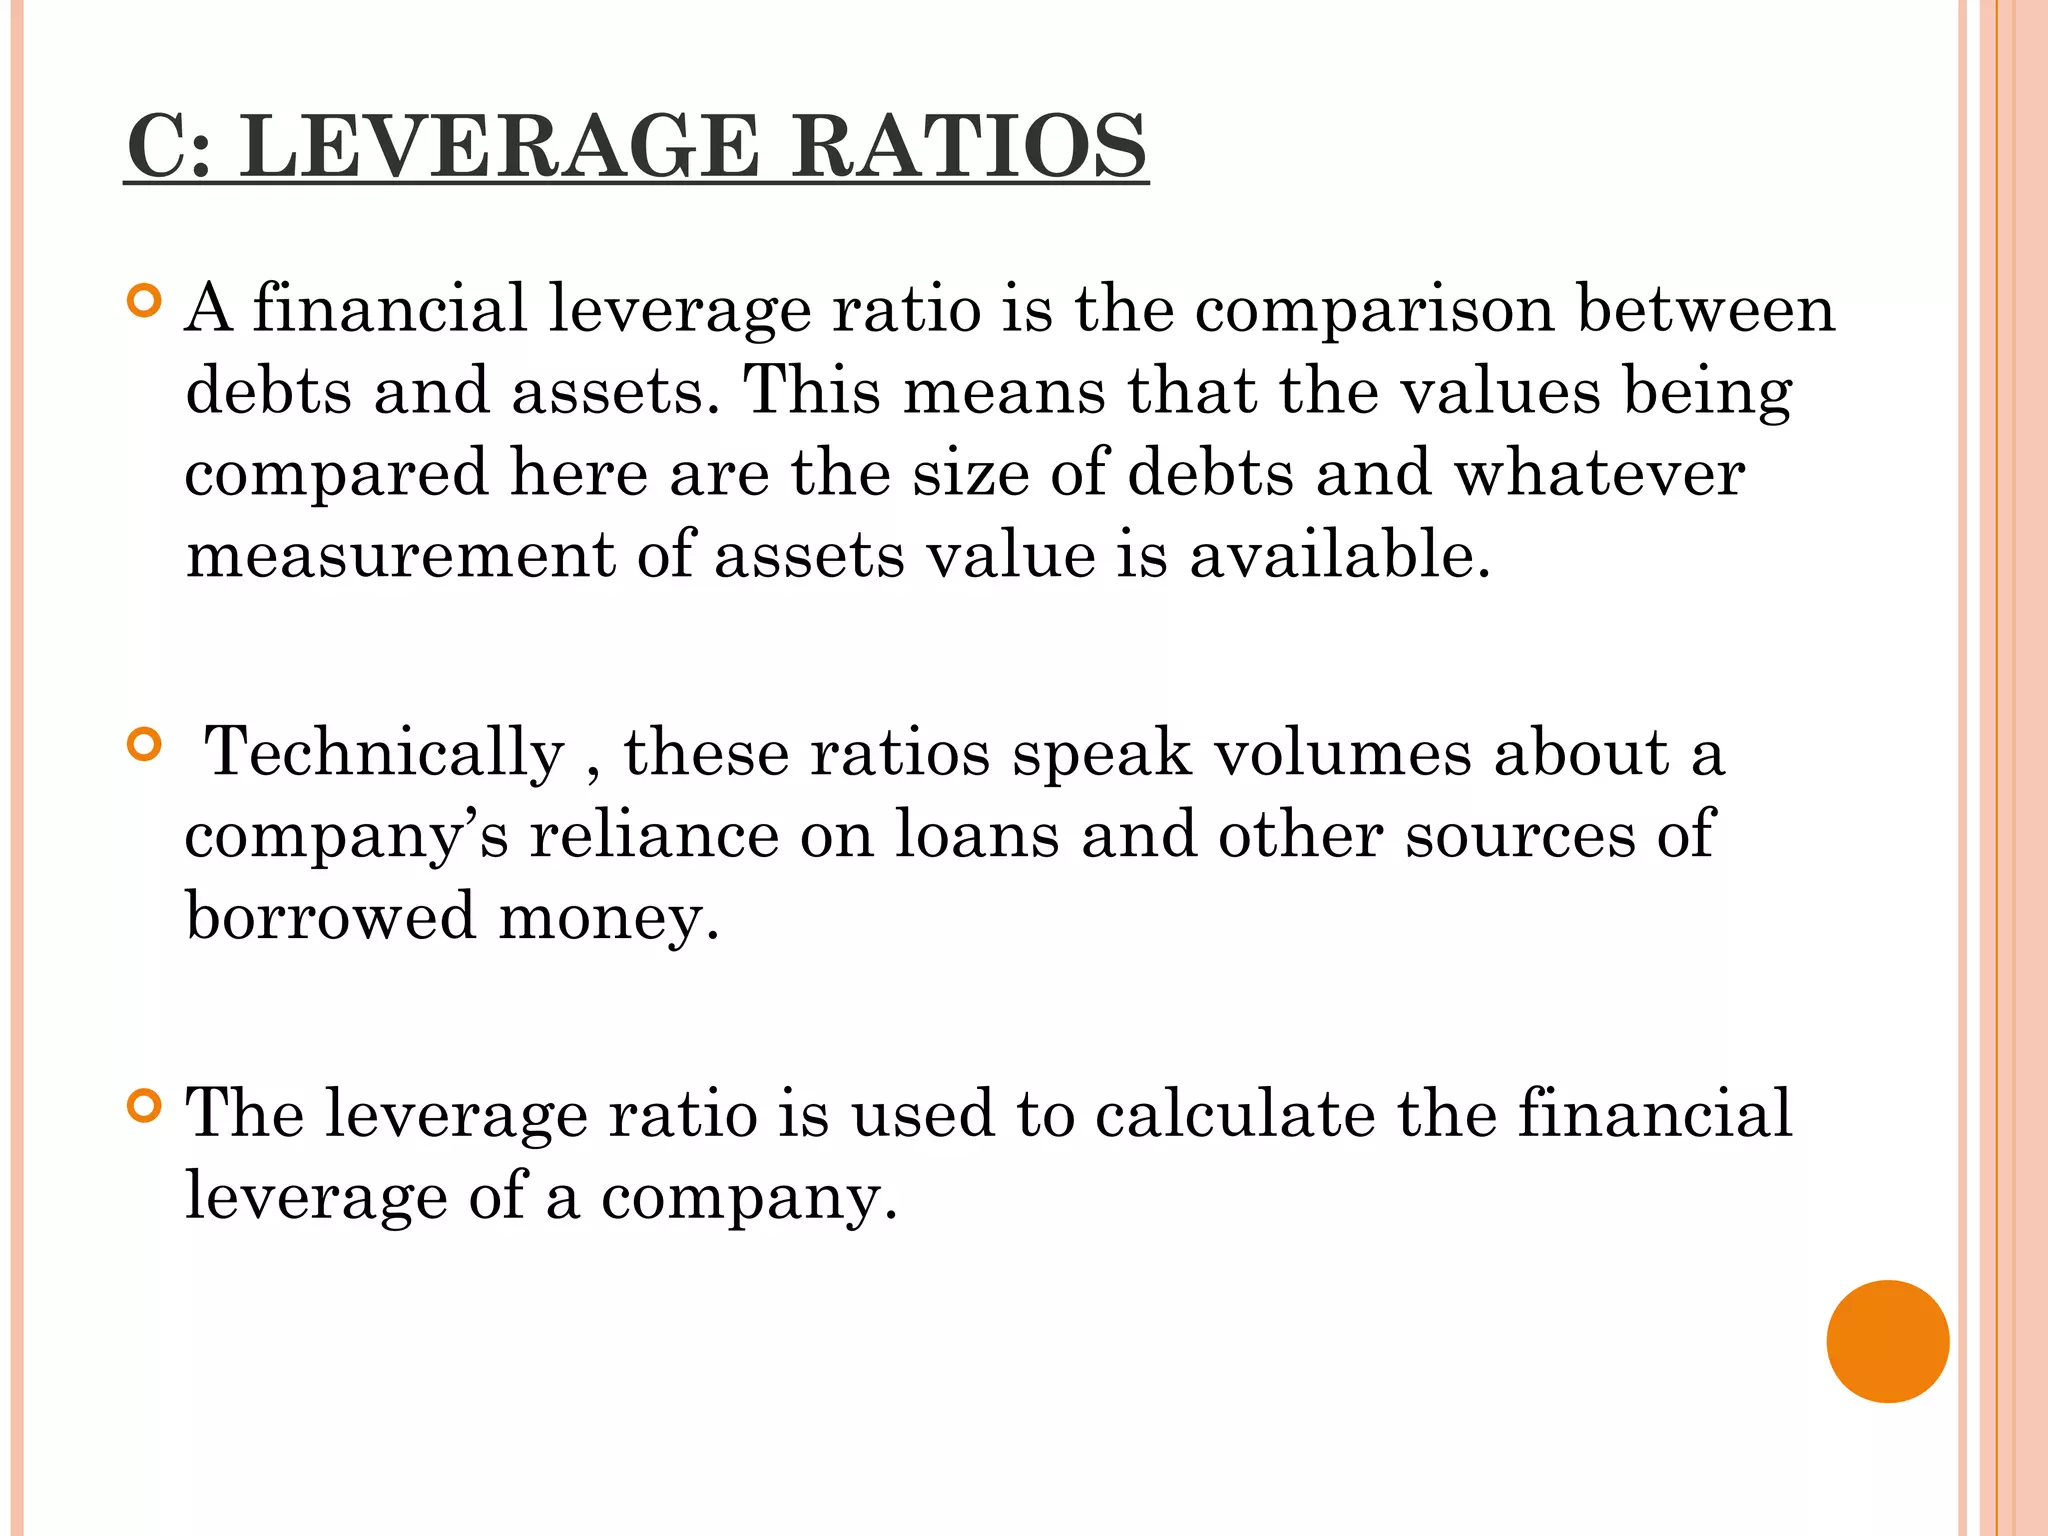
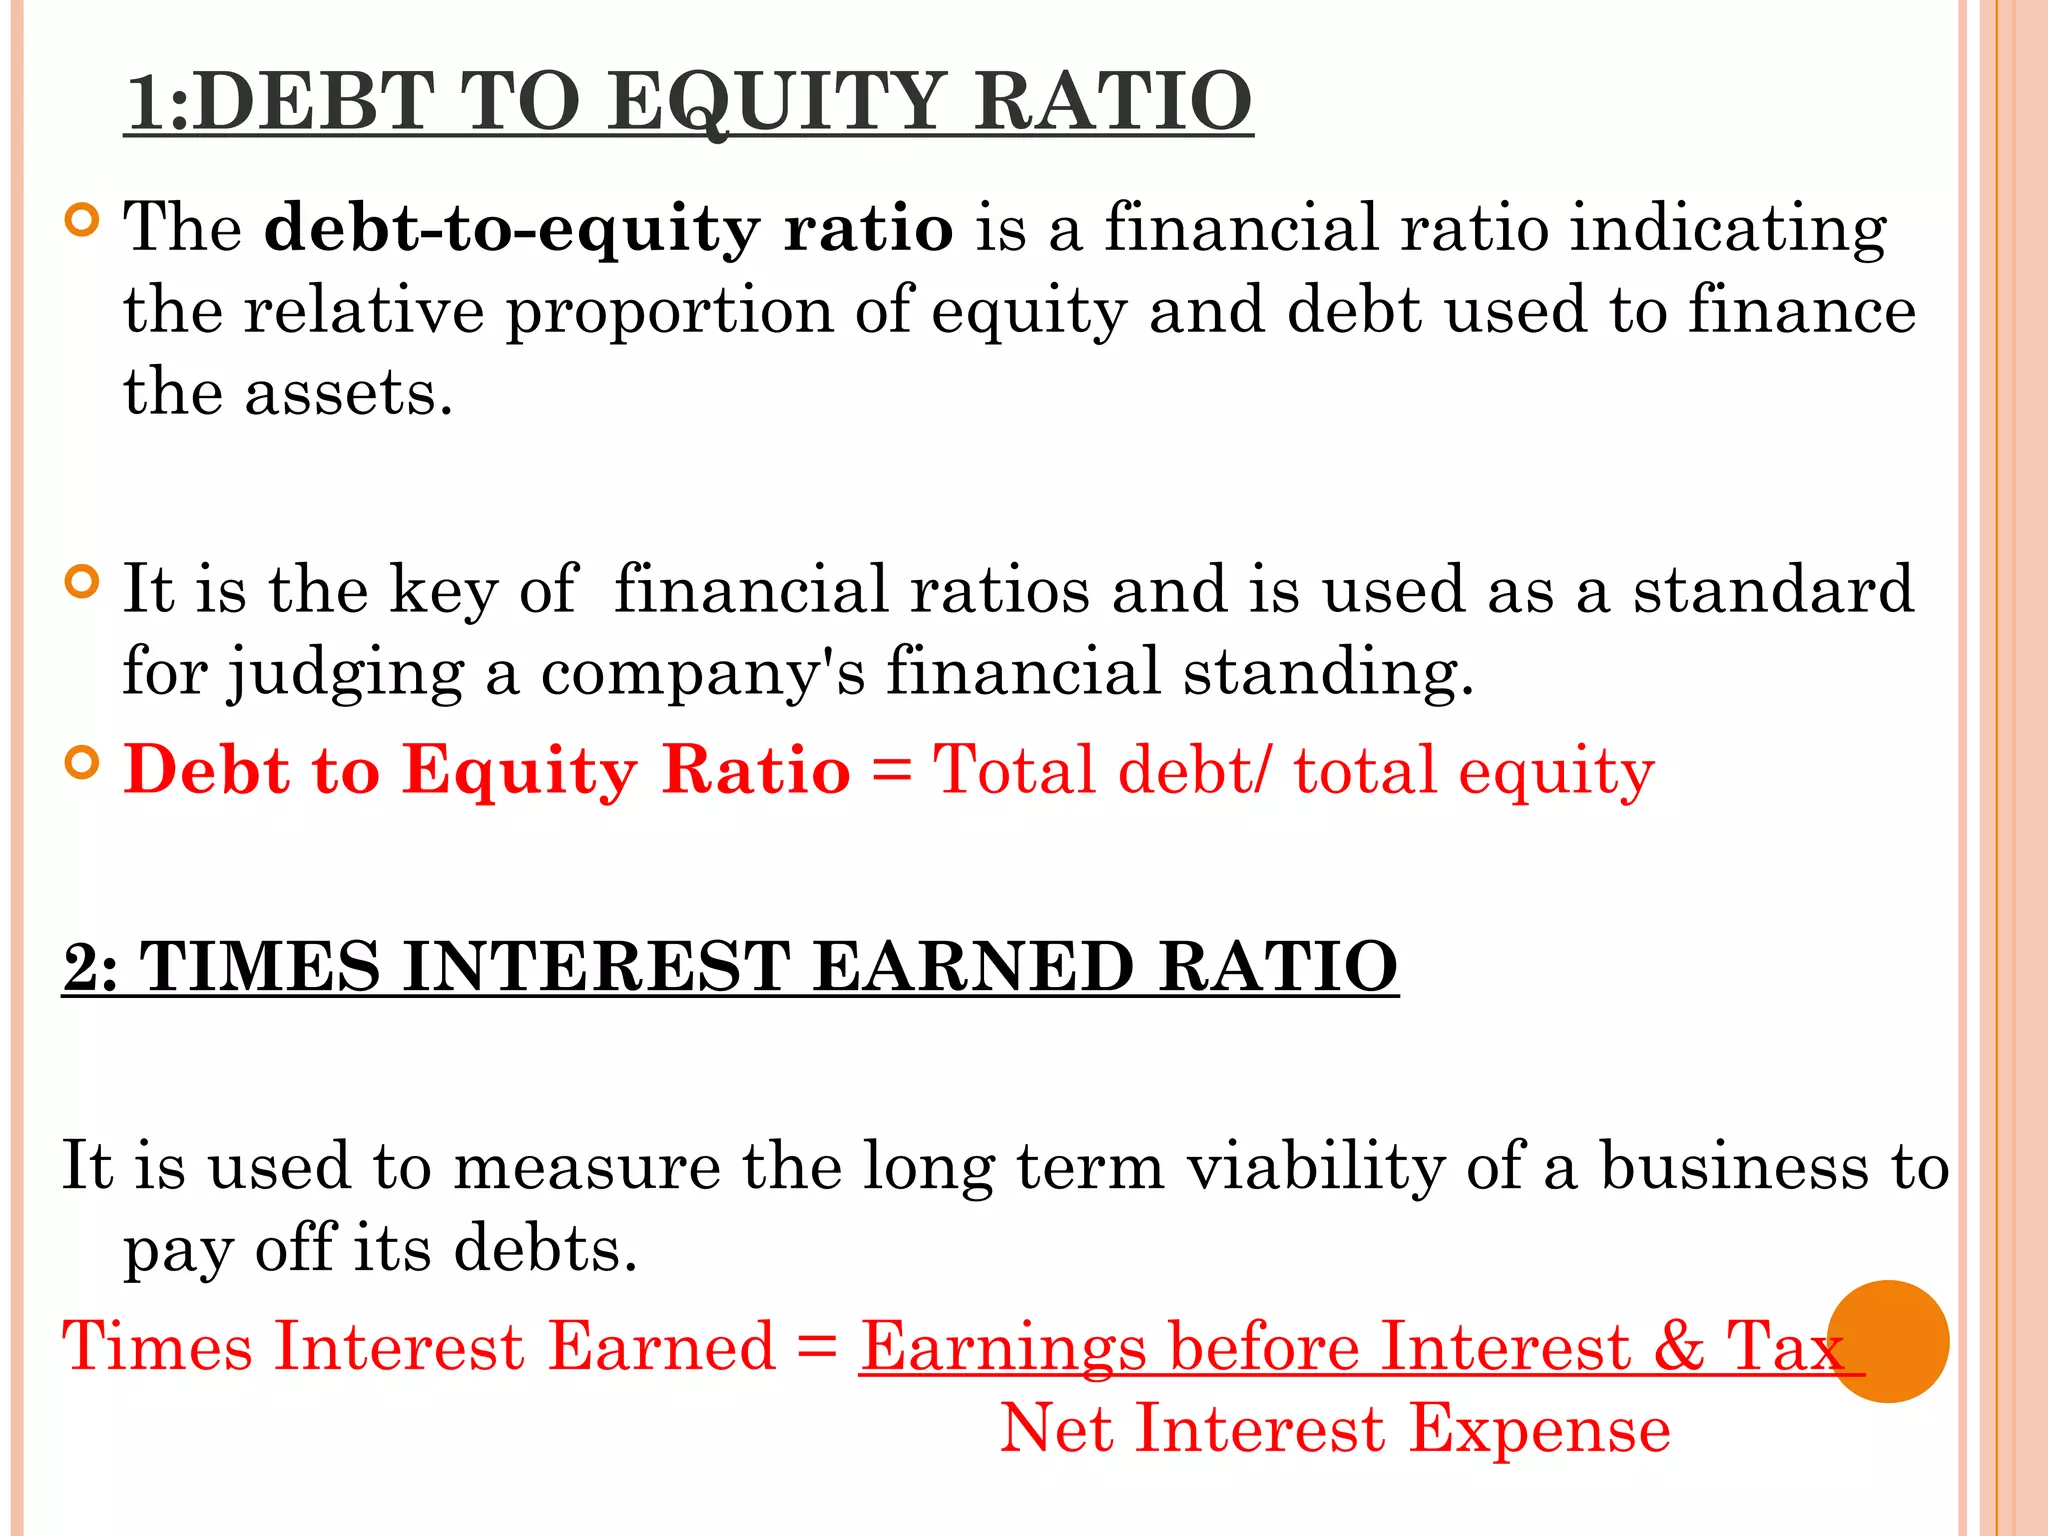
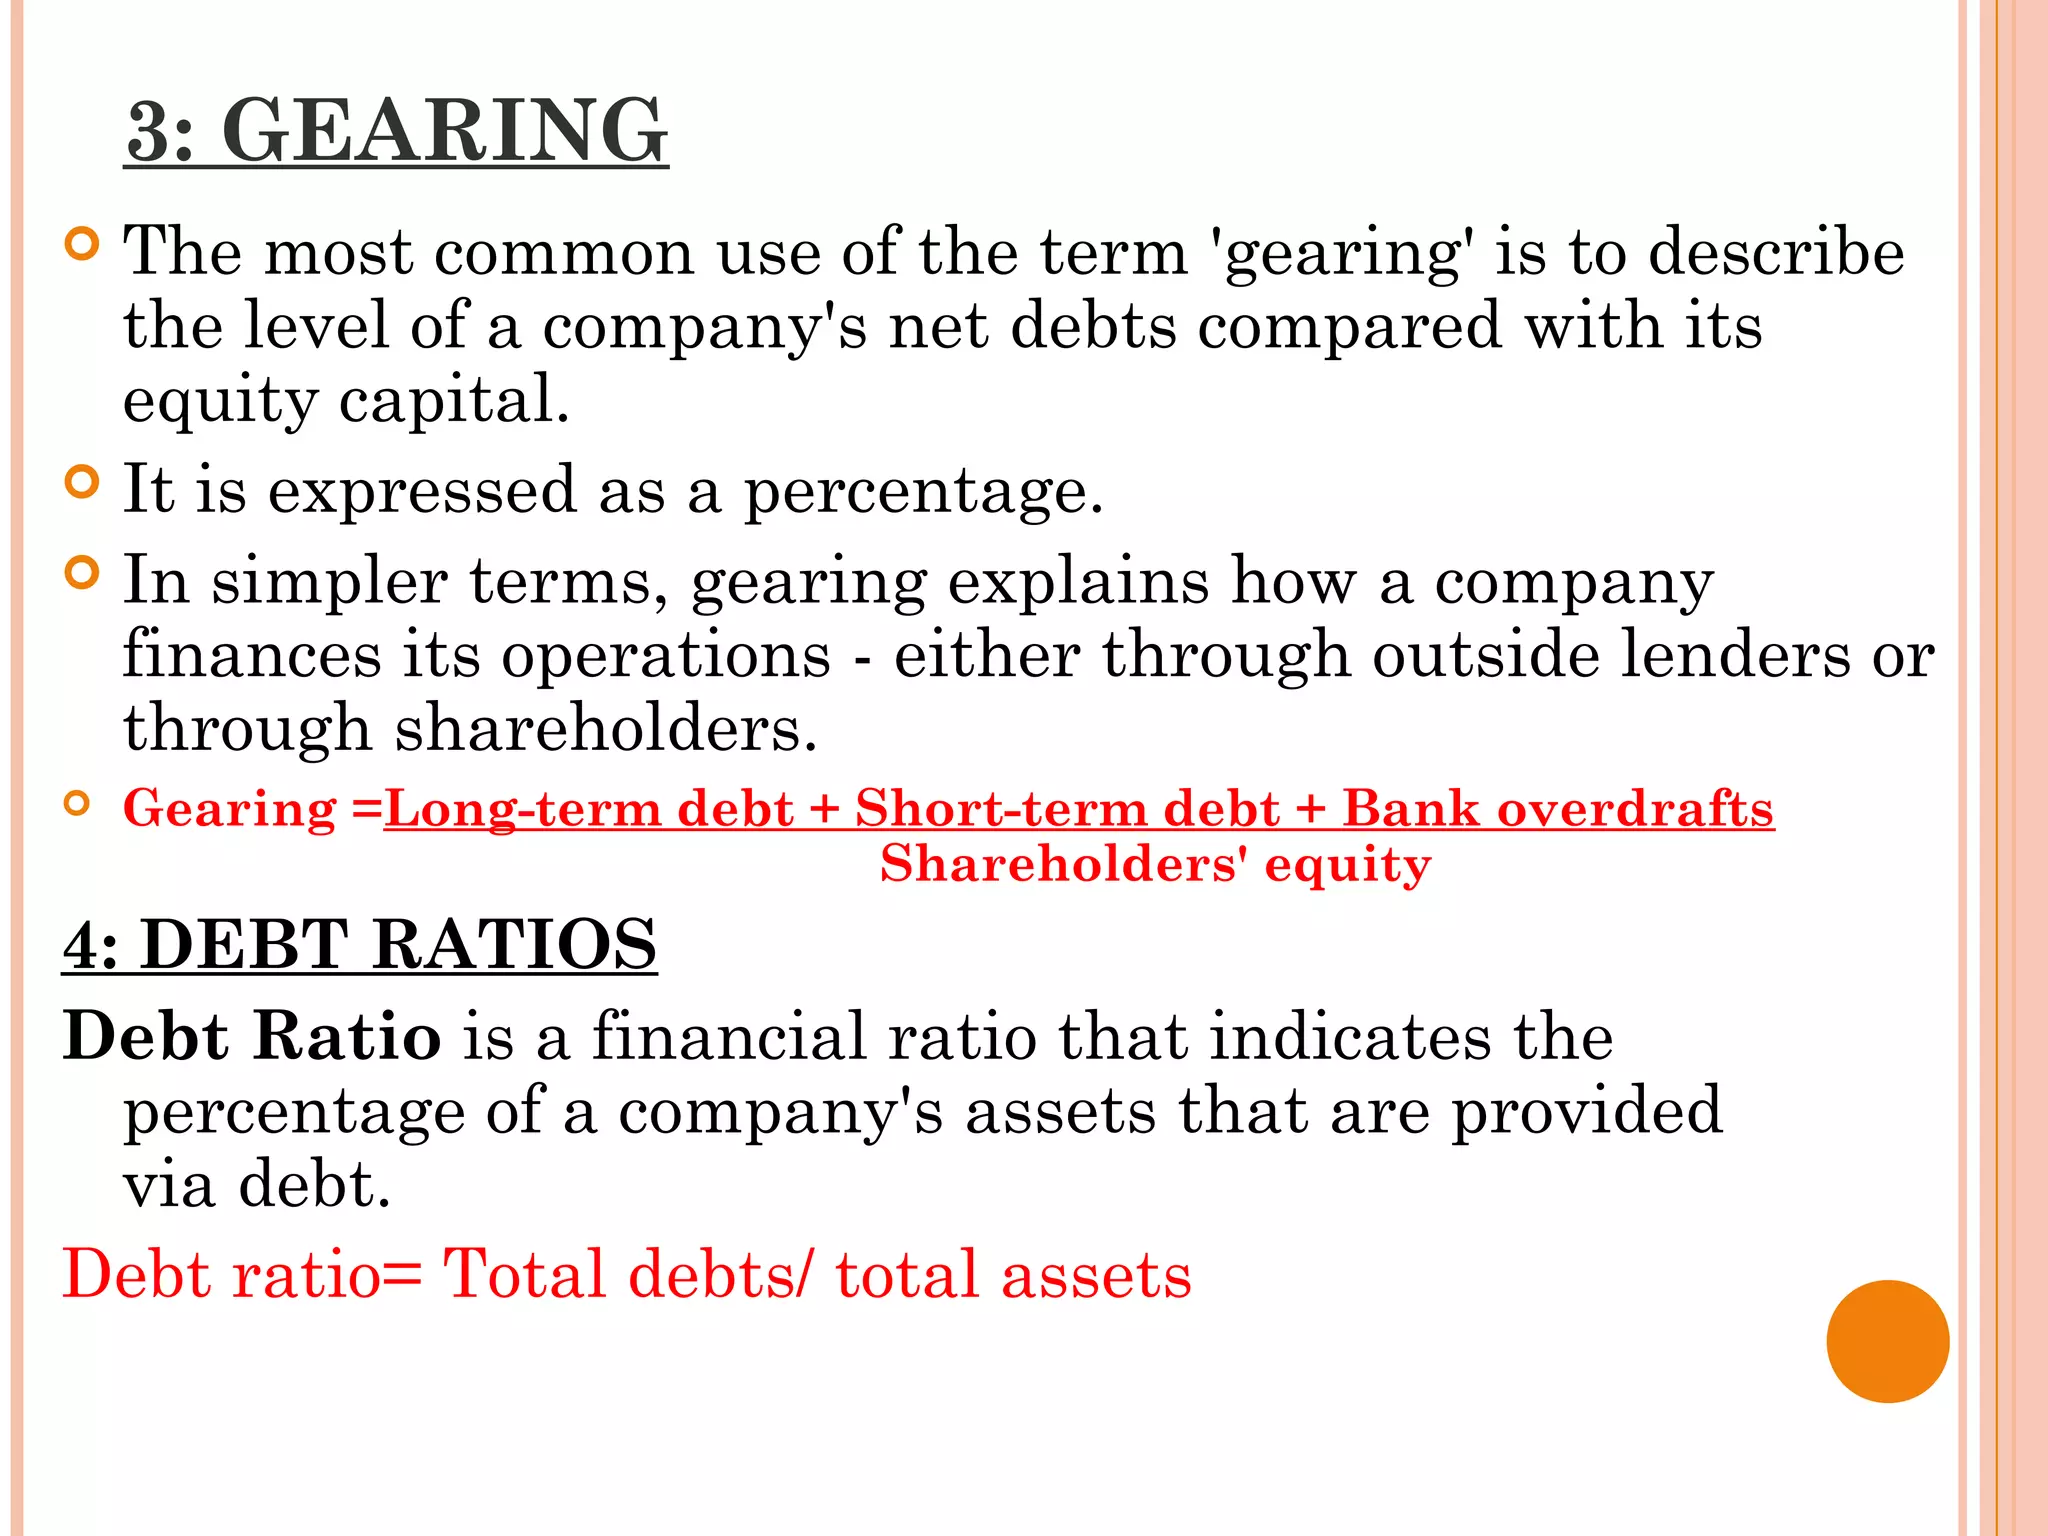
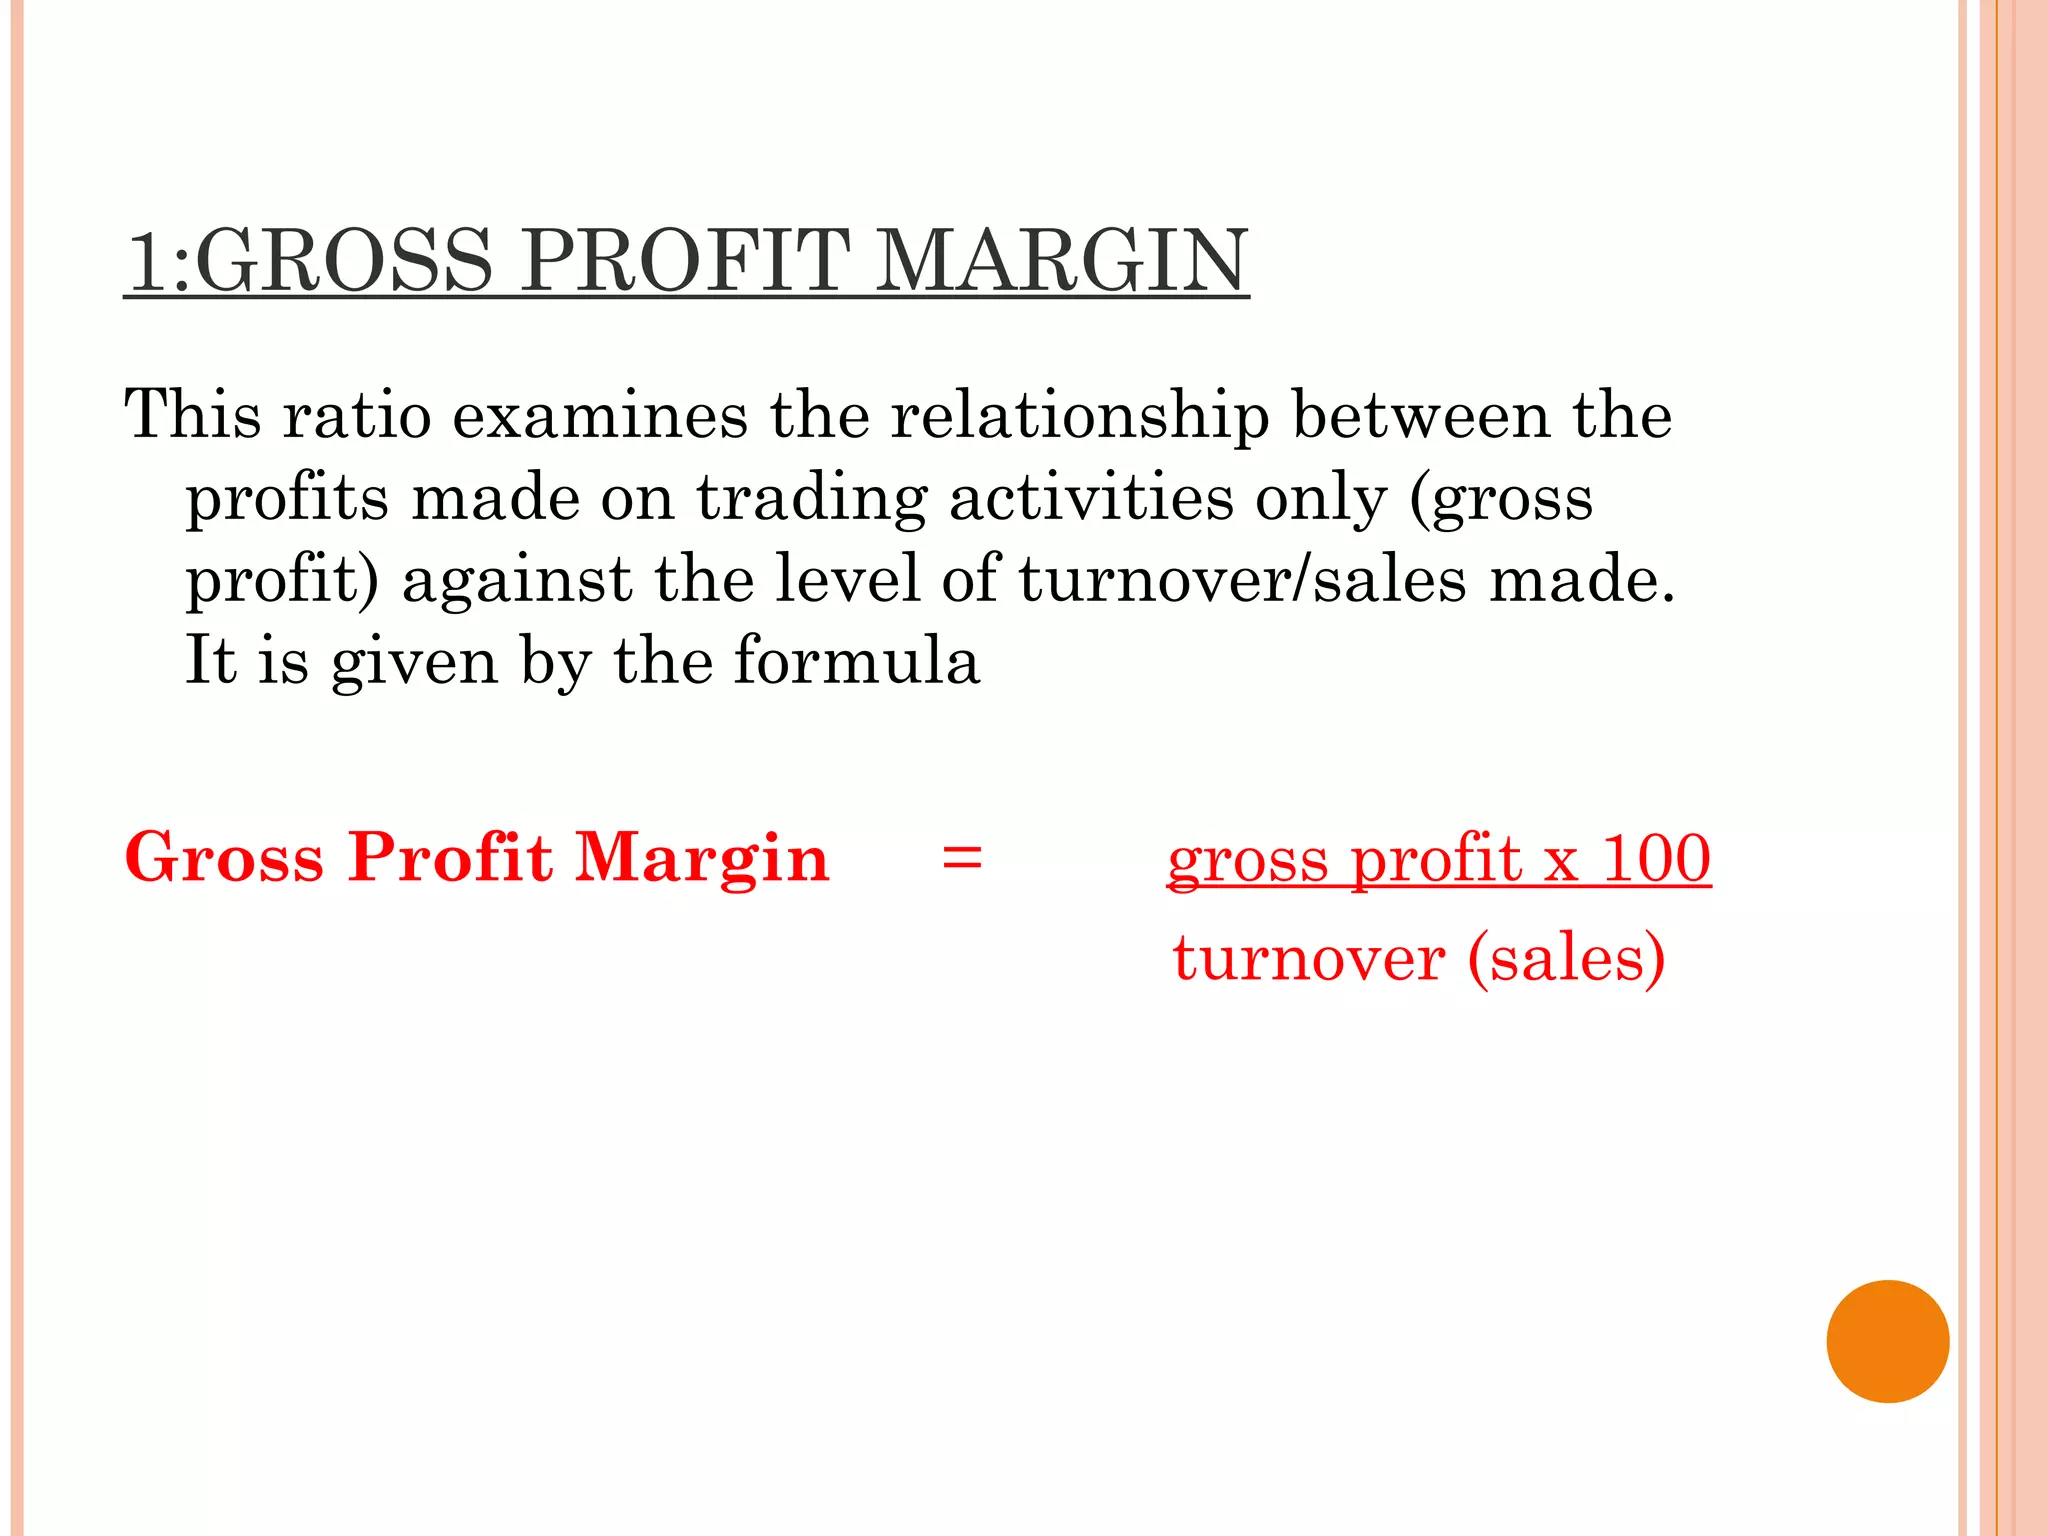
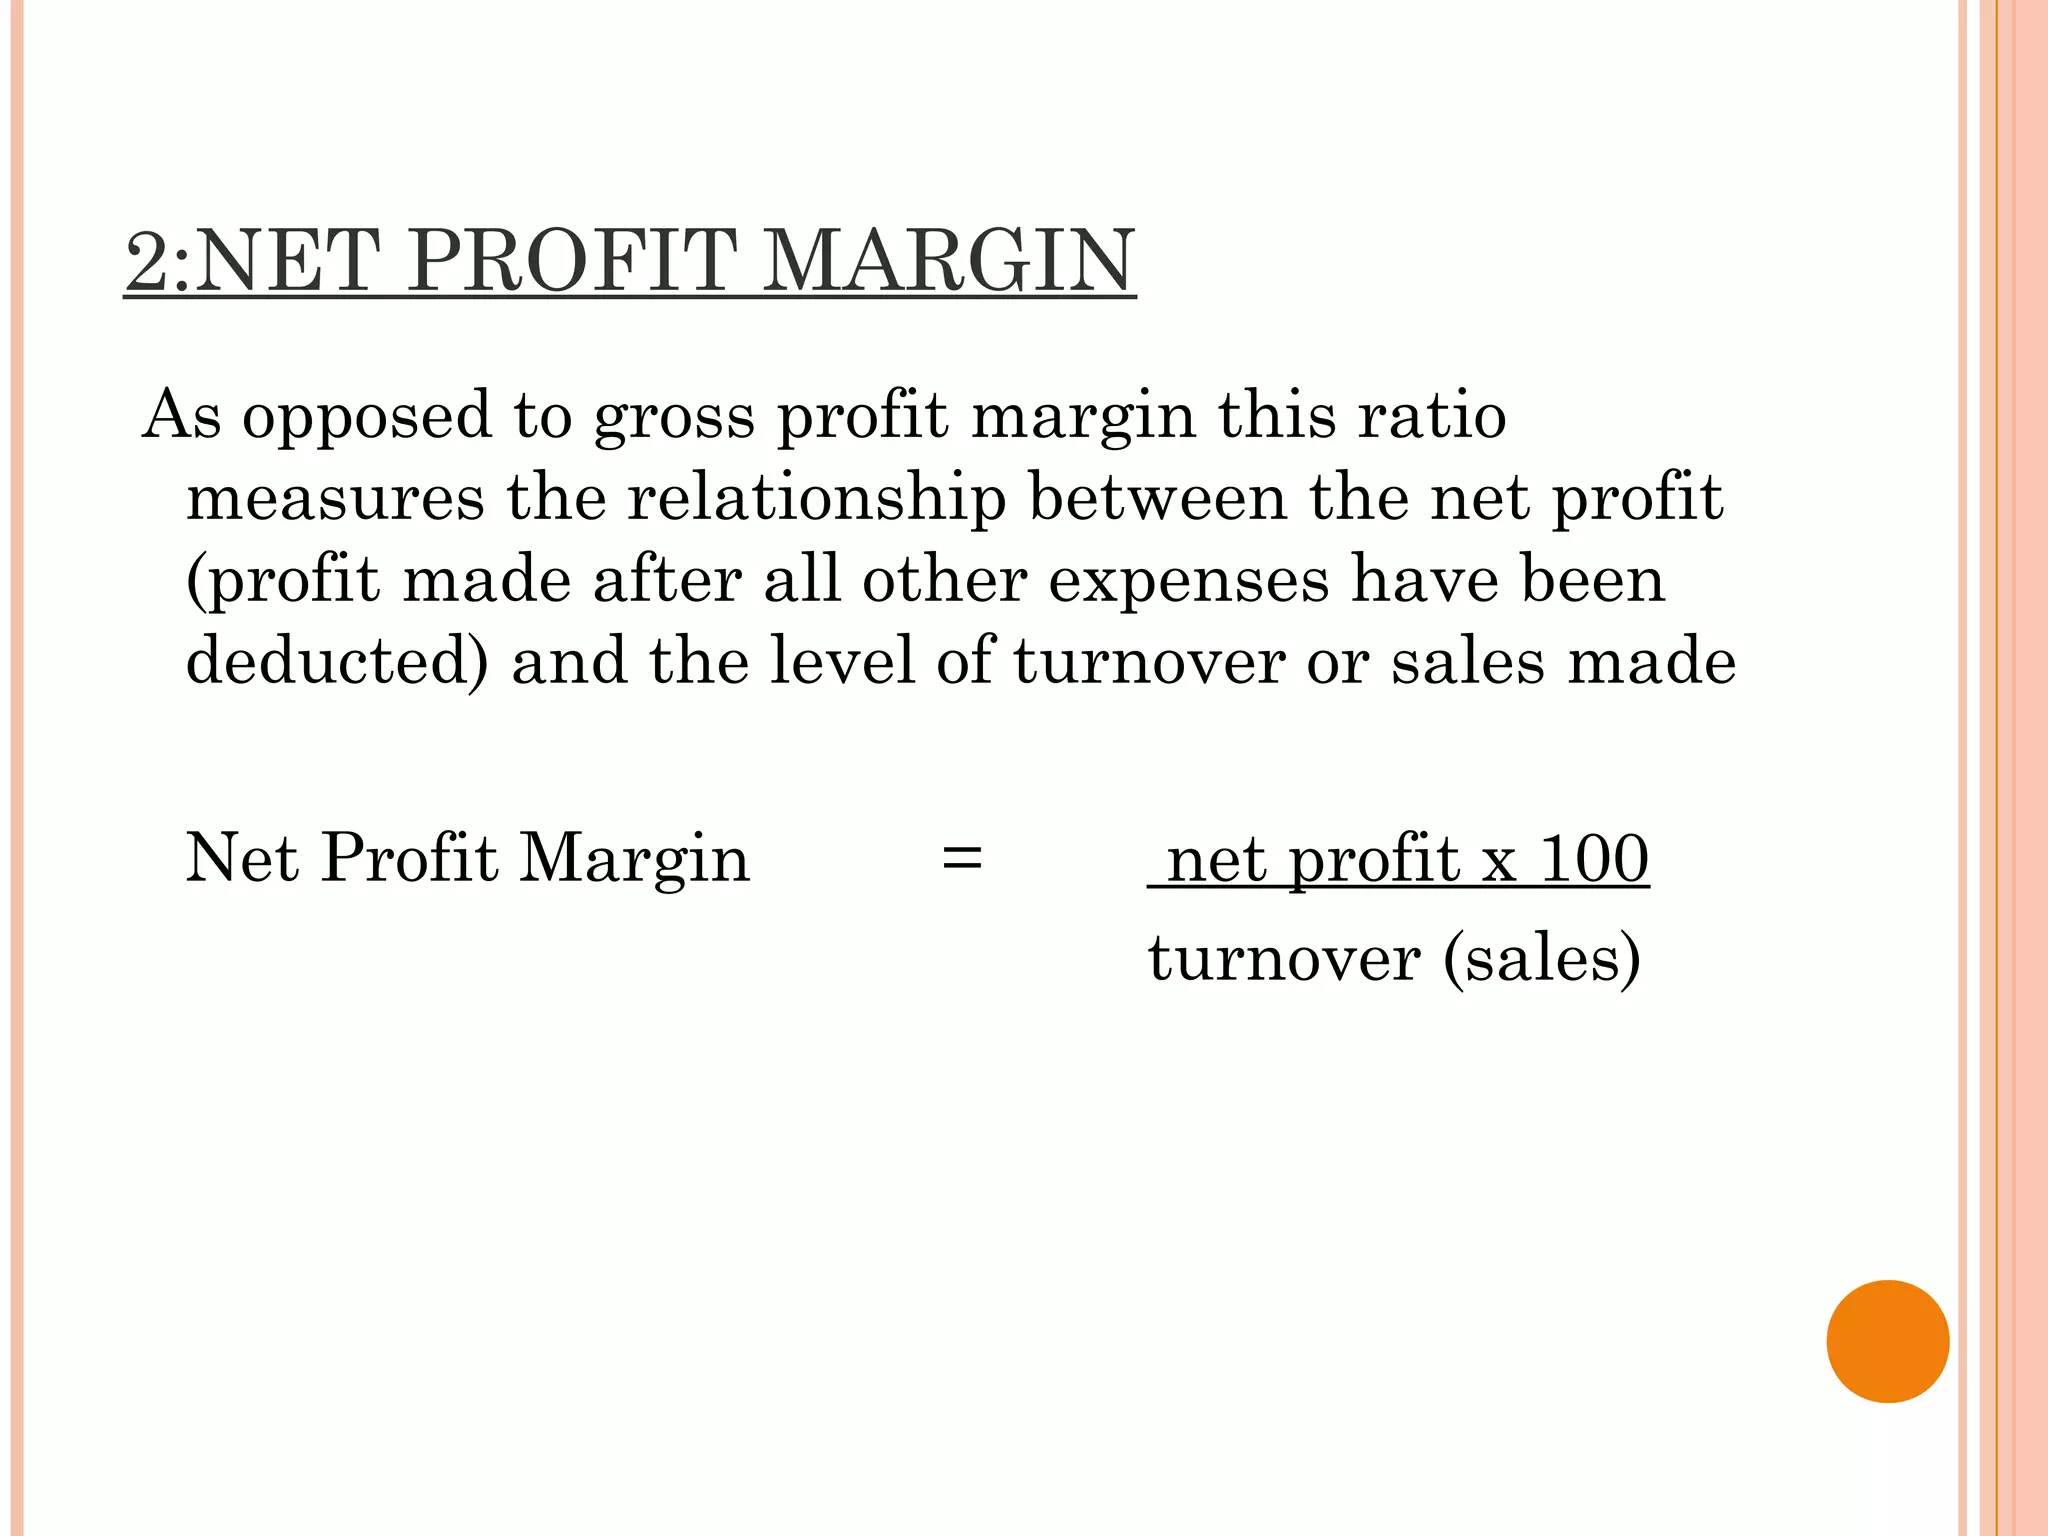
Financial Ratio Analysis of Samsung for the year 2013-2014Prinson Rodrigues
Financial Ratio Analysis of Samsung For the year 2013-2014
Current ratio
Quick ratio
Debt equity ratio
Capital turnover ratio
Fixed Assets Turnover ratio
Working capital turnover ratio
Stock turnover ratio
inventory conversion period
Debtors turnover ratio
Gross profit ratio
net profit ratio
etc
Liquidity Ratios
This type of ratio helps in measuring the ability of a company to take care of its short-term debt obligations. A higher liquidity ratio represents that the company is highly rich in cash.
The types of liquidity ratios are: –
Current Ratio or Working Capital Ratio
Quick Ratio or Liquidity Ratio or Acid Test Ratio
Absolute Liquid Ratio or Cash Ratio
Stock to Working Capital Ratio
Current Ratio: The current ratio is the ratio between the current assets and current liabilities of a company. The current ratio is used to indicate the liquidity of an organization in being able to meet its debt obligations in the upcoming twelve months. A higher current ratio will indicate that the organization is highly capable of repaying its short-term debt obligations.
Current Ratio = Current Assets / Current Liabilities
Current Assets:
Current Assets means cash and those assets which can be converted into cash within one year in ordinary course of business.
Current Liabilities:
Current Liabilities are those which are to be paid by the firm in one year.
Quick Ratio or Liquidity Ratio or Acid Test Ratio :
The quick ratio is used to ascertain information pertaining to the capability of a company in paying off its current liabilities on an immediate basis.
The formula used for the calculation of a quick ratio is-
Quick Ratio = (Cash and Cash Equivalents + Marketable Securities + Accounts Receivables) / Current Liabilities
. Absolute Liquid Ratio or Cash Ratio:
The cash ratio measures a company’s ability to pay off short-term liabilities with cash and cash equivalents:
Cash ratio = Cash and Cash equivalents / Current Liabilities
Stock to Working Capital Ratio:
It is calculated by dividing the value of stock (or inventories such as raw materials, work in progress, finished goods, stores and packing materials) by the Working capital.
Profitability Ratio
A profitability ratio is a measure of financial ratio defining the profit percent and return percent from the business using data from financial statements at a specific point of time
It assess business’s ability to generate gross profit, operating profit and net profit from the sales using data from profit& loss statement
It even takes into consideration various return generating ability of business in terms of return on assets, return on capital employed, return on equity, return on investment using data from balance sheet
Types of profitability ratio
Gross Profit Ratio, Net Profit Ratio, Operating Profit Ratio, Return on Assets, Return on Equity, Return on Investment, Return on Capital Employed
Gross Profit Ratio
Gross Profit Ratio(GPR) is a profitability ratio that shows the relationship between gross profit and the revenue from net sales
GPR = (퐆퐫퐨퐬퐬 퐏퐫퐨퐟퐢퐭)/(퐍퐞퐭 퐒퐚퐥퐞퐬)
Net Profit Ratio
The net profit ratio is equal to how much net profit is generated as a ratio of revenue earned through sales
Net Profit Ratio = (퐍퐞퐭 푷풓풐풇풊풕)/(퐍퐞퐭 푺풂풍풆풔)
Operating Profit Margin is a profitability ratio used to calculate the percentage of operating profit a company produces from its operations, prior to deduction of taxes and interest charges
Operating Profit Ratio
Operating Profit Ratio = (퐎퐩퐞퐫퐚퐭퐢퐧퐠 퐏퐫퐨퐟퐢퐭)/(퐍퐞퐭 퐒퐚퐥퐞퐬)
Return on assets (ROA) is a kind of profitability measure used to determine returns on assets relevant when compared across the companies or previous performance of the company
Return On Asset = (퐍퐞퐭 퐏퐫퐨퐟퐢퐭)/(퐀퐯퐠.퐓퐨퐭퐚퐥 퐀퐬퐬퐞퐭퐬)
Return on equity (ROE) is a measure of financial performance calculated by dividing net profit by average shareholders' equity
ROE = (퐍퐞퐭 퐏퐫퐨퐟퐢퐭)/(퐀퐯퐠.퐓퐨퐭퐚퐥 퐄퐪퐮퐢퐭퐲)
Return on capital employed is a profitability ratio used in valuation of company’s financial position depicting the return out of capital employed
ROCE = 퐄퐁퐈퐓/(퐂퐚퐩퐢퐭퐚퐥 퐄퐦퐩퐥퐨퐲퐞퐝)
Return on investment is a profitability measure used by businesses to identify the efficiency of business in generating return out of an investment
ROI = (퐍퐞퐭 퐏퐫퐨퐟퐢퐭)/(퐂퐨퐬퐭 퐨퐟 퐈퐧퐯퐞퐬퐭퐦퐞퐧퐭)
Ratio analysis refers to the analysis and interpretation of the data collected from the financial statements (i.e., Profit and Loss Statement, Balance Sheet and Fund/Cash Flow statement etc.)
Thank You for Watching
DevTech Finance
Ratios and Formulas in Customer Financial AnalysisFinancial stat.docxcatheryncouper
Ratios and Formulas in Customer Financial Analysis
Financial statement analysis is a judgmental process. One of the primary objectives is identification of major changes in trends, and relationships and the investigation of the reasons underlying those changes. The judgment process can be improved by experience and the use of analytical tools. Probably the most widely used financial analysis technique is ratio analysis, the analysis of relationships between two or more line items on the financial statement. Financial ratios are usually expressed in percentage or times. Generally, financial ratios are calculated for the purpose of evaluating aspects of a company's operations and fall into the following categories:
· Liquidity ratios measure a firm's ability to meet its current obligations.
· Profitability ratios measure management's ability to control expenses and to earn a return on the resources committed to the business.
· Leverage ratios measure the degree of protection of suppliers of long-term funds and can also aid in judging a firm's ability to raise additional debt and its capacity to pay its liabilities on time.
· Efficiency, activity or turnover ratios provide information about management's ability to control expenses and to earn a return on the resources committed to the business.
A ratio can be computed from any pair of numbers. Given the large quantity of variables included in financial statements, a very long list of meaningful ratios can be derived. A standard list of ratios or standard computation of them does not exist. The following ratio presentation includes ratios that are most often used when evaluating the credit worthiness of a customer. Ratio analysis becomes a very personal or company driven procedure. Analysts are drawn to and use the ones they are comfortable with and understand.
1. Liquidity Ratios
Working Capital
Working capital compares current assets to current liabilities, and serves as the liquid reserve available to satisfy contingencies and uncertainties. A high working capital balance is mandated if the entity is unable to borrow on short notice. The ratio indicates the short-term solvency of a business and in determining if a firm can pay its current liabilities when due.
Formula
Current Assets - Current Liabilities
Acid Test or Quick Ratio
A measurement of the liquidity position of the business. The quick ratio compares the cash plus cash equivalents and accounts receivable to the current liabilities. The primary difference between the current ratio and the quick ratio is the quick ratio does not include inventory and prepaid expenses in the calculation. Consequently, a business's quick ratio will be lower than its current ratio. It is a stringent test of liquidity.
Formula
Cash + Marketable Securities + Accounts Receivable
Current Liabilities
Current Ratio
provides an indication of the liquidity of the business by comparing the amount of current assets to current liabilities. A business's curren ...
Financial analysis for juhayna & domty co . graduation project zagzig uni...Eslam Fathi
Financial Analysis is the process of selecting, evaluating, and identifying the financial
strength and weaknesses of the firm by properly establishing relationship between
items of financial statements. Firms, bank, loan officers and business owners all use
Financial analysis to learn more about a company’s current financial health as well as its
potential.
Financial Analysis tool containing all four types of ratios (liquidity ratio, capital structure or leverage ratio, turnover or activity ratio and profitability ratio)
Financial ratios and their use in understanding Financial StatementsPranav Dedhia
An introduction and in-depth understanding on the importance of Financial ratios in understanding financial statements of business entities along with relevant examples
Ratio AnalysisFinancial ratios can be used to examine various as.docxcatheryncouper
Ratio Analysis
Financial ratios can be used to examine various aspects of the financial position and performance of a business and are widely used for planning and control purposes.
They can be used to evaluate the financial health of a business and can be utilised by management in a wide variety of decisions involving such areas as profit planning, pricing, working-capital management, financial structure and dividend policy.
Ratio analysis provides a fairly simplistic method of examining the financial condition of a business.
A ratio expresses the relation of one figure appearing in the financial statements to some other figure appearing there.
Ratios enable comparison between businesses.
Differences may exist between businesses in the scale of operations making comparison via the profits generated unreliable.
Ratios can eliminate this uncertainty.
Other than comparison with other businesses, it is also a valuable tool in analysing the performance of one business over time.
However useful ratios are not without their problems.
Figures calculated through ratio analysis can highlight the financial strengths and weaknesses of a business but they cannot, by themselves, explain why certain strengths or weaknesses exist or why certain changes have occurred.
Only detailed investigation will reveal these underlying reasons. Ratios must, therefore, be seen as a ‘starting point’.
Financial ratio classification
The following ratios are considered the more important for decision-making purposes:
Ratios can be grouped into certain categories, each of which reflects a particular aspect of financial performance or position.
The following broad categories provide a useful basis for explaining the nature of the financial ratios to be dealt with.
Profitability.Businesses come into being with the primary purpose of creating wealth for the owners. Profitability ratios provide an insight to the degree of success in achieving this purpose. They express the profits made in relation to other key figures in the financial statements or to some business resource.
Efficiency.Ratios may be used to measure the efficiency with which certain resource have been utilised within the business. These ratios are also referred to as active ratios.
Liquidity.It is vital to the survival of a business that there be sufficient liquid resources available to meet maturing obligations. Certain ratios may be calculated that examines the relationship between liquid resources held and creditors due for payment in the near future.
Gearing.This is the relationship between the amount financed by the owners of the business and the amount contributed by outsiders, which has an important effect on the degree of risk associated with a business. Gearing is then something that managers must consider when making financing decisions.
Investment.Certain ratios are concerned with assessing the returns and performance of shares held in a particular business.
Profitabi ...
Prepare a witten financial analysis. .This should include calculation.pdfarrowit1
Prepare a witten financial analysis. .This should include calculations and discussion related to
the Chapter 5 appendix (Appendix 5A). See illustration 5A-1 for a summary of financial ratios.
Be sure to include (1) these ratios, (2) what they mean and (3) how you interpret them: o Current
ratio o Accounts receivable turnover o Inventory turnover o Profit margin on sales o Return on
assets o Return on stockholders\' equity o Debt to assets ratio Submit a WORD document via
D2L- Assessments - Assignments
Solution
Ans ) The ratios are not meant for a particular person or firm.People in various fields of life are
interested in ratio analysis from their own angles.The parties attached with business or firm are
creditors i.e. mony lenders, shareholders.Management uses the toolof Ratio analysisto
interpretate the information from their own angles.For example creditors are interested in
liquidity and solvency for which they will make use of current ratio , liquidity ratio,
proprietaryRatio, debt equity Ratio,capital gearing Ratio.Shareholders are interested in
profitability and long term solvency.They want to know the rate of return on their capital
employed for which they willmake use of Gross Profit Ratio, Operating Ratio, Dividend ratio
and Price Earning Ratio.Management is interested in overall efficiency of business which can be
better jud ged through Ratios like turnover to fixed assets, turnover to capital employed, stock
turnover ratio etc.So, from the above discussion it is clear that different prties uses the tool of
Ratio analysis for taking their own decisions
The particular purpose of a user is determining the particular Ratios that might be used ofr
financial analysis.Here we will discuss and calculate various ratios to do fianacial analysis.
Current Ratio = Current Assests/Current Liabilities
Current Assests= Cash + Bank+ Prepaid Insurance+Inventory+ Accounts Recievables
Current Assests=44746.5 +510+500+5000+29000=79756.5
Current Laibilites =Accounts payable
Current Laibilites= 30064.83
Current Ratio = 79756.5/30064.83= 2.7
Interpretation : Generally a current ratio of 2 times or 2:1 is cosidered to be satisfactory.Here the
current ratio of greater than 2 denotes the good liquidity position but it also indicates assest
liabilty mis match.But current ratio greater than 2 is generally preferred as compared to less than
2.
2.Account receivables turnover :It represents the number of times the cash is collected from
debtors.Lower turnover denotes poor collection and means that funds are blocked ofr longer
period of tiem and vice-versa.It also measure the liquidity of the firm.It shows how quickly
debtors (receivables) are converted into sales.The Account receivables turnover shows the
relationship between sales and debtors of the firm.
Account receivables turnover= Net Credit Annual Sales/Average trade debtors
3. Inventory turnover :This ratio indicates the number of times inventory or stock is replaced
during the year.The turnover of invent.
The secret way to sell pi coins effortlessly.DOT TECH
Well as we all know pi isn't launched yet. But you can still sell your pi coins effortlessly because some whales in China are interested in holding massive pi coins. And they are willing to pay good money for it. If you are interested in selling I will leave a contact for you. Just telegram this number below. I sold about 3000 pi coins to him and he paid me immediately.
Telegram: @Pi_vendor_247
Introduction to Indian Financial System ()Avanish Goel
The financial system of a country is an important tool for economic development of the country, as it helps in creation of wealth by linking savings with investments.
It facilitates the flow of funds form the households (savers) to business firms (investors) to aid in wealth creation and development of both the parties
What website can I sell pi coins securely.DOT TECH
Currently there are no website or exchange that allow buying or selling of pi coins..
But you can still easily sell pi coins, by reselling it to exchanges/crypto whales interested in holding thousands of pi coins before the mainnet launch.
Who is a pi merchant?
A pi merchant is someone who buys pi coins from miners and resell to these crypto whales and holders of pi..
This is because pi network is not doing any pre-sale. The only way exchanges can get pi is by buying from miners and pi merchants stands in between the miners and the exchanges.
How can I sell my pi coins?
Selling pi coins is really easy, but first you need to migrate to mainnet wallet before you can do that. I will leave the telegram contact of my personal pi merchant to trade with.
Tele-gram.
@Pi_vendor_247
Falcon stands out as a top-tier P2P Invoice Discounting platform in India, bridging esteemed blue-chip companies and eager investors. Our goal is to transform the investment landscape in India by establishing a comprehensive destination for borrowers and investors with diverse profiles and needs, all while minimizing risk. What sets Falcon apart is the elimination of intermediaries such as commercial banks and depository institutions, allowing investors to enjoy higher yields.
what is the future of Pi Network currency.DOT TECH
The future of the Pi cryptocurrency is uncertain, and its success will depend on several factors. Pi is a relatively new cryptocurrency that aims to be user-friendly and accessible to a wide audience. Here are a few key considerations for its future:
Message: @Pi_vendor_247 on telegram if u want to sell PI COINS.
1. Mainnet Launch: As of my last knowledge update in January 2022, Pi was still in the testnet phase. Its success will depend on a successful transition to a mainnet, where actual transactions can take place.
2. User Adoption: Pi's success will be closely tied to user adoption. The more users who join the network and actively participate, the stronger the ecosystem can become.
3. Utility and Use Cases: For a cryptocurrency to thrive, it must offer utility and practical use cases. The Pi team has talked about various applications, including peer-to-peer transactions, smart contracts, and more. The development and implementation of these features will be essential.
4. Regulatory Environment: The regulatory environment for cryptocurrencies is evolving globally. How Pi navigates and complies with regulations in various jurisdictions will significantly impact its future.
5. Technology Development: The Pi network must continue to develop and improve its technology, security, and scalability to compete with established cryptocurrencies.
6. Community Engagement: The Pi community plays a critical role in its future. Engaged users can help build trust and grow the network.
7. Monetization and Sustainability: The Pi team's monetization strategy, such as fees, partnerships, or other revenue sources, will affect its long-term sustainability.
It's essential to approach Pi or any new cryptocurrency with caution and conduct due diligence. Cryptocurrency investments involve risks, and potential rewards can be uncertain. The success and future of Pi will depend on the collective efforts of its team, community, and the broader cryptocurrency market dynamics. It's advisable to stay updated on Pi's development and follow any updates from the official Pi Network website or announcements from the team.
how can I sell pi coins after successfully completing KYCDOT TECH
Pi coins is not launched yet in any exchange 💱 this means it's not swappable, the current pi displaying on coin market cap is the iou version of pi. And you can learn all about that on my previous post.
RIGHT NOW THE ONLY WAY you can sell pi coins is through verified pi merchants. A pi merchant is someone who buys pi coins and resell them to exchanges and crypto whales. Looking forward to hold massive quantities of pi coins before the mainnet launch.
This is because pi network is not doing any pre-sale or ico offerings, the only way to get my coins is from buying from miners. So a merchant facilitates the transactions between the miners and these exchanges holding pi.
I and my friends has sold more than 6000 pi coins successfully with this method. I will be happy to share the contact of my personal pi merchant. The one i trade with, if you have your own merchant you can trade with them. For those who are new.
Message: @Pi_vendor_247 on telegram.
I wouldn't advise you selling all percentage of the pi coins. Leave at least a before so its a win win during open mainnet. Have a nice day pioneers ♥️
#kyc #mainnet #picoins #pi #sellpi #piwallet
#pinetwork
what is the best method to sell pi coins in 2024DOT TECH
The best way to sell your pi coins safely is trading with an exchange..but since pi is not launched in any exchange, and second option is through a VERIFIED pi merchant.
Who is a pi merchant?
A pi merchant is someone who buys pi coins from miners and pioneers and resell them to Investors looking forward to hold massive amounts before mainnet launch in 2026.
I will leave the telegram contact of my personal pi merchant to trade pi coins with.
@Pi_vendor_247
how can i use my minded pi coins I need some funds.DOT TECH
If you are interested in selling your pi coins, i have a verified pi merchant, who buys pi coins and resell them to exchanges looking forward to hold till mainnet launch.
Because the core team has announced that pi network will not be doing any pre-sale. The only way exchanges like huobi, bitmart and hotbit can get pi is by buying from miners.
Now a merchant stands in between these exchanges and the miners. As a link to make transactions smooth. Because right now in the enclosed mainnet you can't sell pi coins your self. You need the help of a merchant,
i will leave the telegram contact of my personal pi merchant below. 👇 I and my friends has traded more than 3000pi coins with him successfully.
@Pi_vendor_247
how to swap pi coins to foreign currency withdrawable.DOT TECH
As of my last update, Pi is still in the testing phase and is not tradable on any exchanges.
However, Pi Network has announced plans to launch its Testnet and Mainnet in the future, which may include listing Pi on exchanges.
The current method for selling pi coins involves exchanging them with a pi vendor who purchases pi coins for investment reasons.
If you want to sell your pi coins, reach out to a pi vendor and sell them to anyone looking to sell pi coins from any country around the globe.
Below is the contact information for my personal pi vendor.
Telegram: @Pi_vendor_247
Turin Startup Ecosystem 2024 - Ricerca sulle Startup e il Sistema dell'Innov...Quotidiano Piemontese
Turin Startup Ecosystem 2024
Una ricerca de il Club degli Investitori, in collaborazione con ToTeM Torino Tech Map e con il supporto della ESCP Business School e di Growth Capital
how to sell pi coins in all Africa Countries.DOT TECH
Yes. You can sell your pi network for other cryptocurrencies like Bitcoin, usdt , Ethereum and other currencies And this is done easily with the help from a pi merchant.
What is a pi merchant ?
Since pi is not launched yet in any exchange. The only way you can sell right now is through merchants.
A verified Pi merchant is someone who buys pi network coins from miners and resell them to investors looking forward to hold massive quantities of pi coins before mainnet launch in 2026.
I will leave the telegram contact of my personal pi merchant to trade with.
@Pi_vendor_247
US Economic Outlook - Being Decided - M Capital Group August 2021.pdfpchutichetpong
The U.S. economy is continuing its impressive recovery from the COVID-19 pandemic and not slowing down despite re-occurring bumps. The U.S. savings rate reached its highest ever recorded level at 34% in April 2020 and Americans seem ready to spend. The sectors that had been hurt the most by the pandemic specifically reduced consumer spending, like retail, leisure, hospitality, and travel, are now experiencing massive growth in revenue and job openings.
Could this growth lead to a “Roaring Twenties”? As quickly as the U.S. economy contracted, experiencing a 9.1% drop in economic output relative to the business cycle in Q2 2020, the largest in recorded history, it has rebounded beyond expectations. This surprising growth seems to be fueled by the U.S. government’s aggressive fiscal and monetary policies, and an increase in consumer spending as mobility restrictions are lifted. Unemployment rates between June 2020 and June 2021 decreased by 5.2%, while the demand for labor is increasing, coupled with increasing wages to incentivize Americans to rejoin the labor force. Schools and businesses are expected to fully reopen soon. In parallel, vaccination rates across the country and the world continue to rise, with full vaccination rates of 50% and 14.8% respectively.
However, it is not completely smooth sailing from here. According to M Capital Group, the main risks that threaten the continued growth of the U.S. economy are inflation, unsettled trade relations, and another wave of Covid-19 mutations that could shut down the world again. Have we learned from the past year of COVID-19 and adapted our economy accordingly?
“In order for the U.S. economy to continue growing, whether there is another wave or not, the U.S. needs to focus on diversifying supply chains, supporting business investment, and maintaining consumer spending,” says Grace Feeley, a research analyst at M Capital Group.
While the economic indicators are positive, the risks are coming closer to manifesting and threatening such growth. The new variants spreading throughout the world, Delta, Lambda, and Gamma, are vaccine-resistant and muddy the predictions made about the economy and health of the country. These variants bring back the feeling of uncertainty that has wreaked havoc not only on the stock market but the mindset of people around the world. MCG provides unique insight on how to mitigate these risks to possibly ensure a bright economic future.
2. CONTENTS
How does Ratio Analysis came into picture?
What is Ratio Analysis?
Significance of Ratio Analysis
Purpose of Ratio Analysis
Precautions to be taken while using ratio analysis
Types of Ratios
Case study
3. Learning Outcomes
Understand the contextual environment in which
we apply financial ratios
Explain the calculation and application of ratios
in the areas of profitability, efficiencies, liquidity,
etc. and apply them to a set of financial
statements
Calculate different ratios from supplied company
details and interpret these ratios
Explain the different classifications of financial
ratios
Explore the results of ratio analysis in terms of
what it tell us about the organisation
4. NEED FOR A CHANGE..
Traditional financial statements( balance sheet,
profit and loss accounts) do not give all the
information related to the firm
It ignores the significance of financial operations
that the firm has undertaken in the entire year.
Understanding Financial statements is a
complex task for a lay man(non commerce), this
gave rise to ratio analysis.
5. WHAT IS RATIO ANALYSIS ??
Ratio-analysis means the process of computing,
determining and presenting the relationship of
related items and groups of items of the financial
statements.
It is the systematic use of ratios to interpret the
performance and status of the firm.
They provide information in a summarized and
concise form.
6. SIGNIFICANCE OF RATIO
ANALYSIS
The significance of a ratio can only truly be appreciated
when:
It is compared with other ratios in the same set of
financial statements of the competitors.
It is compared with the same ratio in previous
financial statements.
It is compared with a standard of performance
(industry average). Such a standard may be either the
ratio which represents the typical performance of the
trade or industry, or the ratio which represents the
target set by management as desirable for the
business.
7. PURPOSE OF RATIO
ANALYSIS-
It’s a tool which enables the banker or lender to
arrive at the following factors i.e :
Liquidity position
Profitability
Solvency
Financial Stability
Quality of the Management
Safety & Security of the loans.
8. Before looking at the ratios there are a number of
cautionary points concerning their use that need to
be identified :
a. The dates and duration of the financial statements being
compared should be the same. If not, then wrong
conclusions will be drawn.
b. The accounts to be compared should have been prepared on
the same bases. Different treatment of stocks or
depreciations or asset valuations will distort the results.
c. In order to judge the overall performance of the firm, a
group of ratios, as opposed to just one or two should be
used. In order to identify trends at least three years of
ratios are normally required.
9. HOW A RATIO IS EXPRESSED?
As Percentage - such as 25% or 50% . For
example if net profit is Rs.25,000/- and the sales
is Rs.1,00,000/- then the net profit can be said to
be 25% of the sales.
As Proportion - The above figures may be
expressed in terms of the relationship between
net profit to sales as 1 : 4.
As Pure Number /Times - The same can also
be expressed in an alternatively way such as the
sale is 4 times of the net profit or profit is 1/4th
of
the sales.
11. A: LIQUIDITY RATIOS
The main concern of liquidity ratio is to
measures the ability of a firm to meet their short-
term obligations.
Failure to do this will result in the total failure of
the business.
These ratios are concerned with the examination
of the financial stability of the organization.
12. 1: CURRENT RATIOS
It expresses the relationship between current
assets and current liabilities
The concept behind this ratio is to find out
whether a company's short-term assets are
readily available to pay off its short-term
liabilities or not.
Current Ratio = Current Assets/Current
Liabilities
The ideal Current Ratio is 2 : 1
13. COMPARISON AMONG TWO FIRMS
Particulars Firm A Firm B
Current assets
Current liabilities
1,80,000
1,20,000
30,000
10,000
Current Ratio = 3 : 2 = 3 : 1
14. 2:QUICK RATIO OR ACID TEST
It is the ratio between Quick Current Assets and Current
Liabilities.
Acid Test or Quick Ratio = Quick Current
Assets/Current Liabilities
Example :
Cash 50
Debtors 100
Inventories 200
Current Liabilities 100
Total Current Assets 350
Current Ratio = > 350/100 = 3.5 : 1
Quick Ratio = > 150/100 = 1.5 : 1
15. 3:CASH RATIOS
The cash ratio is an indicator of a company's
liquidity by measuring the amount of cash, cash
equivalents or invested funds there in the
current assets to cover current liabilities.
Cash ratio = cash + cash equivalents
current liabilities
4: NET WORKING CAPITAL
It indicates the amount of money in hand to meet
current obligations.
Net Working Capital = Current Assets – Current
Liabilities
16. 5: DAYS PAYABLE OUTSTANDING
It indicates the number of days to settle all payables.
Days payable outstanding is an efficiency ratio that
measures the average number of days a company
takes to pay its suppliers
Days Payable outstanding =
Average Accounts Payable * 365
COGS
Average Accounts Payable is the average of the opening
and closing balances of Accounts Payable.
17. B: ACTIVITY RATIOS
If a business does not use its assets effectively,
investors in the business would rather take their
money and place it somewhere else.
It is also known as Asset Management process.
Activity ratios are used to assess how active
various assets are in the business.
18. 1: AVERAGE COLLECTION PERIOD
The average collection period measures the quality of
debtors since it indicates the speed of their collection.
The shorter the average collection period, the better
will be the quality of debtors, as a short collection
period implies the quick payment by the debtors.
An excessively long collection period implies a very
liberal and inefficient credit and collection
performance.
Debtor collection period= debtors x 365
credit sales
19. 2: INVENTORY TURNOVER
It determines how often the stock turns over in
the business.
It indicates the efficiency of the firm in selling its
product.
This ratio measures the number of times in one
year that a business turns over its stock of goods
for sale.
Stock Turnover= average stock x 365 (days)
cost of goods sold
Average Inventory = (Opening Stock + Closing Stock)
2
20. 3: TOTAL ASSETS TURNOVER
It indicates the efficiency with which the firm
uses all its assets to generate sales.
Asset turnover = sales
net assets
21. Cash turnover = sales / cash and cash equivalents
Accounts Receivable ratio= Annual Sales / average
Accounts Receivable
Current Asset Turnover Ratio = Annual Sales /
Current Assets
Fixed Assets Turnover ratio = Sales / Net Fixed
Assets
Accounts Payable ratio= Annual Sales / Accounts
Payable
22. Working capital turnover = sales / working
capital
Days in Inventory = Average inventory / cost of
sales per day
Days in Accounts Receivable = Accounts
Receivable / sales per day
Days in Accounts Payable = Accounts Payable /
sales per day
Operating cycle = Days in Inventory + Days in
Accounts Receivables.
23.
24. C: LEVERAGE RATIOS
A financial leverage ratio is the comparison between
debts and assets. This means that the values being
compared here are the size of debts and whatever
measurement of assets value is available.
Technically , these ratios speak volumes about a
company’s reliance on loans and other sources of
borrowed money.
The leverage ratio is used to calculate the financial
leverage of a company.
25. 1:DEBT TO EQUITY RATIO
The debt-to-equity ratio is a financial ratio indicating
the relative proportion of equity and debt used to finance
the assets.
It is the key of financial ratios and is used as a standard
for judging a company's financial standing.
Debt to Equity Ratio = Total debt/ total equity
2: TIMES INTEREST EARNED RATIO
It is used to measure the long term viability of a business to
pay off its debts.
Times Interest Earned = Earnings before Interest & Tax
Net Interest Expense
26. 3: GEARING
The most common use of the term 'gearing' is to describe
the level of a company's net debts compared with its
equity capital.
It is expressed as a percentage.
In simpler terms, gearing explains how a company
finances its operations - either through outside lenders or
through shareholders.
Gearing =Long-term debt + Short-term debt + Bank overdrafts
Shareholders' equity
4: DEBT RATIOS
Debt Ratio is a financial ratio that indicates the
percentage of a company's assets that are provided
via debt.
Debt ratio= Total debts/ total assets
28. 1:GROSS PROFIT MARGIN
This ratio examines the relationship between the
profits made on trading activities only (gross
profit) against the level of turnover/sales made.
It is given by the formula
Gross Profit Margin = gross profit x 100
turnover (sales)
29. 2:NET PROFIT MARGIN
As opposed to gross profit margin this ratio
measures the relationship between the net profit
(profit made after all other expenses have been
deducted) and the level of turnover or sales made
Net Profit Margin = net profit x 100
turnover (sales)
30. 3:RETURN ON INVESTMENT
A performance measure used to evaluate the
efficiency of an investment or to compare the
efficiency of a number of different investments.
To calculate ROI, the benefit (return) of an
investment is divided by the cost of the
investment; the result is expressed as a
percentage or a ratio
ROI = After tax earnings/ total assets
31. 4:RETURN ON EQUITY
The amount of net income returned as a
percentage of shareholders equity. Return on
equity measures a corporation's profitability by
revealing how much profit a company
generates with the money shareholders have
invested.
ROE = After tax Earnings/ Stockholder’s equity
32. 5:EARNING PER SHARE
The portion of a company's profit allocated to each
outstanding share of common stock. Earnings per
share serves as an indicator of a company's
profitability.
EPS = Net income after tax- pref. dividend / no.
of issued equity shares
34. 1:DIVIDEND YIELD RATIO
A financial ratio that shows how much a company
pays out in dividends each year relative to its
share price. In the absence of any capital gains,
the dividend yield is the return on investment for
a stock.
Dividend yield = Dividend per share / share price
Dividend per share = total dividend / no. of
shares outstanding
35. 2:PRICE EARNING RATIO
A valuation ratio of a company's current share
price compared to its per-share earnings.
P/E ratio = Market price per share/ current
earnings per share
For example: a company is currently trading at
Rs.43 a share and earnings over the last 12
months were Rs.1.95 per share, the P/E ratio for
the stock would be 22.05
36. ~~CASE STUDY~~
RATIO ANALYSIS FOR JET
AIRWAYS
Jet Airways was incorporated on April 1, 1992 as a
private company with limited liability under the
Companies Act.
In 2005, Jet Airways Limited has filed its draft Red
Herring Prospectus with the Securities and Exchange
Board of India (Sebi) to enter the capital market with
its initial public offering. The company will offer
17,266,801 (1.72 crore shares) equity shares of Rs 10
each for cash at a price to be decided through the
book-building process. It is learnt that the value of
each share will be Rs 870. The IPO proceeds will
essentially be used to fund its international expansion
plans.
Jet Airways IPO was subscribed 4.25 times on the
first day of the offer.
37. MANAGEMENT
Designation Names
Chairman / Chair Person Naresh Goyal
Director Ali Ghandour
Director Javed Akhtar
Director Aman Mehta
Director Victoriano P Dungca
Director I M Kadri
Director Yash Raj Chopra
Once we are done with the presentation, you will be able to:
Ok now, how cum ratio analysis came into the picture 2) ) i.e they do not provide information regarding changes in d firms financial positions
The aim of analysing the financial statements is to build up a picture of how the company has been performing and how it is likely to perform in future in order to take decisions.
i.e what we called it as Inter firm comparison I.e Trend analysis Next is comparing the performance of a company with the standards performances of industry
Now moving over to the purpose of ratio analysis 1)
A ratio can be expressed in 3 forms
RATIOS are classified as- 1 liquidity- it depicts the ability of the firm to pay its debts 2)Activity ratios depict how easily or efficiently we Increase our turnover 3) profitability- it tells us, how effective the firm is at generating profits 4) Leverage ratios looks at the balance between loans and shares in a business, how v r using our debts for the growth of the firm 5)Market value ratio is used to determine if a company is over or undervalued
Liquidity ratios Aims at finding How solvent the business is? Deals with current assets n current liabilities
---For every 1Re of a firms current obligations, firm has 2Rs ---Current assets normally includes cash , bank balance, marketable securities, accounts receivable and inventories. Current liabilities consist of accounts payable, short term notes payable, short-term loans, current maturities of long term debt, accrued income taxes and other accrued expenses ---More the current ratio, more is the stability of a firm
If we look at the current ratios of both the firms, the liquidity position is better in case of B as compared to A. because a slight decline in value of assets of firm A, will adversely affect the ability of a firm A to meet its obligations.
Quick current assets are those assets that are quickly converted into cash and they are compared with current liabilities. Quick assets are- cash, bank balance, recivables etc
Cash equivalents are short-term investments, such as Treasury bills, that can be quickly converted to cash. i.E it is the money which is left in our hand once we pay the debts
COGS- cost of goods sold (year) Example: a business has $ 2,500 in accounts payable, $ 12,500 in cost of goods sold. Days payable outstanding = (2,500 / 12,500) * 365 = 73 days
We are done with the liquidity ratios, next is activity ratios Under these ratios we will b studying various imp ratios ……
It is also known as debtors collection period -On the other hand, too low “collection period” is not necessarily favorable, rather it may indicate a very restrictive credit and collection policy which may affect profit. Debtors- is the amount of money owed
i.E how quickly we convert our inventories to sales Opening stock is nothing but the finished goods which can be sold as our end product and any stock which remains during the first year becomes the ending stock for 1 st year and opening for the 2 nd year.,
Asset turnover gives the relationship between sales and assets. The firm should manage its assets efficiently to maximise sales.
==Cash turn over indicates a firms efficiency in its use of cash for generation of sales revenue. == accounts recievables turnover measures the efficiency of business in collecting its credit sales ==Fixed assets- furniture, property, house, lands Accounts payable turnover measures the speed with which a company pays its suppliers . If the turnover ratio declines from one period to the next, this indicates that the company is paying its suppliers more slowly, and may be an indicator of worsening financial condition
The working capital turnover ratio measure the efficiency with which the working capital is being used by a firm. A high ratio indicates efficient utilization of working capital and a low ratio indicates otherwise. But a very high working capital turnover ratio may also mean lack of sufficient working capital which is not a good situation.
An operating cycle is very important as it defines how a company uses its cash to produce a product or provide services. It starts and end with cash. It is the time period involves in the conversion of raw material into finished goods including d credit period. == suppose on 1 st jan we purchase raw material, it takes 1month to convert them into finished goods i.e 1 feb,, on 1feb the goods are ready n they r kept in stock fr anothr 1month as thr is no demnd rite now i.e upto 1march,, thn on 1 st march, goods r being sold to customers on credit,, afta a month i.e 1 st april,, v get the money from customers n d revenue we got will b used to buy another raw materials. So operating cycle is of 3months
Leverage is The amount of debt that has been used to finance activities. A company with much more debt than equity is generally called "highly leveraged."
-It measures how well a company can meet its interest expense obligations. -Higher value of times interest earned ratio is favourable i.e greater ability of a business to repay its interest and debts. Lower values are unfavourable. In general, times interest earned ratio of 1.5 or below is unsafe. If TIE = 1 all the income is used to pay debts n interests If TIE= 10 that means one tenth of income is used to service the debts
- It is the ratio of (the sum of current liabilities and long-term liabilities) and (the sum of current assets, fixed assets) -If the ratio is less than 0.5, most of the company's assets are financed through equity. If the ratio is greater than 0.5, most of the company's assets are financed through debt
Profitability is the ability of a business to earn profit over a period of time. Although the profit figure is the starting point for any calculation of cash flow, as already pointed out, profitable companies can still fail for a lack of cash. Note: Without profit, there is no cash and therefore profitability must be seen as a critical success factors. A company should earn profits to survive and grow over a long period of time. Profits are essential, but it would be wrong to assume that every action initiated by management of a company should be aimed at maximising profits, irrespective of social consequences. The ratios examined previously have tendered to measure management efficiency and risk. Profitability is a result of a larger number of policies and decisions. The profitability ratios show the combined effects of liquidity, asset management (activity) and debt management (gearing) on operating results. The overall measure of success of a business is the profitability which results from the effective use of its resources.
Interpretation: Obviously the higher the profit margin a business makes the better. However, the level of gross profit margin made will vary considerably between different markets. For example the amount of gross profit percentage put on clothes, (especially fashion items), is far higher than that put on food items. So any result gained must be looked at in the context of the industry in which the firm operates.
Interpretation: As with gross profit, a higher percentage result is preferred. This is used to establish whether the firm has been efficient in controlling its expenses. It should be compared with previous years’ results and with other companies in the same industry to judge relative efficiency. The net profit margin should also be compared with the gross profit margin. For if the gross profit margin has improved but the net profit margin declined, this shows that profits made on trading are becoming better, however the expenses incurred in the running of the business are also increasing but at a faster rate than profits. Thus efficiency is declining.
Income is earned by using the assets of a business productively. The more efficient the production, the more profitable the business. The rate of return on total assets indicates the degree of efficiency with which management has used the assets of the enterprise during an accounting period. This is an important ratio for all readers of financial statements. Investors have placed funds with the managers of the business. The managers used the funds to purchase assets which will be used to generate returns. If the return is not better than the investors can achieve elsewhere, they will instruct the managers to sell the assets and they will invest elsewhere. The managers lose their jobs and the business liquidates.
et income is for the full fiscal year (before dividends paid to common stock holders but after dividends to preferred stock.) Shareholder's equity does not include preferred shares.
Whatever income remains in the business after all prior claims, other than owners claims (i.e. ordinary dividends) have been paid, will belong to the ordinary shareholders who can then make a decision as to how much of this income they wish to remove from the business in the form of a dividend, and how much they wish to retain in the business. The shareholders are particularly interested in knowing how much has been earned during the financial year on each of the shares held by them.
Now we come to another head of the kinds of ratios. That is Market Value Ratios These ratios indicate the relationship of the firm’s share price to dividends and earnings. Note that when we refer to the share price, we are talking about the Market value and not the Nominal value as indicated by the par value. For this reason, it is difficult to perform these ratios on unlisted companies as the market price for their shares is not freely available. One would first have to value the shares of the business before calculating the ratios. Market value ratios are strong indicators of what investors think of the firm’s past performance and future prospects.
The dividend yield ratio indicates the return that investors are obtaining on their investment in the form of dividends. This yield is usually fairly low as the investors are also receiving capital growth on their investment in the form of an increased share price. It is interesting to note that there is strong correlation between dividend yields and market prices. Invariably, the higher the dividend, the higher the market value of the share.
P/E ratio is a useful indicator of what premium or discount investors are prepared to pay or receive for the investment. The higher the price in relation to earnings, the higher the P/E ratio which indicates the higher the premium an investor is prepared to pay for the share. This occurs because the investor is extremely confident of the potential growth and earnings of the share High P/E generally reflects lower risk and/or higher growth prospects for earnings