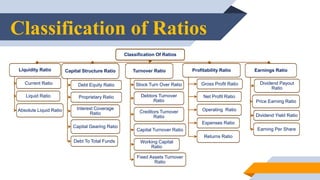
1) Ratio analysis involves calculating and analyzing various financial ratios to evaluate a company's liquidity, capital structure, asset management efficiency, profitability, and market performance.
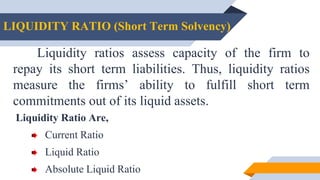
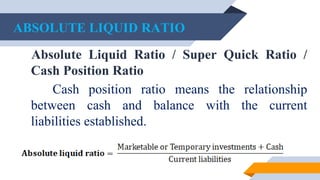
2) Key ratios include the current ratio and quick ratio to measure liquidity, debt-to-equity ratio to analyze capital structure, inventory and fixed asset turnover ratios for efficiency, and profit margins, return on equity, and earnings per share for profitability.
3) Calculating and comparing ratios over time and against industry benchmarks provides insights into a company's financial health and operating trends.