SlideShare a Scribd company logo
RATIO ANALYSIS                                                     1

                        RATIO ANALYSIS
                                           Analysis
                          Meaning of Ratio Analysis
       Ratio analysis is a very important tool of financial analysis. It is the
process of establishing the significant relationship between the items of
financial statement to provide a meaningful understanding of the
performance and financial position of a firm. Ratio when calculated on the
basis of accounting information are called ‘Accounting Ratio’.

Definitions:
      Kennedy and Mc Mulla. “The relationship of one to another,
expressed in simple term of mathematical is know as ratio”
      According to Accountant’s Handbook by Wixon, kell and Bedford, a
ratio “is an expression of the quantitative relationship between two
numbers”.

                                               Analysis
                              Nature of Ratio Analysis
        Ratio analysis is a technique of analysis and interpretation of financial
statements. It is the process of establishing and interpreting various ratios for
helping in making certain decisions. However, ratio analysis is not an end in
itself. It is only a means of better understanding of financial strengths and
weakness of a firm. There are a number of ratios which can be calculated
from the given information given in the financial statements, but the analyst
has to select the appropriate data and calculate only a few appropriate ratios
from the same keeping in mind the objectives of analysis. The following are
the four steps involved in the ratio analysis:
        (i)      Selection of relevant data from the financial statements
                 depending upon the objective of the analysis.
        (ii)     Calculation of appropriate from the above data.
        (iii)    Comparison of the calculated ratios with the ratios of the
                 same firm in the past, or the ratios developed from the
                 projected financial statements or the ratios of some other
                 firms or the comparison with ratios of the industry to which
                 the firm belongs.
        (iv)     Interpretation of the ratios.


         Tutorial.                  School,
National Tutorial. Opp. Future Pack School, Upper Gadigarh,Jammu.
    0191-
Ph. 0191-2262243 Mob. 9796228700, 9697664266, 9086036666
RATIO ANALYSIS                                                       2

          Uses/Significance/Objects
          Uses/Significance/Objects or importance of ratio analysis
              /Signif

       The ratio analysis is one of the most powerful tools of financial
analysis. It is used as a device to analyse and interpret the financial health of
the enterprise, just like a doctor examines the patient by recording his body
temperature, blood pressure, etc. before making his conclusion regarding the
illness and before giving his treatment, a financial analyst analyses the
financial statements with various tools of analysis before commencing upon
the health or weakness of an enterprise. ‘A ratio is known as a symptom like
blood pressure, the pulse rate or the temperature of an individual.’
    (A)Usefulness for short term creditors. Short term creditors are trade
        creditors, bills payables, creditors for expenses etc. The concern pays
        short term creditors out of its current assets. If the current assets are
        quit4e sufficient to meet current liabilities then the creditor will not
        hesitate in extending credit facilities. Current and acid-test ratios will
        give an idea about the current financial position of the concern.
    (B) Usefulness for long term creditors. Long term creditors are financial
        institutions, debenture holders, mortgage creditors etc. are interested
        in analysing the capacity of the unit of repay periodical interest, and
        repayment of loan on schedule.
    (C) Usefulness to Employees. The employees are also interested in the
        financial position of the concern. Their wages increases and amount
        of fringe benefits are related to the volume of profits earned by the
        concern. The employees make use of information available in
        financial statement. Various profitability ratios relating to gross profit,
        operating ratio, net profit, etc. enable employees to put forward their
        viewpoint for the increase of wages and other benefits.
    (D)Usefulness to the Government. Government is interested in the
        financial information of the units both at macro as well as micro
        levels. Individual unit’s information regarding production, sales and
        profit is required for exercise duty, sales tax and income tax purposes.
        Group information for the industry is required for formulating
        national policies and planning. In the absence of dependable
        information, govt. plans and policies may not achieve desired results.
        Government is interested to know the overall strength of the industry.
        The ration may be used as indicators of overall strength of public as
        well as private sector. In the absence if the reliable economic
        information, governmental plans policies may not prove successful.


         Tutorial.                  School,
National Tutorial. Opp. Future Pack School, Upper Gadigarh,Jammu.
    0191-
Ph. 0191-2262243 Mob. 9796228700, 9697664266, 9086036666
RATIO ANALYSIS                                                3

  (E) Usefulness for investors. Investor’s first interest will be the security
      of his investment and then a return in the form of dividend or interest.
      The investors can determine the magnitude and direction of the
      movement in firm’s earnings with the help of profitability ratios such
      as earning per share, dividend yield, etc. After analyzing the relevant
      ratios the present investors can decide whether to hold, sell or
      purchase the shares and the prospective investor can decide whether
      or not to buy the shares.
  (F) Usefulness to the management

        (i)     Decision-making: Financial statements are prepared
                primarily for decision making. Ratios help in high-lighting
                the areas of deserving attention and corrective action thus
                facilitating decision making.
        (ii)    Financial forecasting and planning: Planning and
                forecasting can be done only by knowing the past and the
                present. Planning is looking ahead and the ratios calculated
                for a number of years work as a guide for the future.
                Meaningful conclusions can be drawn for future from these
                ratios.
        (iii)   Communication: The financial strength and the weakness
                of a firm are communicated in a more easy and
                understandable manner by use of ratios.
        (iv)    Co-ordination is facilitated: Ratio even help in co-
                ordination which is of outmost importance in effective
                business management. Better communication of efficiency
                and weakness of an enterprise results in better co-ordination
                in the enterprise.
        (v)     Control is more effective: Ratio analysis even help in
                making effective control of the business. Standard ratio can
                be based upon proforma financial statements and variances
                or deviations, if any, can be found by comparing the actual
                with the standards so as to take a corrective action at the
                right time. The weakness or otherwise, if any, come to the
                knowledge of the management which helps in effective
                control of the business.
        (vi)    Other Uses: There are so many uses of ratio analysis. It is
                an essential part of the budgetary control and standard
                costing. Ratios are of immense importance in the analysis

         Tutorial.                  School,
National Tutorial. Opp. Future Pack School, Upper Gadigarh,Jammu.
    0191-
Ph. 0191-2262243 Mob. 9796228700, 9697664266, 9086036666
RATIO ANALYSIS                                                    4

               and interpretation of financial statements as they bring the
               strength or weakness of a firm.

  Guidelines/Precautions/Factors considered while undertaking Ratio
                              Analysis.

  1. Quality/Accuracy of Financial Statement: The ratios are calculated
     from the data available in financial statements. The reliability of ratios
     is linked to the accuracy of information in these statements. Before
     calculating ratios one should see whether proper concepts and
     conventions have been used for preparing financial or not.
  2. Objectives/purposes of Analysis: The type of ratios to be calculated
     will depend upon the purposes for which are required. The purpose of
     user is also important for the analysis of ratios. Creditors, a banker, an
     investor, a shareholder, all have different objects for studying ratios.
     The purpose or object for which ratios are required to be studied
     should always be kept in mind for studying various ratios. Different
     objects may require the study of different ratios.
  3. Selection of Ratios: Another precaution in ratio analysis is the proper
     selection of appropriate ratios. The ratios should match the purpose
     for which these are required. Only those ratios should be selected
     which can throw proper light on the matter to be discussed.
  4. Use of standards: The ratios will give an indication of financial
     position only when discussed with reference to certain standards.
     These standard may be rule of thumb as in case of current ratio (2:1)
     and acid-test ratio (1:1), may be industry standards, may be budgeted
     or projected ratios, etc.
  5. Capability of the analyst: Analysis is a tool in the hands of analyst.
     Knife in the hands of criminal may take the life but the knife in the
     hands of a surgeon may give new life to a patient. Interpretation
     depends on the educational background; professional skill; experience
     and intuition of the professional conducting it.
  6. Ratio to be used only as guide: Ratios can provide, at the best, the
     starting point. The analyst, before arriving at the conclusion, should
     take into consideration all other relevant factors financial and non-
     financial; macro and micro.


         Tutorial.                  School,
National Tutorial. Opp. Future Pack School, Upper Gadigarh,Jammu.
    0191-
Ph. 0191-2262243 Mob. 9796228700, 9697664266, 9086036666
RATIO ANALYSIS                                                  5

                    Advantages of Ratio Analysis

    Following are some of the advantages of ratio analysis:
         1. Simplifies financial statements. Ratio analysis simplifies the
            comprehension of financial statements. Ratios tell the whole
            story of changes in the financial condition of a business.
         2. Facilitates inter firm comparison. Analysis provides data for
            inter firm comparison. Ratios high-light the factors associated
            with successful and unsuccessful firms. They also reveal strong
            firms and weak firms, overvalued and undervalued firms.
         3. Makes inter-firm comparison possible. Ratio analysis also
            makes possible comparison of the performance of the different
            of the firm. The ratios are helpful in deciding about their
            efficiency or otherwise in the past and likely performance in the
            future.
         4. Helps in planning. Ratio analysis helps in planning and
            forecasting. Over a period of time a firm or industry develops
            certain norms that may indicate future success or failure.
                   Thus ratios can assist management in its basic function of
                   forecasting, planning, co-ordination, control and
                   communication.

                LIMITATIONS OF RATIO ANALYSIS

       The ratio analysis is one of the most powerful tools of the financial
management. Ratio analysis is a widely used and useful technique to
evaluate the financial position and performance of any business unit but it
suffers from a number of limitations. These limitations must be kept in mind
by the analyst while using this technique.
       1. Limited use of a Single Ratio: A single ratio, usually, does not
          convey much of a sense. To make a better interpretation a number
          of ratios have to be calculated which is likely to confuse the
          analyst than help him to in making any meaningful conclusion.
       2. Lack of adequate standards: There are no well accepted
          standards or rules of thumb for all ratios which can be accepted as
          norms. It renders interpretation of the ratios difficult.
       3. Inherent Limitation of accounting: Like financial statements,
          ratios also suffer from the inherent weakness of accounting records


         Tutorial.                  School,
National Tutorial. Opp. Future Pack School, Upper Gadigarh,Jammu.
    0191-
Ph. 0191-2262243 Mob. 9796228700, 9697664266, 9086036666
RATIO ANALYSIS                                                     6

         such as their historical nature. Ratios of the past are not necessary
         true indicators of the future.
      4. Change of accounting procedure: Change in accounting
         procedure by a firm often makes ratio analysis misleading, e.g., a
         change in the valuation of methods of inventories, from FIFO to
         LIFO increases the cost of sales and reduces considerably the value
         of closing stocks which makes stock turnover ratio to be lucrative
         and an unfavourable gross profit ratio.
      5. Personal Bias: Ratios are only means of financial analysis and not
         an end in itself. Ratios have to be interpreted and different people
         may interpret the same ratio in different ways.
      6. Uncomparable: Not only industries differ in their nature but also
         the firms of the similar business widely differ in their size and
         accounting procedures, etc. It makes comparison of ratios difficult
         and misleading. Moreover, comparisons are made difficult due to
         differences in definition of various financial terms used in the ratio
         analysis.
      7. Absolute Figures Distortive: Ratio devoid of absolute figures
         may prove distortive as ratio analysis is primarily a quantitative
         analysis and not a qualitative analysis.
      8. Price level Changes: While making ratio analysis, no
         consideration is made to the changes in price levels and this makes
         the interpretation of ratio invalid.
      9. Ratios no Substitutes: Ratio analysis is merely a tool of financial
         statements. Hence, ratios become useless if separated from the
         statements from which they are computed.
      10.Clues not Conclusions: Ratios provide only clues to analysts and
         not final conclusions. These ratios to be interpreted by these
         experts and there are no standard rules for interpretation.


                  CLASSIFICATION OF RATIOS


      The use of ratio analysis is not confined to financial manager only.
There are different parties interested in the ratio analysis for knowing the
financial position of a firm for different purposes.


         Tutorial.                  School,
National Tutorial. Opp. Future Pack School, Upper Gadigarh,Jammu.
    0191-
Ph. 0191-2262243 Mob. 9796228700, 9697664266, 9086036666
RATIO ANALYSIS                                                         7


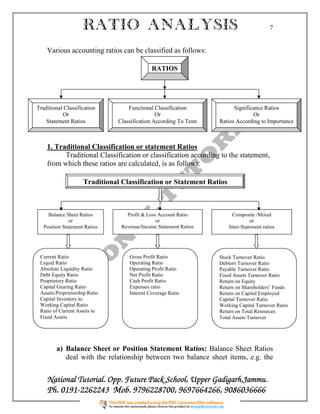
    Various accounting ratios can be classified as follows:

                                              RATIOS


Traditional Classification          Functional Classification             Significance Ratios
           Or                                   Or                                Or
    Statement Ratios            Classification According To Tests   Ratios According to Importance


    1. Traditional Classification or statement Ratios
          Traditional Classification or classification according to the statement,
    from which these ratios are calculated, is as follows:

                     Traditional Classification or Statement Ratios


     Balance Sheet Ratios          Profit & Loss Account Ratio            Composite /Mixed
               or                               or                                or
   Position Statement Ratios     Revenue/Income Statement Ratios        Inter-Statement ratios


 Current Ratio                      Gross Profit Ratio              Stock Turnover Ratio
 Liquid Ratio                       Operating Ratio                 Debtors Turnover Ratio
 Absolute Liquidity Ratio           Operating Profit Ratio          Payable Turnover Ratio
 Debt Equity Ratio                  Net Profit Ratio                Fixed Assets Turnover Ratio
 Proprietory Ratio                  Cash Profit Ratio               Return on Equity
 Capital Gearing Ratio              Expenses ratio                  Return on Shareholders’ Funds
 Assets-Proprietorship Ratio        Interest Coverage Ratio         Return on Capital Employed
 Capital Inventory to                                               Capital Turnover Ratio
 Working Capital Ratio                                              Working Capital Turnover Ratio
 Ratio of Current Assets to                                         Return on Total Resources
 Fixed Assets                                                       Total Assets Turnover


        a) Balance Sheet or Position Statement Ratios: Balance Sheet Ratios
           deal with the relationship between two balance sheet items, e.g. the


             Tutorial.                  School,
    National Tutorial. Opp. Future Pack School, Upper Gadigarh,Jammu.
        0191-
    Ph. 0191-2262243 Mob. 9796228700, 9697664266, 9086036666
RATIO ANALYSIS                                                         8

              ratio of current assets to current liabilities, or the ratio of proprietors’
              funds to fixed assets.
           b) Profit and Loss Account or Revenue/Income Statement Ratios:
              These ratios deals with the relationship between two profit and losses
              account items, e.g., the ratio of gross profit to sales, or the ratio of net
              profit to sales.
           c) Composite/mixed ratios or Inter Statement Ratios: These ratios
              exhibit the relation between a profit and loss account or income
              statement item and balance sheet item, e.g., stock turnover ratio, or the
              ratio of total assets to sales. The most commonly used inter-statement
              ratios are given in the chart exhibiting traditional classification or
              statement ratios.

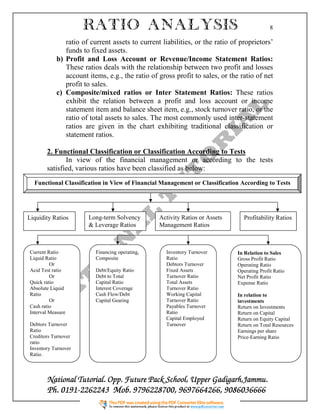
       2. Functional Classification or Classification According to Tests
              In view of the financial management or according to the tests
       satisfied, various ratios have been classified as below:
  Functional Classification in View of Financial Management or Classification According to Tests


Liquidity Ratios      Long-term Solvency        Activity Ratios or Assets      Profitability Ratios
                      & Leverage Ratios         Management Ratios


Current Ratio            Financing operating,      Inventory Turnover        In Relation to Sales
Liquid Ratio             Composite                 Ratio                     Gross Profit Ratio
         Or                                        Debtors Turnover          Operating Ratio
Acid Test ratio          Debt/Equity Ratio         Fixed Assets              Operating Profit Ratio
         Or              Debt to Total             Turnover Ratio            Net Profit Ratio
Quick ratio              Capital Ratio             Total Assets              Expense Ratio
Absolute Liquid          Interest Coverage         Turnover Ratio
Ratio                    Cash Flow/Debt            Working Capital           In relation to
         Or              Capital Gearing           Turnover Ratio            investments
Cash ratio                                         Payables Turnover         Return on Investments
Interval Measure                                   Ratio                     Return on Capital
                                                   Capital Employed          Return on Equity Capital
Debtors Turnover                                   Turnover                  Return on Total Resources
Ratio                                                                        Earnings per share
Creditors Turnover                                                           Price-Earning Ratio
ratio
Inventory Turnover
Ratio.


                Tutorial.                  School,
       National Tutorial. Opp. Future Pack School, Upper Gadigarh,Jammu.
           0191-
       Ph. 0191-2262243 Mob. 9796228700, 9697664266, 9086036666
RATIO ANALYSIS                                                          9


   a) Liquidity Ratios: These are the ratios which measure the short-term
      solvency or financial position of a firm. These ratios are calculated to
      comment upon the short-term paying capacity of a concern or the
      firm’s ability to meet its current obligations. The various liquidity
      ratios are current ratio, liquidity ratio ad absolute liquid ratio.
   b) Long-term Solvency and Leverage Ratios: These are meant for
      testing long-term financial soundness of any unit. Primarily, these
      establish and study relationship between owned funds and loaned
      funds. For example, debt-equity ratio, capital gearing ratio etc., are
      covered under this group.
The leverage ratios can further be classified as:
          (i)    Financial leverage.
          (ii) Operating Leverage.
          (iii) Composite Leverage.
   c) Activity Ratios: Activity ratios are calculated to measure the
      efficiency with which the resources of a firm have been employed.
      These ratios are also called turnover ratios because they indicate the
      speed with which assets are being turned over into sales, e.g., debtors
      turnover ratio. The various activity or turnover ratios have been
      named in the chart classifying the ratios.
   d) Profitability Ratios: These ratios are measure the working results of
      the unit during the accounting period. Profits are compared with sales
      level and investment level. The various profitability ratio have been
      given in the chart exhibiting the classification of ratios according to
      test. Generally, two types of profitability ratios are calculated:
          (i)    In relation to sales
          (ii) In relation to investments.
3. Classification According to Significance or Importance
       The ratios have also been classified according to their significance or
importance. Some ratios are more important than others and the firm may classify
them as primary and secondary ratios. The British Institute of Management has
recommended the classification of ratio according to importance for inter-firm
comparisons. For inter-firm comparisons, the ratios may be classified as Primary
Ratios and Secondary Ratios. The primary ratio is one which is of the prime
importance to a concern; thus return on capital employed is named as primary
ratio. The other ratios which support or explain the primary ratio are called
secondary ratios, e.g., the relationship of opening profit to sales or the relationship
of sales to total assets of the firm.


         Tutorial.                  School,
National Tutorial. Opp. Future Pack School, Upper Gadigarh,Jammu.
    0191-
Ph. 0191-2262243 Mob. 9796228700, 9697664266, 9086036666
RATIO ANALYSIS                                                  10

List of current assets and current liabilities.

Current Assets                              Current Liabilities
Cash-in-Hand                                Sundry Creditors
Cash-at-Bank                                Bills Payable
Bills Receivable                            Outstanding Expenses
Sundry Debtors                              Bank Overdraft
  Less Provision for Bad debt               Taxes Payable
Marketable Securities                       Dividend Payable
Temporary Investments                       Short-term advances
Stock:                                      Income received in advance
       Raw Materials                        Income tax Payable
       Work-in-Progress
       Finished Goods
Short-term investments
Recoverable Advances
Prepaid Expenses
Accrued Incomes
Advance Taxes

(I) LIQUIDITY RATIO:
Current Ratio = Current Assets
               Current Liabilities
Current Assets = Total assets Fixed assets
                         Or
               = Working Capital + Current liabilities

Liquidity Ratio/Quick Ratio/Acid Test Ratio = Liquid Assets/Quick Assets
                                                  Current Liabilities
Liquid assets/Quick Assets = Current assets Stock     Prepaid Expenses

(II) SOLVENCY RATIO/CAPITAL STRUCTURE RATIO/TEST OF
LONG TERM SOLVENCY:
Debt equity Ratio =          Long Term Debts
                     Total Shareholder’s Funds
Long term debts = Debentures + other long term loans
Shareholder’s Funds = Equity Share Capital + Preference Share Capital + Reserve &
Surplus + Profit & Loss account    Preliminary expenses    Fictitious Assets
Proprietary Ratio/Ratio of owner equity to total assets = Proprietor’s Funds
                                                             Total Assets
Total Assets to Debt Ratio = Total Assets
                          Long Term debts
         Tutorial.                  School,
National Tutorial. Opp. Future Pack School, Upper Gadigarh,Jammu.
    0191-
Ph. 0191-2262243 Mob. 9796228700, 9697664266, 9086036666
RATIO ANALYSIS                                               11

(III) ACTIVITY RATIO/TURNOVER RATIO/PERFORMANCE
RATIO/EFFICIENCY RATIO:
Stock Turnover Ratio = Cost of Goods Sold
                           Average Stock
Debtors/Receivable turnover Ratio = Net Credit Sale
                                    Average debtors
Creditors/Payable turnover Ratio = Net Credit Purchase
                                     Average Creditors
Working Capital turnover Ratio = Cost of Goods sold/Net Sales
                                      Net Working Capital
Fixed Assets turnover Ratio = Cost of Goods Sold/Net Sales
                                    Net Fixed Assets
Current Assets turnover ratio = Cost of Goods Sold/Net Sales
                                      Current assets
Cost of Goods sold = Net Sales Gross Profit
Net Credit sales = Total sales Cash sale       Sales return
Net Credit Purchase = Total Purchase Cash purchase Returns
Total Debtors = Sundry Debtors + B/R Provision for doubtful debts
Total Creditors = Sundry creditors + Bills Payable
Net Working Capital = Total Current assets Total Current Liabilities
Net Fixed assets = Total Assets Current Assets
Current Assets = Total Assets Fixed assets

(IV) PROFITABILITY RATIO:
Gross Profit Ratio/Gross Margin Ratio = Gross Profit
                                          Net Sales X 100
Net Profit Ratio = Net Profit(after tax)
                       Net Sales         X 100
Operating Ratio = Total Operating Cost
                                         X 100
                      Net Sales
Operating Profit Ratio = Operating Profit
                           Net Sales       X 100
Return on Capital Employed/Return on Investment =
                   = Net Profit before Tax & Dividend
                                                        X 100
                            Capital Employed
Earning Per Share(EPS) = Net Profit (after tax & Preference dividend)
                                No. of Equity Shares                  X 100
Dividend Per Share(DPS) = Dividend paid to equity shareholder
                                                                 X 100
                                Number of equity shares

         Tutorial.                  School,
National Tutorial. Opp. Future Pack School, Upper Gadigarh,Jammu.
    0191-
Ph. 0191-2262243 Mob. 9796228700, 9697664266, 9086036666
RATIO ANALYSIS                                                  12

Price Earning Ratio(PER) = Current Marketable Equity of Equity Share
                                     Earning Per Share               X 100


Gross Profit = Net Sale Cost of Goods Sold
Net profit = Net operating Profit + Non Operating Income Non operating
Expenses
Net Profit = Gross Profit + All other incomes All expenses
Operating Cost = Cost of Goods Sold + Office & Administration Expenses +
Selling & Distribution Expenses + Financial Expenses + Repair and Maintenance
Operating Profit = Net Sales Operating Cost
Operating Expenses = Administration + Selling Expenses

Where Capital Employed = Share Capital (Equity + Preference) + Reserves
and Surplus + Long-term Loans – Fictitious Assets

                                     Or

Capital Employed = Fixed Assets + Current Assets – Current Liabilities

Shareholders’ Funds = Equity Share Capital + Reserves and Surplus –
Fictitious Assets

Fictitious Assets = Underwriting Commission + Preliminary Expenses +
Discount or Loss on Issue of Shares/Debentures and miscellaneous Expenses

Return on Investment or Return on Capital Employed: This ratio shows
the relationship between the profit earned before interest and tax and the
capital employed to earn such profit.
Return on Equity: Return on equity is also known as return on
shareholders’ investment. The ratio establishes relationship between profits
available to equity shareholders with equity shareholders’ funds.
Earning Per Share: Earning per share is calculated by dividing the net
profit (after interest, tax and preference dividend) by the number of equity
shares.
                                THOUGHT
      Education is not the filling of a pail, but the lighting of
      Education
a fire.

         Tutorial.                  School,
National Tutorial. Opp. Future Pack School, Upper Gadigarh,Jammu.
    0191-
Ph. 0191-2262243 Mob. 9796228700, 9697664266, 9086036666

More Related Content

What's hot

Ratio analysis
Ratio analysisRatio analysis
Ratio analysis
Dr V GURUMOORTHI
 
Ratio Analysis Ppt
Ratio Analysis PptRatio Analysis Ppt
Ratio Analysis PptMobasher Ali
 
Ratio analysis-ppt-1
Ratio analysis-ppt-1Ratio analysis-ppt-1
Ratio analysis-ppt-1
abhi78640
 
Funds flow statement
Funds flow statement Funds flow statement
Funds flow statement Suresh Vadde
 
Ratio Analysis
Ratio AnalysisRatio Analysis
Ratio Analysis
Rahul Sisodia
 
Ratio analysis
Ratio analysisRatio analysis
Ratio analysis
Nikita Arora
 
accounts ppt on ratio analysis
accounts ppt on ratio analysisaccounts ppt on ratio analysis
accounts ppt on ratio analysisvaishali_bansal
 
Report on ratio analysis
Report on ratio analysisReport on ratio analysis
Report on ratio analysisjcakj
 
financial analysis
financial analysisfinancial analysis
financial analysis
Shwetanshu Gupta
 
Cost audit1
Cost audit1Cost audit1
Cost audit1
jithin koshy
 
Altman zscore (Finance)
Altman zscore (Finance)Altman zscore (Finance)
Altman zscore (Finance)Jobin Mathew
 
Financial Statement Analysis
Financial Statement AnalysisFinancial Statement Analysis
Financial Statement Analysis
Home
 
Ratio Analysis
Ratio AnalysisRatio Analysis
Ratio Analysisyashpal01
 
Ratio analysis
Ratio analysisRatio analysis
Ratio analysis
Prasanth Khanna
 
Indian accounting standards
Indian accounting standardsIndian accounting standards
Indian accounting standards
anjalichaudhary75
 
Reserves and provisions
Reserves and provisionsReserves and provisions
Reserves and provisions
Byju Antony
 
Responsibility accounting
Responsibility  accountingResponsibility  accounting
Responsibility accountingKriti Avasthi
 
Trading Profit And Loss Account
Trading Profit And Loss AccountTrading Profit And Loss Account
Trading Profit And Loss AccountMarcus9000
 

What's hot (20)

Ratio analysis
Ratio analysisRatio analysis
Ratio analysis
 
Ratio analysis
Ratio analysisRatio analysis
Ratio analysis
 
Ratio Analysis Ppt
Ratio Analysis PptRatio Analysis Ppt
Ratio Analysis Ppt
 
Ratio analysis-ppt-1
Ratio analysis-ppt-1Ratio analysis-ppt-1
Ratio analysis-ppt-1
 
Funds flow statement
Funds flow statement Funds flow statement
Funds flow statement
 
Ratio Analysis
Ratio AnalysisRatio Analysis
Ratio Analysis
 
Ratio analysis
Ratio analysisRatio analysis
Ratio analysis
 
accounts ppt on ratio analysis
accounts ppt on ratio analysisaccounts ppt on ratio analysis
accounts ppt on ratio analysis
 
Report on ratio analysis
Report on ratio analysisReport on ratio analysis
Report on ratio analysis
 
financial analysis
financial analysisfinancial analysis
financial analysis
 
Cost audit1
Cost audit1Cost audit1
Cost audit1
 
Altman zscore (Finance)
Altman zscore (Finance)Altman zscore (Finance)
Altman zscore (Finance)
 
Financial Statement Analysis
Financial Statement AnalysisFinancial Statement Analysis
Financial Statement Analysis
 
Ratio Analysis
Ratio AnalysisRatio Analysis
Ratio Analysis
 
Ratio analysis
Ratio analysisRatio analysis
Ratio analysis
 
Indian accounting standards
Indian accounting standardsIndian accounting standards
Indian accounting standards
 
Reserves and provisions
Reserves and provisionsReserves and provisions
Reserves and provisions
 
Responsibility accounting
Responsibility  accountingResponsibility  accounting
Responsibility accounting
 
Trading Profit And Loss Account
Trading Profit And Loss AccountTrading Profit And Loss Account
Trading Profit And Loss Account
 
Du Pont Analysis
Du Pont AnalysisDu Pont Analysis
Du Pont Analysis
 

Similar to Ratio Analysis

Cs ratio analysis
Cs ratio analysisCs ratio analysis
Cs ratio analysis
Ajit Gupta
 
19 Ratio Analysis
19 Ratio Analysis19 Ratio Analysis
19 Ratio Analysis
Shaik Mohammad Imran
 
Importance of financial reporting analysis
Importance of financial reporting analysisImportance of financial reporting analysis
Importance of financial reporting analysis
yashikagupta48
 
Report on the Financial Ratios and IT Industry Analysis
Report on the Financial Ratios and IT Industry AnalysisReport on the Financial Ratios and IT Industry Analysis
Report on the Financial Ratios and IT Industry Analysis
Pushkar Metha, MBA
 
leac204.pdf
leac204.pdfleac204.pdf
leac204.pdf
Ashish Sharma
 
Ratio analysis project
Ratio analysis project Ratio analysis project
Ratio analysis project
Mallikarjuna Ramavath
 
financial statement bharath bag works nizamabad
 financial statement bharath bag works nizamabad financial statement bharath bag works nizamabad
financial statement bharath bag works nizamabad
saikrishnabachuwar
 
ACCOUNTING FOR ASSETS
ACCOUNTING FOR ASSETSACCOUNTING FOR ASSETS
ACCOUNTING FOR ASSETS
Robin Beregovska
 
Accounting For Management Unit 3
Accounting For Management Unit 3Accounting For Management Unit 3
Accounting For Management Unit 3
Amit Sarkar
 
Ratios Analysis
Ratios Analysis Ratios Analysis
Ratios Analysis
Ojas Narsale
 
Pooja 1
Pooja 1 Pooja 1
Pooja 1
Shami Zama
 
minor project on ratio analysis of "......"
minor project on ratio analysis of "......"minor project on ratio analysis of "......"
minor project on ratio analysis of "......"
Kh Corporate
 
Ratio analysis - Introduction
Ratio analysis - IntroductionRatio analysis - Introduction
Ratio analysis - Introduction
uma reur
 
Financial analysis on recession period conducted at mahindra & mahindra tractors
Financial analysis on recession period conducted at mahindra & mahindra tractorsFinancial analysis on recession period conducted at mahindra & mahindra tractors
Financial analysis on recession period conducted at mahindra & mahindra tractors
Projects Kart
 
Financial Analysis ch-2 (II).ppt
Financial Analysis ch-2 (II).pptFinancial Analysis ch-2 (II).ppt
Financial Analysis ch-2 (II).ppt
etebarkhmichale
 
Performance Analysis through Financial Modelling
Performance Analysis through Financial ModellingPerformance Analysis through Financial Modelling
Performance Analysis through Financial Modelling
BOHR International Journal of Finance and Market Research
 
Research project final
Research project finalResearch project final
Research project final
Kasthuri Phanindra
 

Similar to Ratio Analysis (20)

Cs ratio analysis
Cs ratio analysisCs ratio analysis
Cs ratio analysis
 
19 Ratio Analysis
19 Ratio Analysis19 Ratio Analysis
19 Ratio Analysis
 
Importance of financial reporting analysis
Importance of financial reporting analysisImportance of financial reporting analysis
Importance of financial reporting analysis
 
Report on the Financial Ratios and IT Industry Analysis
Report on the Financial Ratios and IT Industry AnalysisReport on the Financial Ratios and IT Industry Analysis
Report on the Financial Ratios and IT Industry Analysis
 
leac204.pdf
leac204.pdfleac204.pdf
leac204.pdf
 
Ratio analysis project
Ratio analysis project Ratio analysis project
Ratio analysis project
 
financial statement bharath bag works nizamabad
 financial statement bharath bag works nizamabad financial statement bharath bag works nizamabad
financial statement bharath bag works nizamabad
 
finance project.docx
finance project.docxfinance project.docx
finance project.docx
 
ACCOUNTING FOR ASSETS
ACCOUNTING FOR ASSETSACCOUNTING FOR ASSETS
ACCOUNTING FOR ASSETS
 
Accounting For Management Unit 3
Accounting For Management Unit 3Accounting For Management Unit 3
Accounting For Management Unit 3
 
Ratios Analysis
Ratios Analysis Ratios Analysis
Ratios Analysis
 
Pooja 1
Pooja 1 Pooja 1
Pooja 1
 
minor project on ratio analysis of "......"
minor project on ratio analysis of "......"minor project on ratio analysis of "......"
minor project on ratio analysis of "......"
 
Chapter 3,
Chapter 3,Chapter 3,
Chapter 3,
 
Project Report
Project ReportProject Report
Project Report
 
Ratio analysis - Introduction
Ratio analysis - IntroductionRatio analysis - Introduction
Ratio analysis - Introduction
 
Financial analysis on recession period conducted at mahindra & mahindra tractors
Financial analysis on recession period conducted at mahindra & mahindra tractorsFinancial analysis on recession period conducted at mahindra & mahindra tractors
Financial analysis on recession period conducted at mahindra & mahindra tractors
 
Financial Analysis ch-2 (II).ppt
Financial Analysis ch-2 (II).pptFinancial Analysis ch-2 (II).ppt
Financial Analysis ch-2 (II).ppt
 
Performance Analysis through Financial Modelling
Performance Analysis through Financial ModellingPerformance Analysis through Financial Modelling
Performance Analysis through Financial Modelling
 
Research project final
Research project finalResearch project final
Research project final
 

Recently uploaded

CLASS 11 CBSE B.St Project AIDS TO TRADE - INSURANCE
CLASS 11 CBSE B.St Project AIDS TO TRADE - INSURANCECLASS 11 CBSE B.St Project AIDS TO TRADE - INSURANCE
CLASS 11 CBSE B.St Project AIDS TO TRADE - INSURANCE
BhavyaRajput3
 
Sha'Carri Richardson Presentation 202345
Sha'Carri Richardson Presentation 202345Sha'Carri Richardson Presentation 202345
Sha'Carri Richardson Presentation 202345
beazzy04
 
Fish and Chips - have they had their chips
Fish and Chips - have they had their chipsFish and Chips - have they had their chips
Fish and Chips - have they had their chips
GeoBlogs
 
Students, digital devices and success - Andreas Schleicher - 27 May 2024..pptx
Students, digital devices and success - Andreas Schleicher - 27 May 2024..pptxStudents, digital devices and success - Andreas Schleicher - 27 May 2024..pptx
Students, digital devices and success - Andreas Schleicher - 27 May 2024..pptx
EduSkills OECD
 
Phrasal Verbs.XXXXXXXXXXXXXXXXXXXXXXXXXX
Phrasal Verbs.XXXXXXXXXXXXXXXXXXXXXXXXXXPhrasal Verbs.XXXXXXXXXXXXXXXXXXXXXXXXXX
Phrasal Verbs.XXXXXXXXXXXXXXXXXXXXXXXXXX
MIRIAMSALINAS13
 
The Roman Empire A Historical Colossus.pdf
The Roman Empire A Historical Colossus.pdfThe Roman Empire A Historical Colossus.pdf
The Roman Empire A Historical Colossus.pdf
kaushalkr1407
 
Model Attribute Check Company Auto Property
Model Attribute  Check Company Auto PropertyModel Attribute  Check Company Auto Property
Model Attribute Check Company Auto Property
Celine George
 
GIÁO ÁN DẠY THÊM (KẾ HOẠCH BÀI BUỔI 2) - TIẾNG ANH 8 GLOBAL SUCCESS (2 CỘT) N...
GIÁO ÁN DẠY THÊM (KẾ HOẠCH BÀI BUỔI 2) - TIẾNG ANH 8 GLOBAL SUCCESS (2 CỘT) N...GIÁO ÁN DẠY THÊM (KẾ HOẠCH BÀI BUỔI 2) - TIẾNG ANH 8 GLOBAL SUCCESS (2 CỘT) N...
GIÁO ÁN DẠY THÊM (KẾ HOẠCH BÀI BUỔI 2) - TIẾNG ANH 8 GLOBAL SUCCESS (2 CỘT) N...
Nguyen Thanh Tu Collection
 
How libraries can support authors with open access requirements for UKRI fund...
How libraries can support authors with open access requirements for UKRI fund...How libraries can support authors with open access requirements for UKRI fund...
How libraries can support authors with open access requirements for UKRI fund...
Jisc
 
Mule 4.6 & Java 17 Upgrade | MuleSoft Mysore Meetup #46
Mule 4.6 & Java 17 Upgrade | MuleSoft Mysore Meetup #46Mule 4.6 & Java 17 Upgrade | MuleSoft Mysore Meetup #46
Mule 4.6 & Java 17 Upgrade | MuleSoft Mysore Meetup #46
MysoreMuleSoftMeetup
 
Thesis Statement for students diagnonsed withADHD.ppt
Thesis Statement for students diagnonsed withADHD.pptThesis Statement for students diagnonsed withADHD.ppt
Thesis Statement for students diagnonsed withADHD.ppt
EverAndrsGuerraGuerr
 
1.4 modern child centered education - mahatma gandhi-2.pptx
1.4 modern child centered education - mahatma gandhi-2.pptx1.4 modern child centered education - mahatma gandhi-2.pptx
1.4 modern child centered education - mahatma gandhi-2.pptx
JosvitaDsouza2
 
Basic phrases for greeting and assisting costumers
Basic phrases for greeting and assisting costumersBasic phrases for greeting and assisting costumers
Basic phrases for greeting and assisting costumers
PedroFerreira53928
 
Supporting (UKRI) OA monographs at Salford.pptx
Supporting (UKRI) OA monographs at Salford.pptxSupporting (UKRI) OA monographs at Salford.pptx
Supporting (UKRI) OA monographs at Salford.pptx
Jisc
 
Overview on Edible Vaccine: Pros & Cons with Mechanism
Overview on Edible Vaccine: Pros & Cons with MechanismOverview on Edible Vaccine: Pros & Cons with Mechanism
Overview on Edible Vaccine: Pros & Cons with Mechanism
DeeptiGupta154
 
The approach at University of Liverpool.pptx
The approach at University of Liverpool.pptxThe approach at University of Liverpool.pptx
The approach at University of Liverpool.pptx
Jisc
 
The Challenger.pdf DNHS Official Publication
The Challenger.pdf DNHS Official PublicationThe Challenger.pdf DNHS Official Publication
The Challenger.pdf DNHS Official Publication
Delapenabediema
 
ESC Beyond Borders _From EU to You_ InfoPack general.pdf
ESC Beyond Borders _From EU to You_ InfoPack general.pdfESC Beyond Borders _From EU to You_ InfoPack general.pdf
ESC Beyond Borders _From EU to You_ InfoPack general.pdf
Fundacja Rozwoju Społeczeństwa Przedsiębiorczego
 
Ethnobotany and Ethnopharmacology ......
Ethnobotany and Ethnopharmacology ......Ethnobotany and Ethnopharmacology ......
Ethnobotany and Ethnopharmacology ......
Ashokrao Mane college of Pharmacy Peth-Vadgaon
 
The geography of Taylor Swift - some ideas
The geography of Taylor Swift - some ideasThe geography of Taylor Swift - some ideas
The geography of Taylor Swift - some ideas
GeoBlogs
 

Recently uploaded (20)

CLASS 11 CBSE B.St Project AIDS TO TRADE - INSURANCE
CLASS 11 CBSE B.St Project AIDS TO TRADE - INSURANCECLASS 11 CBSE B.St Project AIDS TO TRADE - INSURANCE
CLASS 11 CBSE B.St Project AIDS TO TRADE - INSURANCE
 
Sha'Carri Richardson Presentation 202345
Sha'Carri Richardson Presentation 202345Sha'Carri Richardson Presentation 202345
Sha'Carri Richardson Presentation 202345
 
Fish and Chips - have they had their chips
Fish and Chips - have they had their chipsFish and Chips - have they had their chips
Fish and Chips - have they had their chips
 
Students, digital devices and success - Andreas Schleicher - 27 May 2024..pptx
Students, digital devices and success - Andreas Schleicher - 27 May 2024..pptxStudents, digital devices and success - Andreas Schleicher - 27 May 2024..pptx
Students, digital devices and success - Andreas Schleicher - 27 May 2024..pptx
 
Phrasal Verbs.XXXXXXXXXXXXXXXXXXXXXXXXXX
Phrasal Verbs.XXXXXXXXXXXXXXXXXXXXXXXXXXPhrasal Verbs.XXXXXXXXXXXXXXXXXXXXXXXXXX
Phrasal Verbs.XXXXXXXXXXXXXXXXXXXXXXXXXX
 
The Roman Empire A Historical Colossus.pdf
The Roman Empire A Historical Colossus.pdfThe Roman Empire A Historical Colossus.pdf
The Roman Empire A Historical Colossus.pdf
 
Model Attribute Check Company Auto Property
Model Attribute  Check Company Auto PropertyModel Attribute  Check Company Auto Property
Model Attribute Check Company Auto Property
 
GIÁO ÁN DẠY THÊM (KẾ HOẠCH BÀI BUỔI 2) - TIẾNG ANH 8 GLOBAL SUCCESS (2 CỘT) N...
GIÁO ÁN DẠY THÊM (KẾ HOẠCH BÀI BUỔI 2) - TIẾNG ANH 8 GLOBAL SUCCESS (2 CỘT) N...GIÁO ÁN DẠY THÊM (KẾ HOẠCH BÀI BUỔI 2) - TIẾNG ANH 8 GLOBAL SUCCESS (2 CỘT) N...
GIÁO ÁN DẠY THÊM (KẾ HOẠCH BÀI BUỔI 2) - TIẾNG ANH 8 GLOBAL SUCCESS (2 CỘT) N...
 
How libraries can support authors with open access requirements for UKRI fund...
How libraries can support authors with open access requirements for UKRI fund...How libraries can support authors with open access requirements for UKRI fund...
How libraries can support authors with open access requirements for UKRI fund...
 
Mule 4.6 & Java 17 Upgrade | MuleSoft Mysore Meetup #46
Mule 4.6 & Java 17 Upgrade | MuleSoft Mysore Meetup #46Mule 4.6 & Java 17 Upgrade | MuleSoft Mysore Meetup #46
Mule 4.6 & Java 17 Upgrade | MuleSoft Mysore Meetup #46
 
Thesis Statement for students diagnonsed withADHD.ppt
Thesis Statement for students diagnonsed withADHD.pptThesis Statement for students diagnonsed withADHD.ppt
Thesis Statement for students diagnonsed withADHD.ppt
 
1.4 modern child centered education - mahatma gandhi-2.pptx
1.4 modern child centered education - mahatma gandhi-2.pptx1.4 modern child centered education - mahatma gandhi-2.pptx
1.4 modern child centered education - mahatma gandhi-2.pptx
 
Basic phrases for greeting and assisting costumers
Basic phrases for greeting and assisting costumersBasic phrases for greeting and assisting costumers
Basic phrases for greeting and assisting costumers
 
Supporting (UKRI) OA monographs at Salford.pptx
Supporting (UKRI) OA monographs at Salford.pptxSupporting (UKRI) OA monographs at Salford.pptx
Supporting (UKRI) OA monographs at Salford.pptx
 
Overview on Edible Vaccine: Pros & Cons with Mechanism
Overview on Edible Vaccine: Pros & Cons with MechanismOverview on Edible Vaccine: Pros & Cons with Mechanism
Overview on Edible Vaccine: Pros & Cons with Mechanism
 
The approach at University of Liverpool.pptx
The approach at University of Liverpool.pptxThe approach at University of Liverpool.pptx
The approach at University of Liverpool.pptx
 
The Challenger.pdf DNHS Official Publication
The Challenger.pdf DNHS Official PublicationThe Challenger.pdf DNHS Official Publication
The Challenger.pdf DNHS Official Publication
 
ESC Beyond Borders _From EU to You_ InfoPack general.pdf
ESC Beyond Borders _From EU to You_ InfoPack general.pdfESC Beyond Borders _From EU to You_ InfoPack general.pdf
ESC Beyond Borders _From EU to You_ InfoPack general.pdf
 
Ethnobotany and Ethnopharmacology ......
Ethnobotany and Ethnopharmacology ......Ethnobotany and Ethnopharmacology ......
Ethnobotany and Ethnopharmacology ......
 
The geography of Taylor Swift - some ideas
The geography of Taylor Swift - some ideasThe geography of Taylor Swift - some ideas
The geography of Taylor Swift - some ideas
 

Ratio Analysis

  • 1. RATIO ANALYSIS 1 RATIO ANALYSIS Analysis Meaning of Ratio Analysis Ratio analysis is a very important tool of financial analysis. It is the process of establishing the significant relationship between the items of financial statement to provide a meaningful understanding of the performance and financial position of a firm. Ratio when calculated on the basis of accounting information are called ‘Accounting Ratio’. Definitions: Kennedy and Mc Mulla. “The relationship of one to another, expressed in simple term of mathematical is know as ratio” According to Accountant’s Handbook by Wixon, kell and Bedford, a ratio “is an expression of the quantitative relationship between two numbers”. Analysis Nature of Ratio Analysis Ratio analysis is a technique of analysis and interpretation of financial statements. It is the process of establishing and interpreting various ratios for helping in making certain decisions. However, ratio analysis is not an end in itself. It is only a means of better understanding of financial strengths and weakness of a firm. There are a number of ratios which can be calculated from the given information given in the financial statements, but the analyst has to select the appropriate data and calculate only a few appropriate ratios from the same keeping in mind the objectives of analysis. The following are the four steps involved in the ratio analysis: (i) Selection of relevant data from the financial statements depending upon the objective of the analysis. (ii) Calculation of appropriate from the above data. (iii) Comparison of the calculated ratios with the ratios of the same firm in the past, or the ratios developed from the projected financial statements or the ratios of some other firms or the comparison with ratios of the industry to which the firm belongs. (iv) Interpretation of the ratios. Tutorial. School, National Tutorial. Opp. Future Pack School, Upper Gadigarh,Jammu. 0191- Ph. 0191-2262243 Mob. 9796228700, 9697664266, 9086036666
  • 2. RATIO ANALYSIS 2 Uses/Significance/Objects Uses/Significance/Objects or importance of ratio analysis /Signif The ratio analysis is one of the most powerful tools of financial analysis. It is used as a device to analyse and interpret the financial health of the enterprise, just like a doctor examines the patient by recording his body temperature, blood pressure, etc. before making his conclusion regarding the illness and before giving his treatment, a financial analyst analyses the financial statements with various tools of analysis before commencing upon the health or weakness of an enterprise. ‘A ratio is known as a symptom like blood pressure, the pulse rate or the temperature of an individual.’ (A)Usefulness for short term creditors. Short term creditors are trade creditors, bills payables, creditors for expenses etc. The concern pays short term creditors out of its current assets. If the current assets are quit4e sufficient to meet current liabilities then the creditor will not hesitate in extending credit facilities. Current and acid-test ratios will give an idea about the current financial position of the concern. (B) Usefulness for long term creditors. Long term creditors are financial institutions, debenture holders, mortgage creditors etc. are interested in analysing the capacity of the unit of repay periodical interest, and repayment of loan on schedule. (C) Usefulness to Employees. The employees are also interested in the financial position of the concern. Their wages increases and amount of fringe benefits are related to the volume of profits earned by the concern. The employees make use of information available in financial statement. Various profitability ratios relating to gross profit, operating ratio, net profit, etc. enable employees to put forward their viewpoint for the increase of wages and other benefits. (D)Usefulness to the Government. Government is interested in the financial information of the units both at macro as well as micro levels. Individual unit’s information regarding production, sales and profit is required for exercise duty, sales tax and income tax purposes. Group information for the industry is required for formulating national policies and planning. In the absence of dependable information, govt. plans and policies may not achieve desired results. Government is interested to know the overall strength of the industry. The ration may be used as indicators of overall strength of public as well as private sector. In the absence if the reliable economic information, governmental plans policies may not prove successful. Tutorial. School, National Tutorial. Opp. Future Pack School, Upper Gadigarh,Jammu. 0191- Ph. 0191-2262243 Mob. 9796228700, 9697664266, 9086036666
  • 3. RATIO ANALYSIS 3 (E) Usefulness for investors. Investor’s first interest will be the security of his investment and then a return in the form of dividend or interest. The investors can determine the magnitude and direction of the movement in firm’s earnings with the help of profitability ratios such as earning per share, dividend yield, etc. After analyzing the relevant ratios the present investors can decide whether to hold, sell or purchase the shares and the prospective investor can decide whether or not to buy the shares. (F) Usefulness to the management (i) Decision-making: Financial statements are prepared primarily for decision making. Ratios help in high-lighting the areas of deserving attention and corrective action thus facilitating decision making. (ii) Financial forecasting and planning: Planning and forecasting can be done only by knowing the past and the present. Planning is looking ahead and the ratios calculated for a number of years work as a guide for the future. Meaningful conclusions can be drawn for future from these ratios. (iii) Communication: The financial strength and the weakness of a firm are communicated in a more easy and understandable manner by use of ratios. (iv) Co-ordination is facilitated: Ratio even help in co- ordination which is of outmost importance in effective business management. Better communication of efficiency and weakness of an enterprise results in better co-ordination in the enterprise. (v) Control is more effective: Ratio analysis even help in making effective control of the business. Standard ratio can be based upon proforma financial statements and variances or deviations, if any, can be found by comparing the actual with the standards so as to take a corrective action at the right time. The weakness or otherwise, if any, come to the knowledge of the management which helps in effective control of the business. (vi) Other Uses: There are so many uses of ratio analysis. It is an essential part of the budgetary control and standard costing. Ratios are of immense importance in the analysis Tutorial. School, National Tutorial. Opp. Future Pack School, Upper Gadigarh,Jammu. 0191- Ph. 0191-2262243 Mob. 9796228700, 9697664266, 9086036666
  • 4. RATIO ANALYSIS 4 and interpretation of financial statements as they bring the strength or weakness of a firm. Guidelines/Precautions/Factors considered while undertaking Ratio Analysis. 1. Quality/Accuracy of Financial Statement: The ratios are calculated from the data available in financial statements. The reliability of ratios is linked to the accuracy of information in these statements. Before calculating ratios one should see whether proper concepts and conventions have been used for preparing financial or not. 2. Objectives/purposes of Analysis: The type of ratios to be calculated will depend upon the purposes for which are required. The purpose of user is also important for the analysis of ratios. Creditors, a banker, an investor, a shareholder, all have different objects for studying ratios. The purpose or object for which ratios are required to be studied should always be kept in mind for studying various ratios. Different objects may require the study of different ratios. 3. Selection of Ratios: Another precaution in ratio analysis is the proper selection of appropriate ratios. The ratios should match the purpose for which these are required. Only those ratios should be selected which can throw proper light on the matter to be discussed. 4. Use of standards: The ratios will give an indication of financial position only when discussed with reference to certain standards. These standard may be rule of thumb as in case of current ratio (2:1) and acid-test ratio (1:1), may be industry standards, may be budgeted or projected ratios, etc. 5. Capability of the analyst: Analysis is a tool in the hands of analyst. Knife in the hands of criminal may take the life but the knife in the hands of a surgeon may give new life to a patient. Interpretation depends on the educational background; professional skill; experience and intuition of the professional conducting it. 6. Ratio to be used only as guide: Ratios can provide, at the best, the starting point. The analyst, before arriving at the conclusion, should take into consideration all other relevant factors financial and non- financial; macro and micro. Tutorial. School, National Tutorial. Opp. Future Pack School, Upper Gadigarh,Jammu. 0191- Ph. 0191-2262243 Mob. 9796228700, 9697664266, 9086036666
  • 5. RATIO ANALYSIS 5 Advantages of Ratio Analysis Following are some of the advantages of ratio analysis: 1. Simplifies financial statements. Ratio analysis simplifies the comprehension of financial statements. Ratios tell the whole story of changes in the financial condition of a business. 2. Facilitates inter firm comparison. Analysis provides data for inter firm comparison. Ratios high-light the factors associated with successful and unsuccessful firms. They also reveal strong firms and weak firms, overvalued and undervalued firms. 3. Makes inter-firm comparison possible. Ratio analysis also makes possible comparison of the performance of the different of the firm. The ratios are helpful in deciding about their efficiency or otherwise in the past and likely performance in the future. 4. Helps in planning. Ratio analysis helps in planning and forecasting. Over a period of time a firm or industry develops certain norms that may indicate future success or failure. Thus ratios can assist management in its basic function of forecasting, planning, co-ordination, control and communication. LIMITATIONS OF RATIO ANALYSIS The ratio analysis is one of the most powerful tools of the financial management. Ratio analysis is a widely used and useful technique to evaluate the financial position and performance of any business unit but it suffers from a number of limitations. These limitations must be kept in mind by the analyst while using this technique. 1. Limited use of a Single Ratio: A single ratio, usually, does not convey much of a sense. To make a better interpretation a number of ratios have to be calculated which is likely to confuse the analyst than help him to in making any meaningful conclusion. 2. Lack of adequate standards: There are no well accepted standards or rules of thumb for all ratios which can be accepted as norms. It renders interpretation of the ratios difficult. 3. Inherent Limitation of accounting: Like financial statements, ratios also suffer from the inherent weakness of accounting records Tutorial. School, National Tutorial. Opp. Future Pack School, Upper Gadigarh,Jammu. 0191- Ph. 0191-2262243 Mob. 9796228700, 9697664266, 9086036666
  • 6. RATIO ANALYSIS 6 such as their historical nature. Ratios of the past are not necessary true indicators of the future. 4. Change of accounting procedure: Change in accounting procedure by a firm often makes ratio analysis misleading, e.g., a change in the valuation of methods of inventories, from FIFO to LIFO increases the cost of sales and reduces considerably the value of closing stocks which makes stock turnover ratio to be lucrative and an unfavourable gross profit ratio. 5. Personal Bias: Ratios are only means of financial analysis and not an end in itself. Ratios have to be interpreted and different people may interpret the same ratio in different ways. 6. Uncomparable: Not only industries differ in their nature but also the firms of the similar business widely differ in their size and accounting procedures, etc. It makes comparison of ratios difficult and misleading. Moreover, comparisons are made difficult due to differences in definition of various financial terms used in the ratio analysis. 7. Absolute Figures Distortive: Ratio devoid of absolute figures may prove distortive as ratio analysis is primarily a quantitative analysis and not a qualitative analysis. 8. Price level Changes: While making ratio analysis, no consideration is made to the changes in price levels and this makes the interpretation of ratio invalid. 9. Ratios no Substitutes: Ratio analysis is merely a tool of financial statements. Hence, ratios become useless if separated from the statements from which they are computed. 10.Clues not Conclusions: Ratios provide only clues to analysts and not final conclusions. These ratios to be interpreted by these experts and there are no standard rules for interpretation. CLASSIFICATION OF RATIOS The use of ratio analysis is not confined to financial manager only. There are different parties interested in the ratio analysis for knowing the financial position of a firm for different purposes. Tutorial. School, National Tutorial. Opp. Future Pack School, Upper Gadigarh,Jammu. 0191- Ph. 0191-2262243 Mob. 9796228700, 9697664266, 9086036666
  • 7. RATIO ANALYSIS 7 Various accounting ratios can be classified as follows: RATIOS Traditional Classification Functional Classification Significance Ratios Or Or Or Statement Ratios Classification According To Tests Ratios According to Importance 1. Traditional Classification or statement Ratios Traditional Classification or classification according to the statement, from which these ratios are calculated, is as follows: Traditional Classification or Statement Ratios Balance Sheet Ratios Profit & Loss Account Ratio Composite /Mixed or or or Position Statement Ratios Revenue/Income Statement Ratios Inter-Statement ratios Current Ratio Gross Profit Ratio Stock Turnover Ratio Liquid Ratio Operating Ratio Debtors Turnover Ratio Absolute Liquidity Ratio Operating Profit Ratio Payable Turnover Ratio Debt Equity Ratio Net Profit Ratio Fixed Assets Turnover Ratio Proprietory Ratio Cash Profit Ratio Return on Equity Capital Gearing Ratio Expenses ratio Return on Shareholders’ Funds Assets-Proprietorship Ratio Interest Coverage Ratio Return on Capital Employed Capital Inventory to Capital Turnover Ratio Working Capital Ratio Working Capital Turnover Ratio Ratio of Current Assets to Return on Total Resources Fixed Assets Total Assets Turnover a) Balance Sheet or Position Statement Ratios: Balance Sheet Ratios deal with the relationship between two balance sheet items, e.g. the Tutorial. School, National Tutorial. Opp. Future Pack School, Upper Gadigarh,Jammu. 0191- Ph. 0191-2262243 Mob. 9796228700, 9697664266, 9086036666
  • 8. RATIO ANALYSIS 8 ratio of current assets to current liabilities, or the ratio of proprietors’ funds to fixed assets. b) Profit and Loss Account or Revenue/Income Statement Ratios: These ratios deals with the relationship between two profit and losses account items, e.g., the ratio of gross profit to sales, or the ratio of net profit to sales. c) Composite/mixed ratios or Inter Statement Ratios: These ratios exhibit the relation between a profit and loss account or income statement item and balance sheet item, e.g., stock turnover ratio, or the ratio of total assets to sales. The most commonly used inter-statement ratios are given in the chart exhibiting traditional classification or statement ratios. 2. Functional Classification or Classification According to Tests In view of the financial management or according to the tests satisfied, various ratios have been classified as below: Functional Classification in View of Financial Management or Classification According to Tests Liquidity Ratios Long-term Solvency Activity Ratios or Assets Profitability Ratios & Leverage Ratios Management Ratios Current Ratio Financing operating, Inventory Turnover In Relation to Sales Liquid Ratio Composite Ratio Gross Profit Ratio Or Debtors Turnover Operating Ratio Acid Test ratio Debt/Equity Ratio Fixed Assets Operating Profit Ratio Or Debt to Total Turnover Ratio Net Profit Ratio Quick ratio Capital Ratio Total Assets Expense Ratio Absolute Liquid Interest Coverage Turnover Ratio Ratio Cash Flow/Debt Working Capital In relation to Or Capital Gearing Turnover Ratio investments Cash ratio Payables Turnover Return on Investments Interval Measure Ratio Return on Capital Capital Employed Return on Equity Capital Debtors Turnover Turnover Return on Total Resources Ratio Earnings per share Creditors Turnover Price-Earning Ratio ratio Inventory Turnover Ratio. Tutorial. School, National Tutorial. Opp. Future Pack School, Upper Gadigarh,Jammu. 0191- Ph. 0191-2262243 Mob. 9796228700, 9697664266, 9086036666
  • 9. RATIO ANALYSIS 9 a) Liquidity Ratios: These are the ratios which measure the short-term solvency or financial position of a firm. These ratios are calculated to comment upon the short-term paying capacity of a concern or the firm’s ability to meet its current obligations. The various liquidity ratios are current ratio, liquidity ratio ad absolute liquid ratio. b) Long-term Solvency and Leverage Ratios: These are meant for testing long-term financial soundness of any unit. Primarily, these establish and study relationship between owned funds and loaned funds. For example, debt-equity ratio, capital gearing ratio etc., are covered under this group. The leverage ratios can further be classified as: (i) Financial leverage. (ii) Operating Leverage. (iii) Composite Leverage. c) Activity Ratios: Activity ratios are calculated to measure the efficiency with which the resources of a firm have been employed. These ratios are also called turnover ratios because they indicate the speed with which assets are being turned over into sales, e.g., debtors turnover ratio. The various activity or turnover ratios have been named in the chart classifying the ratios. d) Profitability Ratios: These ratios are measure the working results of the unit during the accounting period. Profits are compared with sales level and investment level. The various profitability ratio have been given in the chart exhibiting the classification of ratios according to test. Generally, two types of profitability ratios are calculated: (i) In relation to sales (ii) In relation to investments. 3. Classification According to Significance or Importance The ratios have also been classified according to their significance or importance. Some ratios are more important than others and the firm may classify them as primary and secondary ratios. The British Institute of Management has recommended the classification of ratio according to importance for inter-firm comparisons. For inter-firm comparisons, the ratios may be classified as Primary Ratios and Secondary Ratios. The primary ratio is one which is of the prime importance to a concern; thus return on capital employed is named as primary ratio. The other ratios which support or explain the primary ratio are called secondary ratios, e.g., the relationship of opening profit to sales or the relationship of sales to total assets of the firm. Tutorial. School, National Tutorial. Opp. Future Pack School, Upper Gadigarh,Jammu. 0191- Ph. 0191-2262243 Mob. 9796228700, 9697664266, 9086036666
  • 10. RATIO ANALYSIS 10 List of current assets and current liabilities. Current Assets Current Liabilities Cash-in-Hand Sundry Creditors Cash-at-Bank Bills Payable Bills Receivable Outstanding Expenses Sundry Debtors Bank Overdraft Less Provision for Bad debt Taxes Payable Marketable Securities Dividend Payable Temporary Investments Short-term advances Stock: Income received in advance Raw Materials Income tax Payable Work-in-Progress Finished Goods Short-term investments Recoverable Advances Prepaid Expenses Accrued Incomes Advance Taxes (I) LIQUIDITY RATIO: Current Ratio = Current Assets Current Liabilities Current Assets = Total assets Fixed assets Or = Working Capital + Current liabilities Liquidity Ratio/Quick Ratio/Acid Test Ratio = Liquid Assets/Quick Assets Current Liabilities Liquid assets/Quick Assets = Current assets Stock Prepaid Expenses (II) SOLVENCY RATIO/CAPITAL STRUCTURE RATIO/TEST OF LONG TERM SOLVENCY: Debt equity Ratio = Long Term Debts Total Shareholder’s Funds Long term debts = Debentures + other long term loans Shareholder’s Funds = Equity Share Capital + Preference Share Capital + Reserve & Surplus + Profit & Loss account Preliminary expenses Fictitious Assets Proprietary Ratio/Ratio of owner equity to total assets = Proprietor’s Funds Total Assets Total Assets to Debt Ratio = Total Assets Long Term debts Tutorial. School, National Tutorial. Opp. Future Pack School, Upper Gadigarh,Jammu. 0191- Ph. 0191-2262243 Mob. 9796228700, 9697664266, 9086036666
  • 11. RATIO ANALYSIS 11 (III) ACTIVITY RATIO/TURNOVER RATIO/PERFORMANCE RATIO/EFFICIENCY RATIO: Stock Turnover Ratio = Cost of Goods Sold Average Stock Debtors/Receivable turnover Ratio = Net Credit Sale Average debtors Creditors/Payable turnover Ratio = Net Credit Purchase Average Creditors Working Capital turnover Ratio = Cost of Goods sold/Net Sales Net Working Capital Fixed Assets turnover Ratio = Cost of Goods Sold/Net Sales Net Fixed Assets Current Assets turnover ratio = Cost of Goods Sold/Net Sales Current assets Cost of Goods sold = Net Sales Gross Profit Net Credit sales = Total sales Cash sale Sales return Net Credit Purchase = Total Purchase Cash purchase Returns Total Debtors = Sundry Debtors + B/R Provision for doubtful debts Total Creditors = Sundry creditors + Bills Payable Net Working Capital = Total Current assets Total Current Liabilities Net Fixed assets = Total Assets Current Assets Current Assets = Total Assets Fixed assets (IV) PROFITABILITY RATIO: Gross Profit Ratio/Gross Margin Ratio = Gross Profit Net Sales X 100 Net Profit Ratio = Net Profit(after tax) Net Sales X 100 Operating Ratio = Total Operating Cost X 100 Net Sales Operating Profit Ratio = Operating Profit Net Sales X 100 Return on Capital Employed/Return on Investment = = Net Profit before Tax & Dividend X 100 Capital Employed Earning Per Share(EPS) = Net Profit (after tax & Preference dividend) No. of Equity Shares X 100 Dividend Per Share(DPS) = Dividend paid to equity shareholder X 100 Number of equity shares Tutorial. School, National Tutorial. Opp. Future Pack School, Upper Gadigarh,Jammu. 0191- Ph. 0191-2262243 Mob. 9796228700, 9697664266, 9086036666
  • 12. RATIO ANALYSIS 12 Price Earning Ratio(PER) = Current Marketable Equity of Equity Share Earning Per Share X 100 Gross Profit = Net Sale Cost of Goods Sold Net profit = Net operating Profit + Non Operating Income Non operating Expenses Net Profit = Gross Profit + All other incomes All expenses Operating Cost = Cost of Goods Sold + Office & Administration Expenses + Selling & Distribution Expenses + Financial Expenses + Repair and Maintenance Operating Profit = Net Sales Operating Cost Operating Expenses = Administration + Selling Expenses Where Capital Employed = Share Capital (Equity + Preference) + Reserves and Surplus + Long-term Loans – Fictitious Assets Or Capital Employed = Fixed Assets + Current Assets – Current Liabilities Shareholders’ Funds = Equity Share Capital + Reserves and Surplus – Fictitious Assets Fictitious Assets = Underwriting Commission + Preliminary Expenses + Discount or Loss on Issue of Shares/Debentures and miscellaneous Expenses Return on Investment or Return on Capital Employed: This ratio shows the relationship between the profit earned before interest and tax and the capital employed to earn such profit. Return on Equity: Return on equity is also known as return on shareholders’ investment. The ratio establishes relationship between profits available to equity shareholders with equity shareholders’ funds. Earning Per Share: Earning per share is calculated by dividing the net profit (after interest, tax and preference dividend) by the number of equity shares. THOUGHT Education is not the filling of a pail, but the lighting of Education a fire. Tutorial. School, National Tutorial. Opp. Future Pack School, Upper Gadigarh,Jammu. 0191- Ph. 0191-2262243 Mob. 9796228700, 9697664266, 9086036666